Well, this is an interesting series of earthquakes. They occurred in a region that has not had any earthquakes (given the USGS NEIC database). However, as Jascha Polet pointed out on twitter, there was a swarm to the east in 2011 (here is the University of Nevada Reno Seimological Laboratory page on these 2011 Hawthorne Earthquake Sequence). These two swarms are slightly different in this complicated region of the Pacific-North America plate boundary. A portion of the Pacific-North America plate boundary motion is partitioned along the eastern side of the Sierra Nevada mountains along the Eastern California shear zone, the Walker Lane, and eventually zones like the Mohawk Valley fault zone. Further to the east exists Basin and Range (B&R) extension and along the boundary there is some combination of dextral (right-lateral) shear and B&R extension.
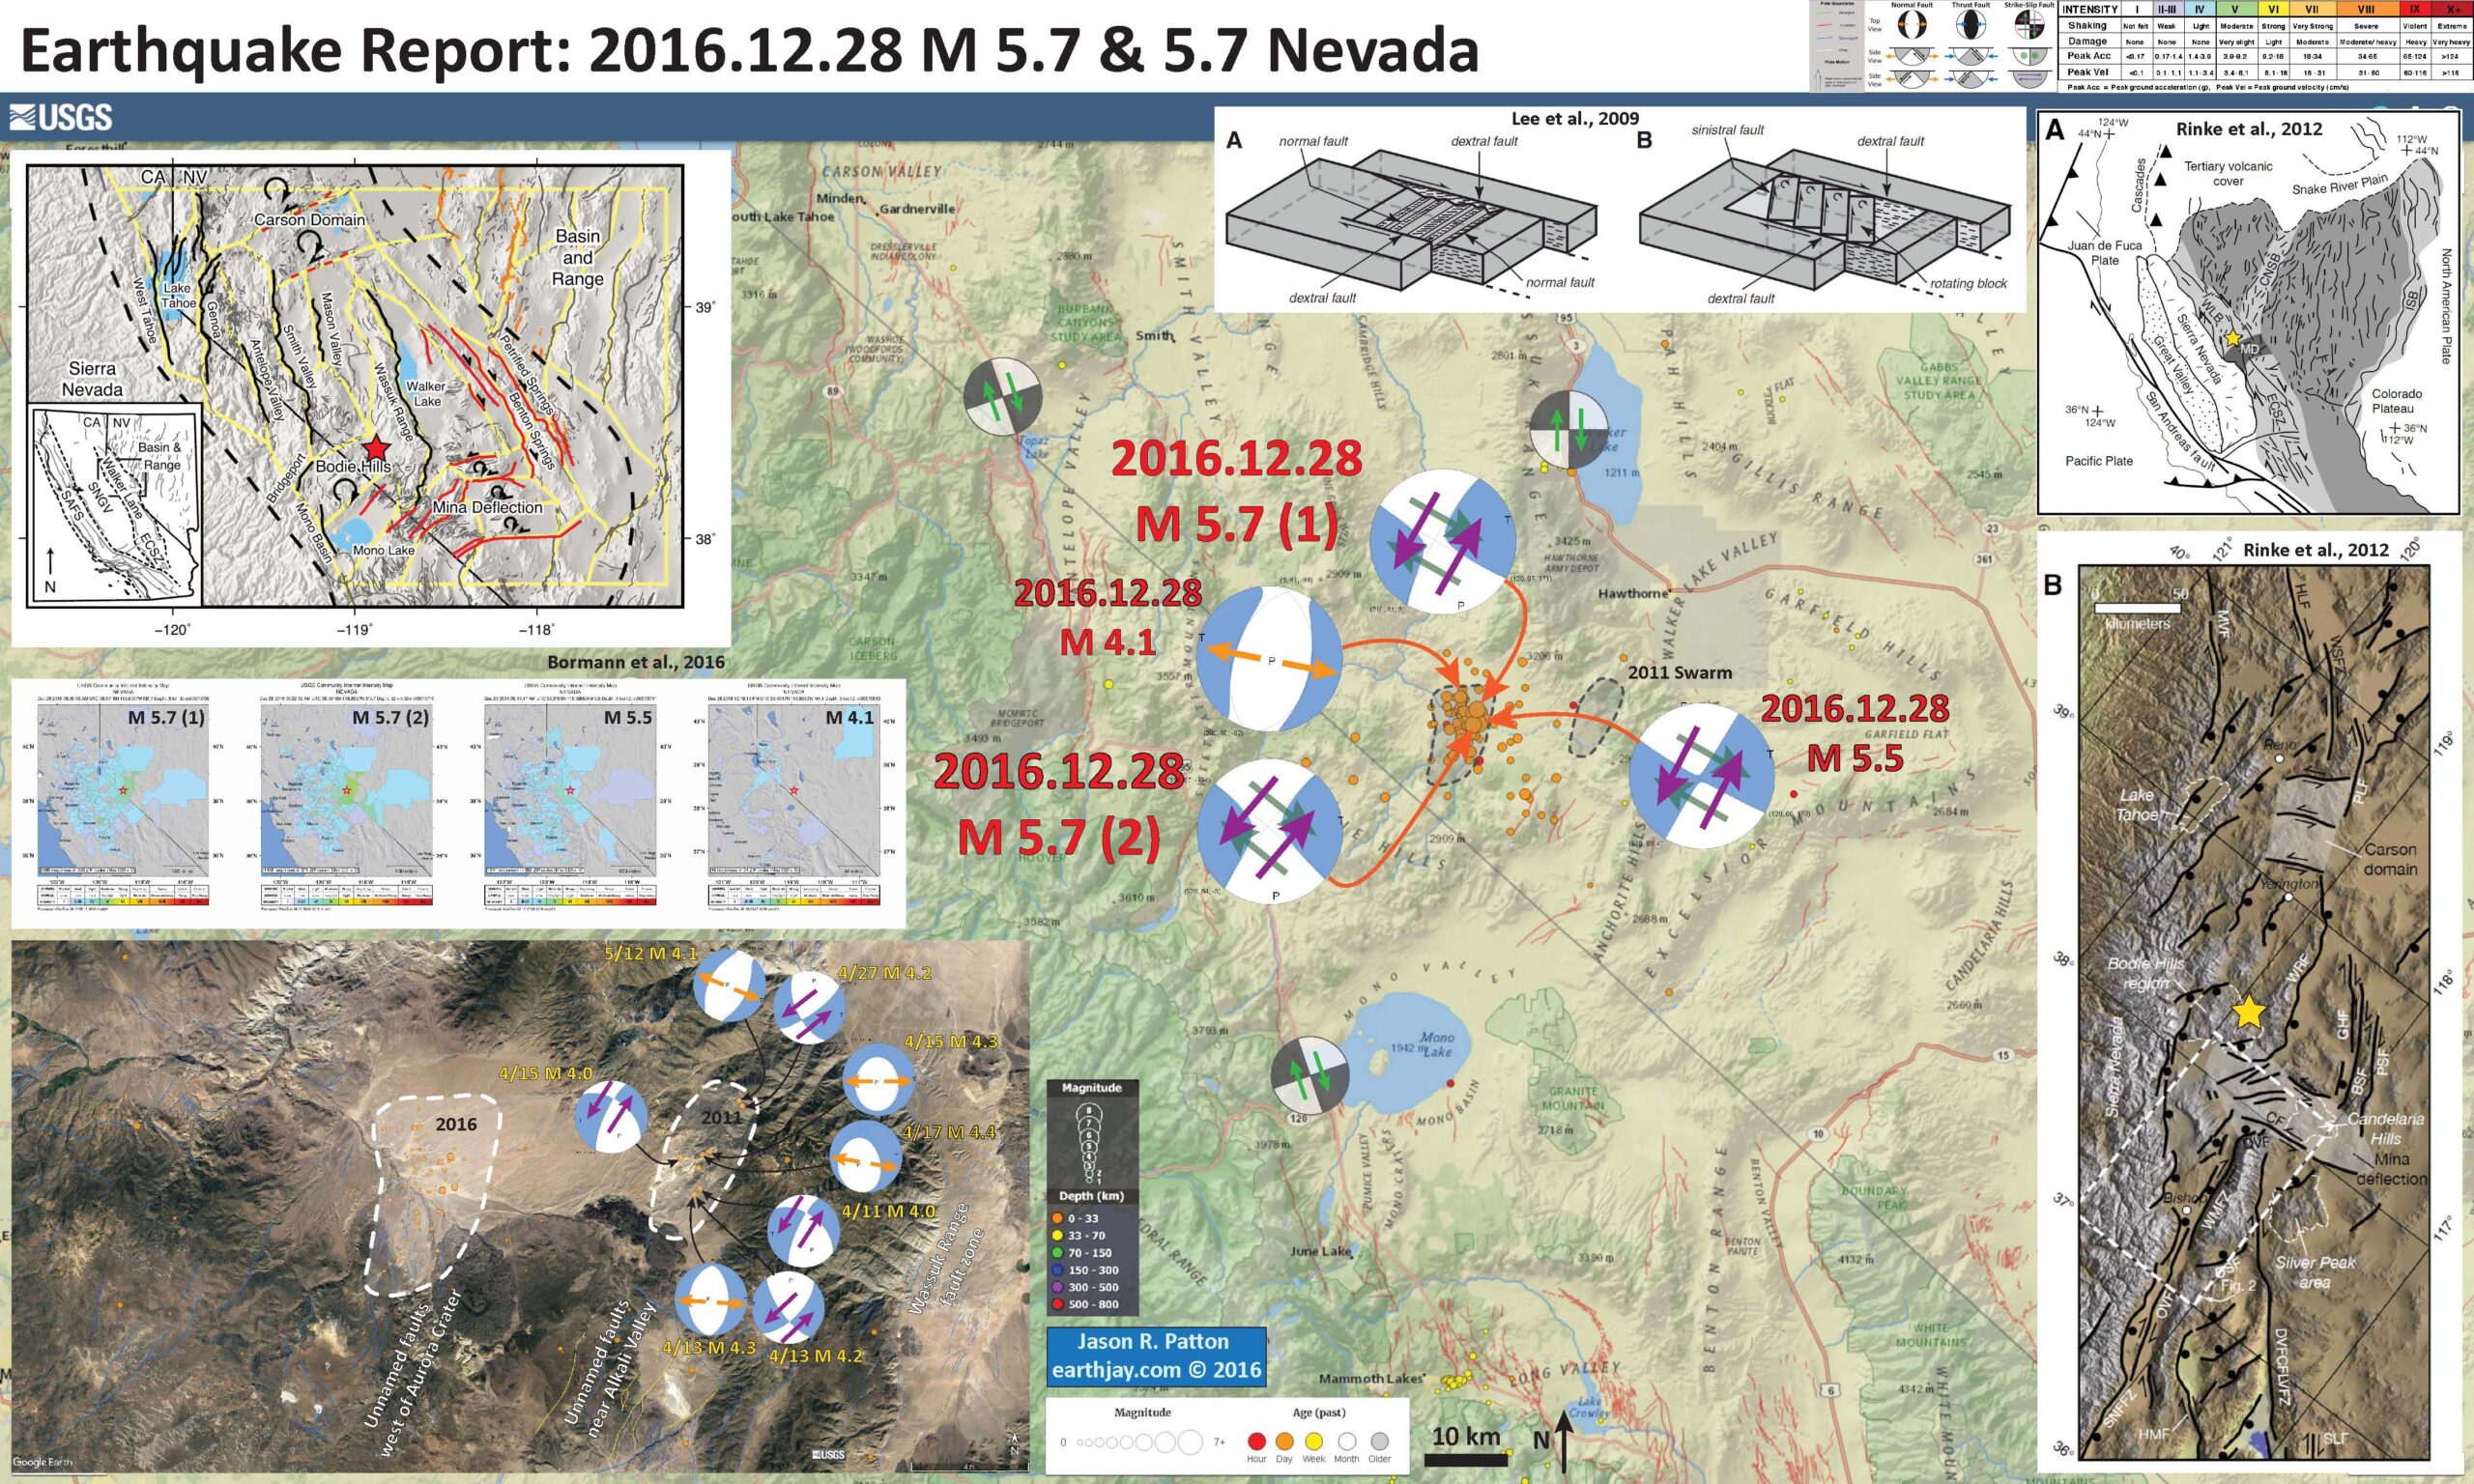
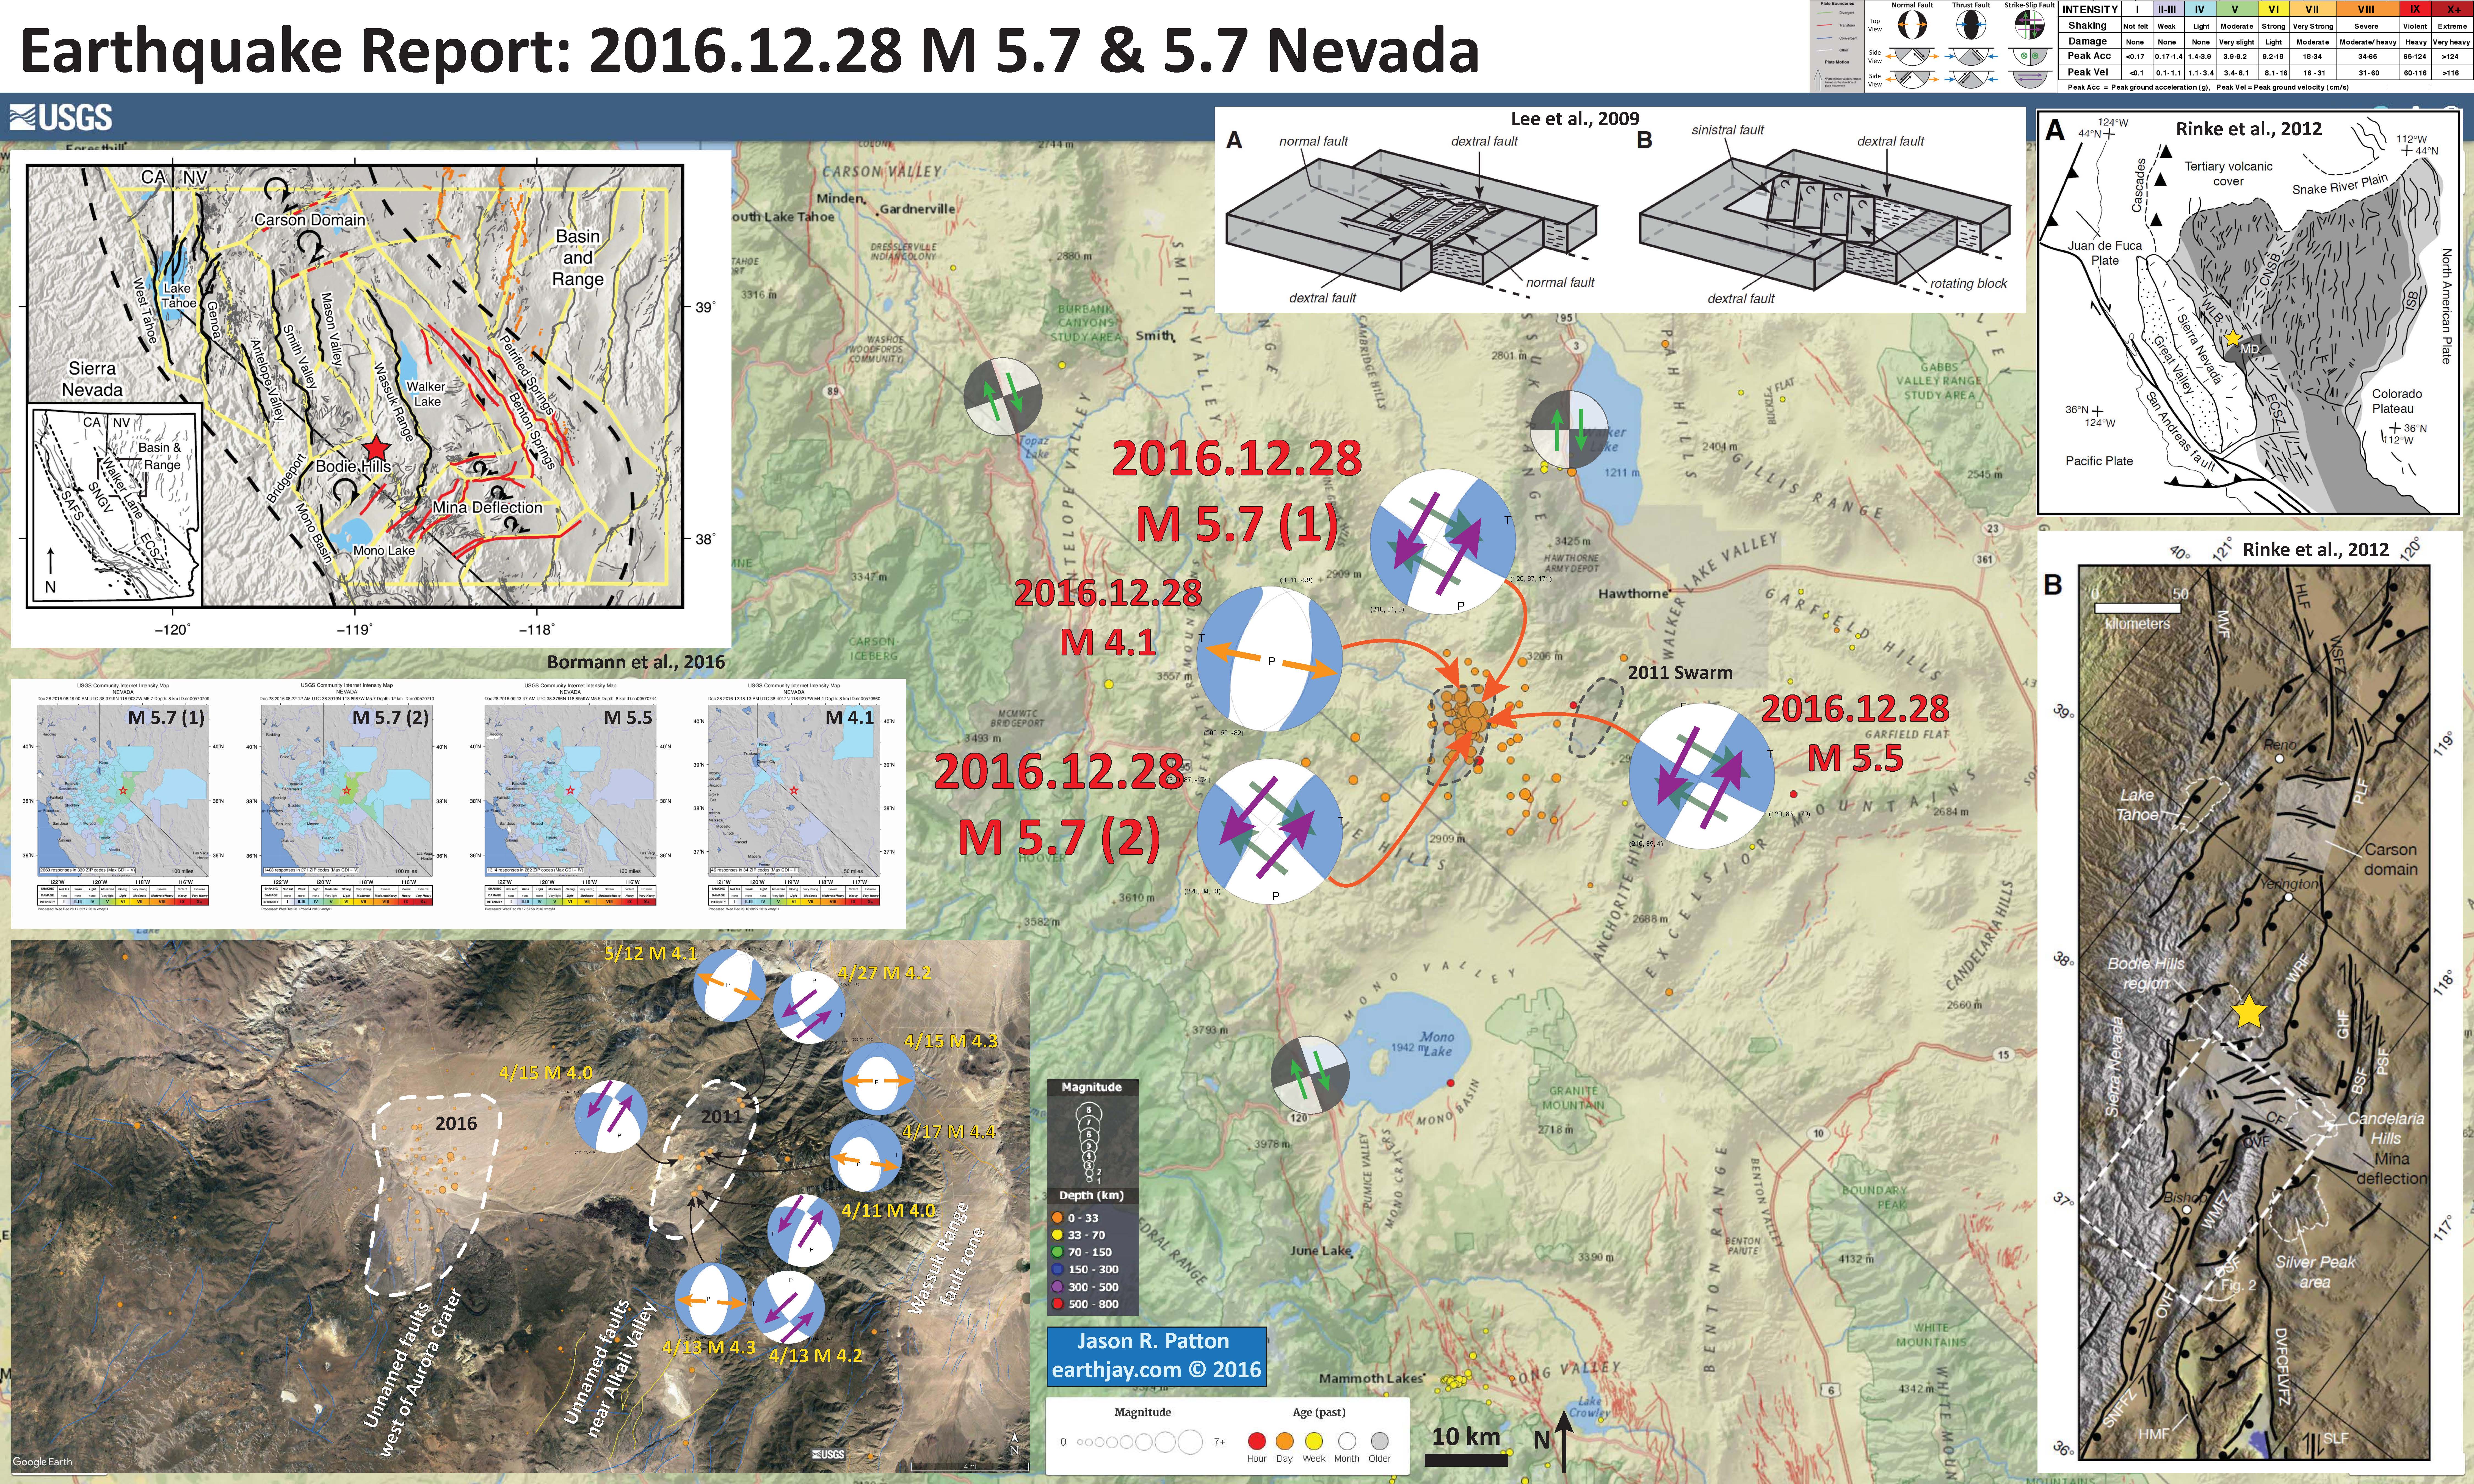
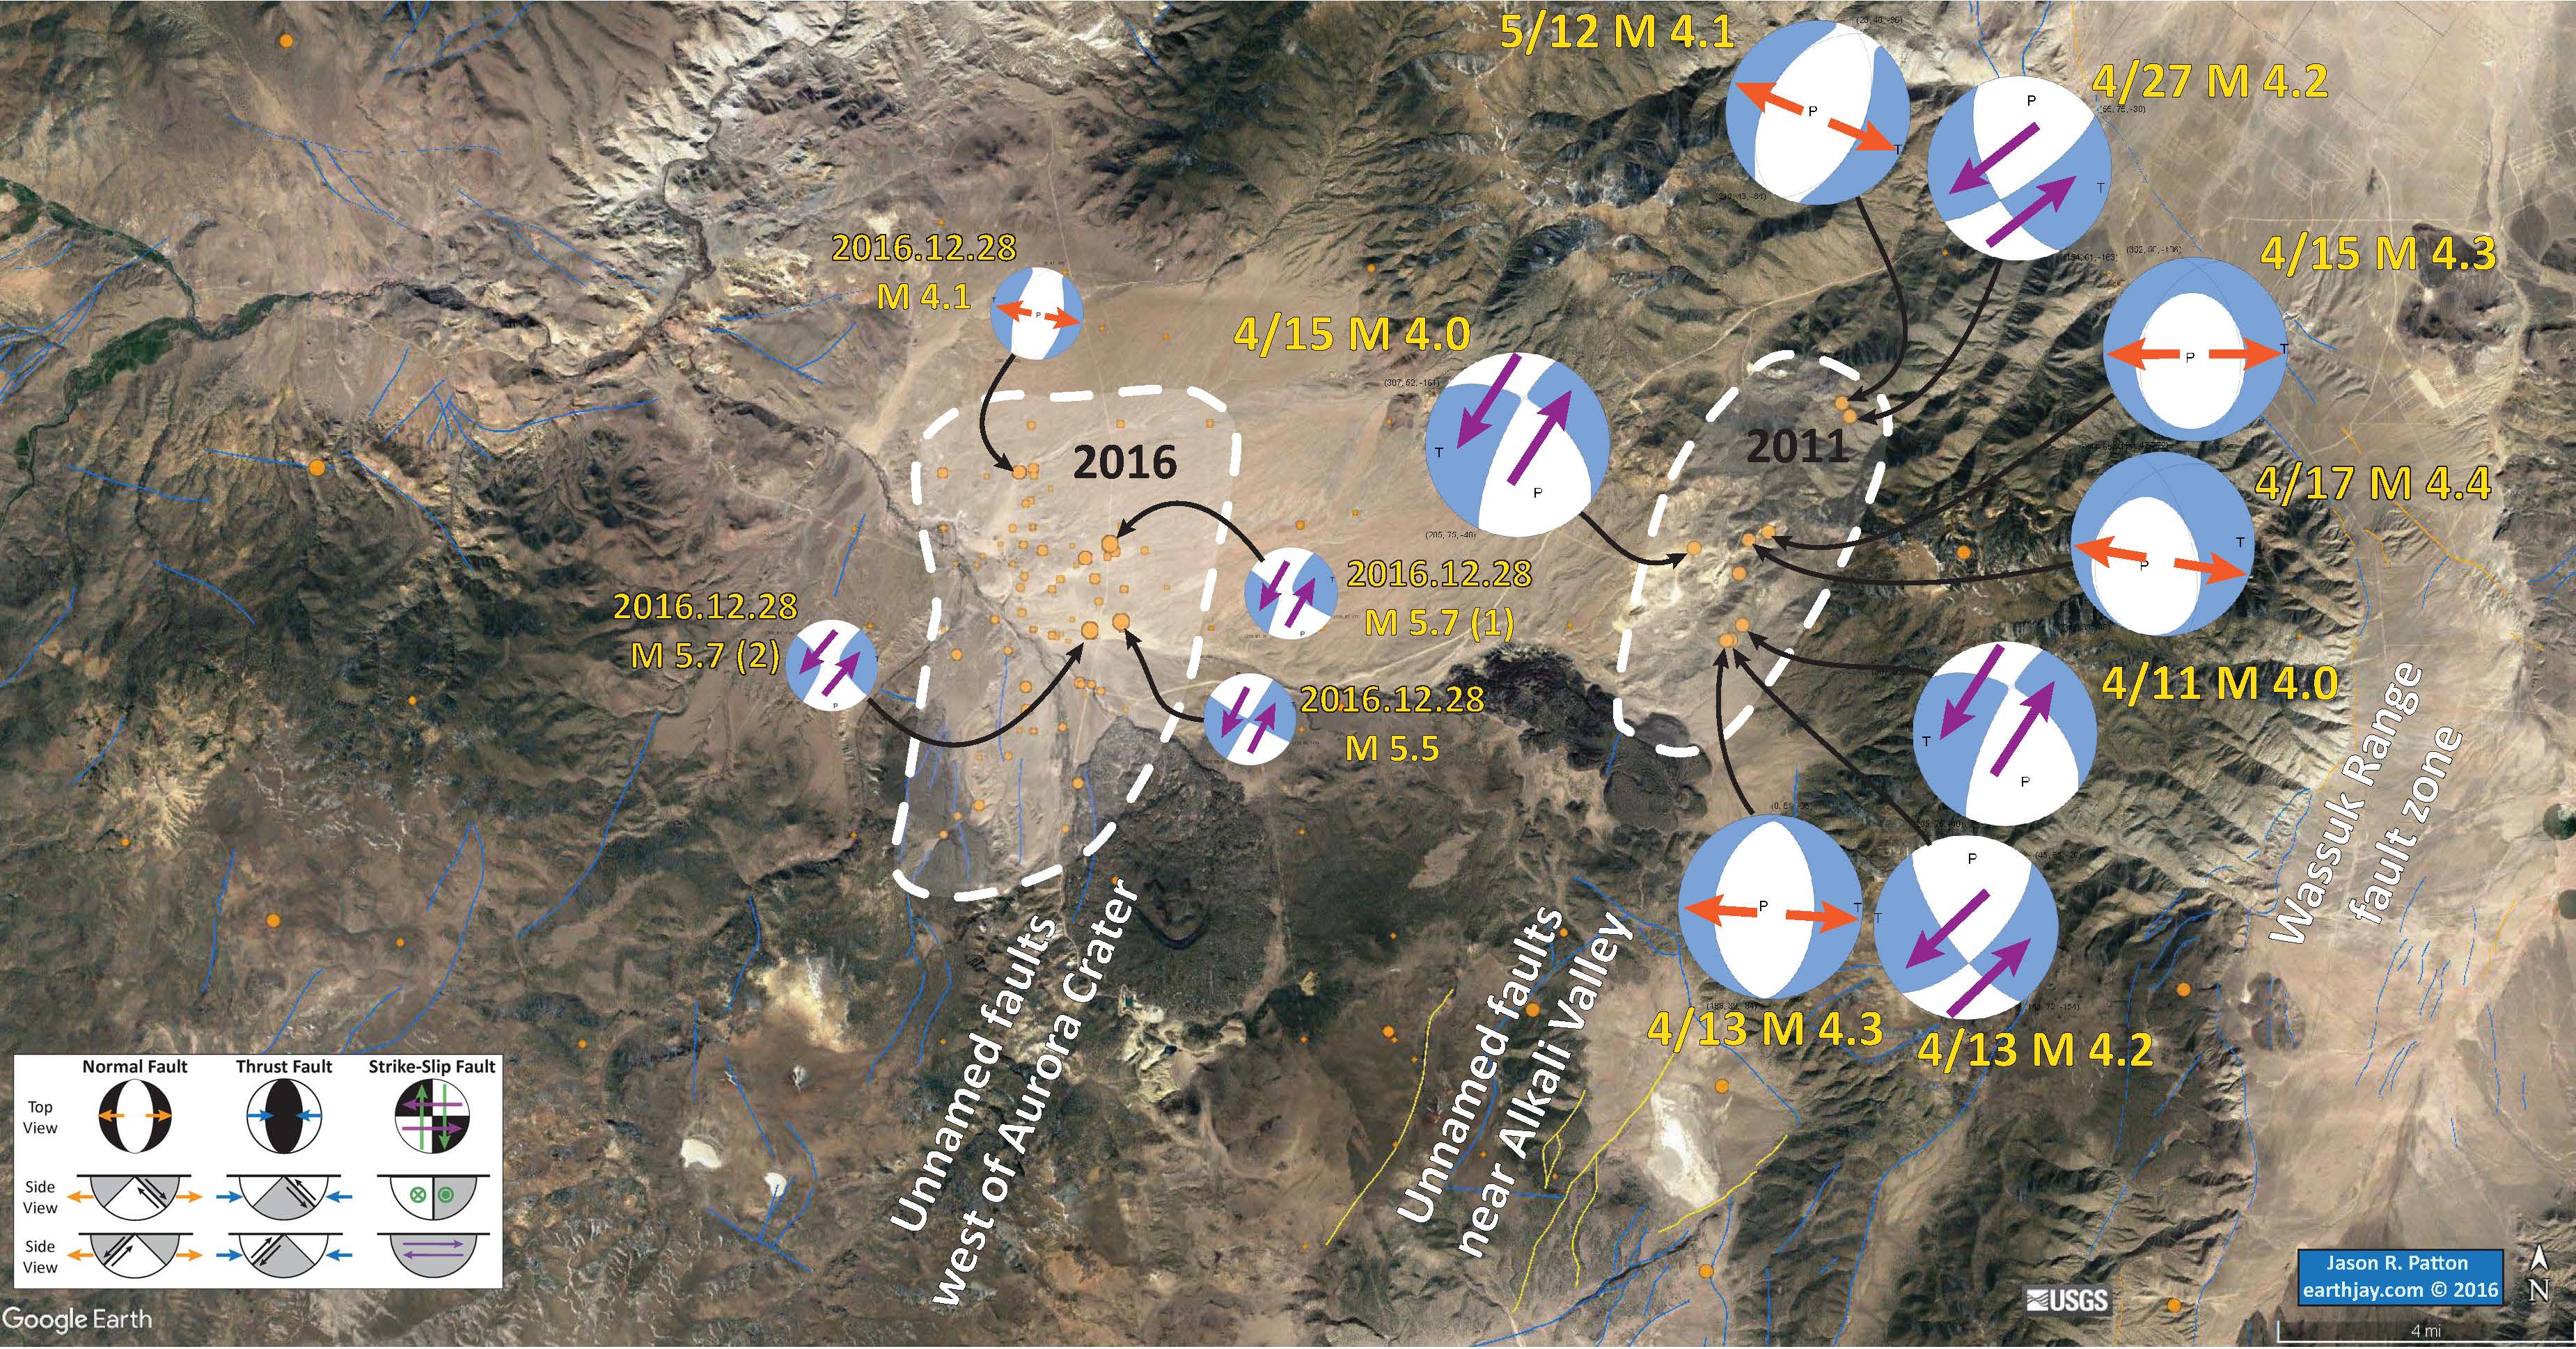
Below I present an interpretive poster for this earthquake series.
I plot the seismicity from the past week, with color representing time and diameter representing magnitude (see legend). I include the active faults from the USGS active fault and fold database. I include moment tensors for the four largest earthquakes in this series.
- I placed a moment tensor / focal mechanism legend on the poster. There is more material from the USGS web sites about moment tensors and focal mechanisms (the beach ball symbols). Both moment tensors and focal mechanisms are solutions to seismologic data that reveal two possible interpretations for fault orientation and sense of motion. One must use other information, like the regional tectonics, to interpret which of the two possibilities is more likely. The moment tensor shows northeast-southwest compression, perpendicular to the convergence at this plate boundary. Most of the recent seismicity in this region is associated with convergence along the New Britain trench or the South Solomon trench.
At first, I saw the strike-slip moment tensors and thought about the Mina deflection, which is actually further to the south of this swarm. The Mina deflection is an interesting area where the plate boundary motion is diverted to the east along sinistral (left lateral) faults formed by rotating blocks (Lee et al., 2009; Wesnousky et al., 2010, 2012; Rinke et al., 2012; Bormann et al., 2016). There is still debate about how plate motion is accommodated in this region.
What I found interesting is that these 2016 earthquakes do not (at first) appear to fit any existing tectonic model, but are consistent with some faults mapped that may be associated with the 2011 earthquakes. The Wassuk fault to the east accommodates dextral slip associated with the plate boundary (Adams and Sawyer, 1999 (A)). Other faults in the region are characterized a little differently. The mapped faults that probably were activated in 2011 (Adams and Sawyer, 1998) are considered left-lateral and normal. The existing mapped faults to the south of this 2016 swarm are mapped as normal faults based upon offset topography (Adams and Sawyer, 1998 (B)). These unnamed faults west of Aurora Crater, possibly activated today, are classified as younger than 1.6 Ma and have a low slip rate (< 0.2 mm/yr). It is possible that these Aurora Crater faults are more active than 1.6 Ma or that other, more active faults, have not yet been mapped yet. Unfortunately, the M 5.7 probably won't produce surface rupture. What is interesting is that the strike-slip faults in the Mina deflection (MD) to the south are either northwesterly trending dextral or easterly trending sinistral faults. I will discuss this below when I present others' figures. Both interpretations seem possible, but I favor a northeast striking left-lateral interpretation.
- 2016.12.28 08:22 M 5.7
- 2016.12.28 08:18 M 5.7
- 2016.12.28 09:13 M 5.5
- 2016.12.28 12:18 M 4.1
Here are the USGS websites for the larger earthquakes in this 2016 swarm.
- In the upper right corner, I include a map that shows the plate boundary scale tectonics for the western US (Nagorsen-Rinke et al., 2012). I placed a yellow star in the general location of the 2016 earthquake series.
- To the left of this map I include an illustration from Lee et al. (2009) that shows how the faults in the Mina deflection may have formed. Another version of this figure is found in Nagorsen-Rinke et al. (2012). Note how the sinistral faults form as the blocks rotate between faults formed through dextral shear formed by the Pacific-North America plate boundary motion.
- In the lower right corner I include a smaller scale map that shows the regional scale faulting in the region (Nagorsen-Rinke et al., 2012). I place a yellow star in the location of today’s earthquake swarm.
- In the upper left corner I include a map from Bormann et al. (2016) that shows tectonic domains as devised by the authors based upon Global Positioning System (GPS) geodetic observations. GPS geodesy is the study of the deformation of Earth’s surface through the use of GPS observations for 3-D positions. I place a red star where today’s earthquakes occurred. Note how these earthquakes are along the boundary of the Mono Basin and Walker Range tectonic domains. There are many short faults in this region forming a complicated tectonic region. The low slip rates for these faults make it difficult to use GPS geodesy to resolve the strain and sense of motion along these faults.
- Below this map I include the USGS Did You Feel It? maps for the 4 largest earthquakes. These maps show estimates of ground motions that is actually based on real observations as submitted to the USGS website for each of these earthquakes. Note how the M 4.1 was felt in slightly different regions than the other earthquakes. The M 4.1 earthquake was an extensional earthquake, compared to strike-slip for the others. This most likely contributed to these variations in ground motions, in addition to the magnitude differences.
- In the lower left corner I include a Google Earth map that shows the seismicity from 1900-2016 for earthquakes with magnitudes M ≥ 4.0. I outline the 2011 and 2016 regions of seismicity in dashed white lines. Here is the query that I used to find these earthquakes. I label the major fault zones in this region. Note how the 2011 swarm was mostly extensional, but there were a few strike-slip earthquakes. If these are related to the unnamed faults near Alkali Valley, then they are probably northeast striking sinistral (left-lateral) strike-slip earthquakes.
I include some inset figures in the poster.
- Unnamed faults west of Aurora Crater, Adams and Sawyer, 1998 (B)
- Unnamed faults near Alkali Valley, Adams and Sawyer, 1998 (A)
- Wassuk Range fault zone, Adams and Sawyer, 1999
Here are the USGS web pages for the three fault zones labeled in the inset map.
- Here are the two figures from Rinke et al. (2012) that show the global and regional tectonics here. I include the figure captions below as blockquotes. The first map shows the plate boundary scale tectonic regions. This is a generalized map (e.g. don’t pay attention to where the San Andreas and Cascadia faults are located). The second map shows the regional fault systems.
Simplified tectonic map of the western U.S. Cordillera showing the modern plate boundaries and tectonic provinces. Basin and Range Province is in medium gray; Central Nevada seismic belt (CNSB), eastern California shear zone (ECSZ), Intermountain seismic belt (ISB), and Walker Lane belt (WLB) are in light gray; Mina deflection (MD) is in dark gray.
Shaded relief map of the WLB and northern part of the ECSZ showing the major Quaternary faults. Solid ball is located on the hanging wall of normal faults; arrow pairs indicate relative motion across strike-slip faults; white dashed box outlines location of Figure 2; light gray shaded areas show the Mina deflection and the Carson domain. BSF—Benton Springs fault; CF—Coaldale fault; DSF—Deep Springs fault; DVFCFLVFZ—Death Valley–Furnace Creek–Fish Lake Valley fault zone; GHF—Gumdrop Hills fault; HLF—Honey Lake fault; HMF—Hunter Mountain fault; MVF—Mohawk Valley fault; OVF— Owens Valley fault; PLF—Pyramid Lake fault; PSF—Petrifi ed Springs fault; QVF—Queen Valley fault; SLF—Stateline fault; SNFFZ—Sierra Nevada frontal fault zone; WMFZ—White Mountains fault zone; WRF—Wassuk Range fault; WSFZ—Warm Springs fault zone.
- Here is a figure from Wesnousky et al. (2012) where a wax block model is used to illustrate their interpretations of the tectonic deformation along the Walker Lane region. Today’s earthquakes occurred in the basin to the west of the circled number “7.”
(Left) Model to visualize accommodation of strain and development of basins in northern Walker lane. The upper is a block of wax has been heated to become ductile and subjected to transtensional right-lateral shear. Ice has been applied to the surface of lower wax block to create brittle upon ductile layer, and then subjected to same shear. The transtensional shear results in a zone of deformation displaying rotation of ‘crustal blocks’, an en echelon arrangement of asymmetric ‘basins,’ observable extension along the axis of shear, and the ability to locally traverse the entire zone of shear without encountering a major fault structure. (Right) Oblique view of study area illustrates the en echelon arrangement and triangular shape of basins nested along the east edge of the Sierra Nevada. Black and colored lines are portions of Walker Lane faults shown in Fig. 1 (Wesnousky et al., 2012)
- Here are the geodetic observations for each of these blocks along the Walker Lane (Wesnousky et al., 2012). GPS rates are plotted as red vectors. Geologic rates are in the white boxes and are plotted as vectors in black, purple, and blue. Today’s earthquake series happened in the basin where the label “LUCK” is. Note how the GPS site on the northeast side of the basin is moving slightly faster than the GPS site on the western side of the basin. A northwesterly striking right-lateral strike-slip fault could produce this if it ran between these two GPS sites.
Physiographic and fault map of area of interest in northern Walker Lane shows major structural basins (numbered), active basin-bounding faults (thick black lines), and geodetic displacement field (red arrows). Shown in white boxes are geologically determined values of fault-normal extension (black-upper text), geodetic estimates of fault-normal extension (magenta-middle text) and geodetic estimates of fault-parallel strike-slip (blue-lower text) rates along each of the basin bounding faults. Two-headed arrows schematically show ranges of same values and correspond in arrangement and color to the values in boxes. The geologically determined extension rate arrows are placed adjacent to the sites of studies except for Lake Tahoe where the estimate is an average value across several submarine faults. Dotted (yellow) lines define paths AB, CD, and EF.
- This is the tectonic domain figure from Bormann et al. (2016). Some faults have arrows that show their relative sense of motion and blocks have arrows that show their relative sense of rotation. Note the east-west sinistral strike-slip faults that bound the northern and southern boundaries of the blocks in the Mina deflection. Today’s earthquakes happened along the eastern boundary of the Bodie Hills tectonic domain (BH). The BH domain has clockwise rotation like in the Mina deflection. This would place sinistral strain along the southern boundary of the BH domain, creating left-lateral strike-slip faults oriented northeast striking. This is consistent with the sense of motion along the “unnamed faults near Alkali Valley.” If these 2016 earthquakes are associated with these faults, then they are along northeast striking structures and would be left-lateral.
Regional map showing the block model boundaries (yellow lines) in relation to the topography and faults of the Central Walker Lane. The Central Walker Lane (region within the dashed black lines) lies between the northeast striking normal faults of the Basin and Range and the Sierra Nevada microplate. Black lines delin-eate major normal faults of the Central Walker Lane, and red lines mark the location of strike slip faults (arrows indicate slip direction). Paleomagnetic observations in-dicate that crustal blocks in the Carson Domain, Bodie Hills, and Mina Deflection accommodate dextral shear through clockwise vertical axis rotations (Cashman and Fontaine, 2000; Petronis et al., 2009; Rood et al., 2011b; Carlson et al., 2013). Orange lines mark the locations of surface rupture that resulted from historic earthquakes in the Central Nevada Seismic Belt. Faults traces are modified from the USGS Qua-ternary Fault and Fold database (U.S. Geological Survey, California Geological Survey, Nevada Bureau of Mines and Geology, 2006). Inset map shows the location of the study area in relation to other elements of the Pacific/North America Plate boundary zone.
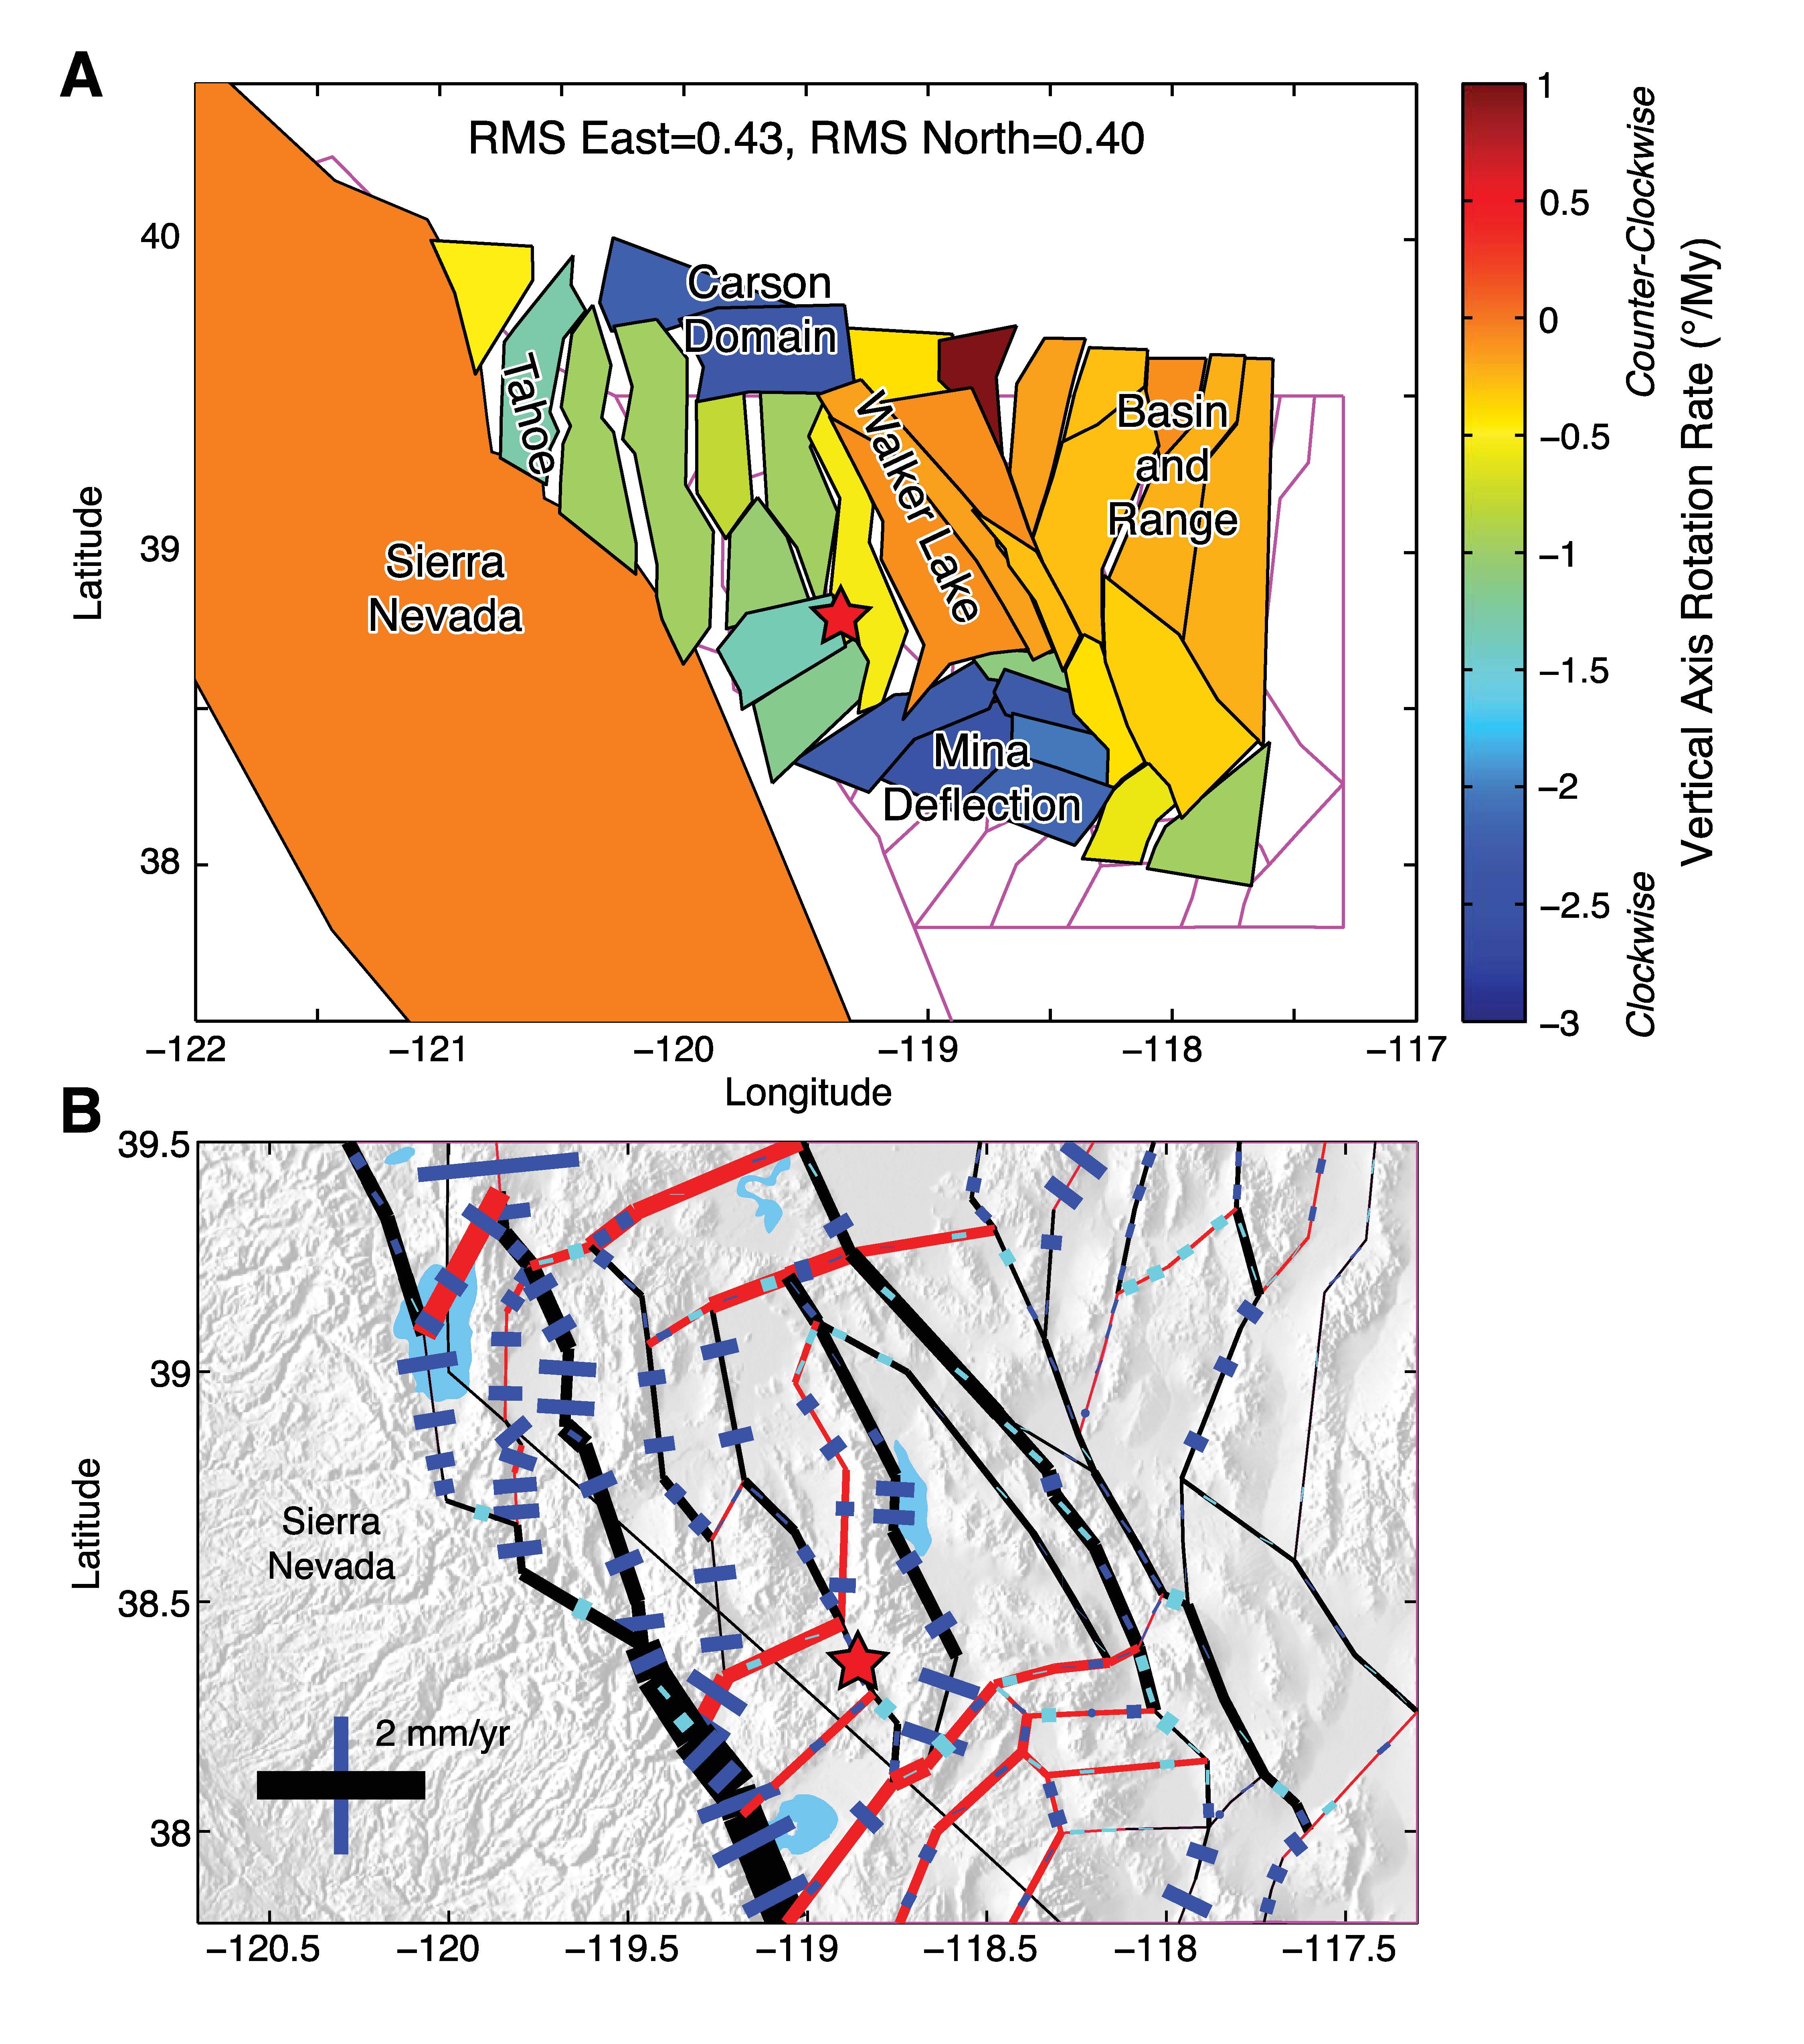
- Here Bormann et al. (2016) present their estimates of rotation and fault slip rates for this region. The caption is below the figure. I place a red star where today’s earthquakes happened. This map helps us visualize an alternate interpretation of these earthquakes. The 2016 swarm is along the eastern boundary of the BH domain, which would suggest a northwest striking dextral (right-lateral) strike slip fault would be involved. Given that the currently mapped faults in this region are northeast striking, I interpret these to be along structures that are also northeast striking. Note how the BH domain is rotating clockwise about 1.75 °/Ma, while the MD is rotating clockwise about 2.75 °/Ma.
Block motions, slip rates, and velocity residuals for the best fitting GPS model. (A) Rigid block rotation and translation exaggerated by a factor of 107(representing 10 million years of deformation). Color of block indicates vertical axis rotation rate. (B) Predicted fault slip rates represented by the thickness of black (red) line for dextral (sinistral) strike-slip motion and the length of blue (cyan) bar for fault normal extension (compression).
- Here is the illustrative model presented by Lee et al. (2009) to explain the faulting in the MD (which may also partially explain the seismicity in this region northeast of the Bodie Hills).
Schematic block diagrams illustrating two fault-slip transfer mechanisms between subparallel strike-slip faults proposed for the eastern California shear zone and Walker Lane belt. (A) Displacement transfer model whereby the magnitude of extension along the connecting normal faults is proportional to the amount of strike-slip motion transferred (modified from Oldow et al., 1994). (B) Block rotation model in which clockwise rotation of blocks, bounded by dextral faults, is accommodated by sinistral faults (model of McKenzie and Jackson, 1983, 1986).
- Here is an updated figure to show how these fault systems may have evolved through time (Nagorsen-Rinke et al., 2012).
Block diagrams illustrating models proposed to explain fault slip transfer across the Mina deflection. (A) Displacement transfer model in which normal slip along connecting faults transfers fault slip (modified from Oldow, 1992; Oldow et al., 1994). (B) Transtensional model showing a combination of sinistral and normal slip along connecting faults. (C) Clockwise block rotation model in which sinistral slip along connecting faults, combined with vertical axis rotation of intervening fault blocks, transfers fault slip (modified from McKenzie and Jackson, 1983, 1986). Single-barbed arrows show dextral fault motion across faults of the Eastern California shear zone (ECSZ) and Walker Lane belt (WLB) and sinistral motion along faults in the Mina deflection; half-circle double-barbed arrows indicate clockwise rotating fault blocks; solid ball is located on the hanging wall of normal slip faults; thin short lines indicate slip direction on fault surfaces.
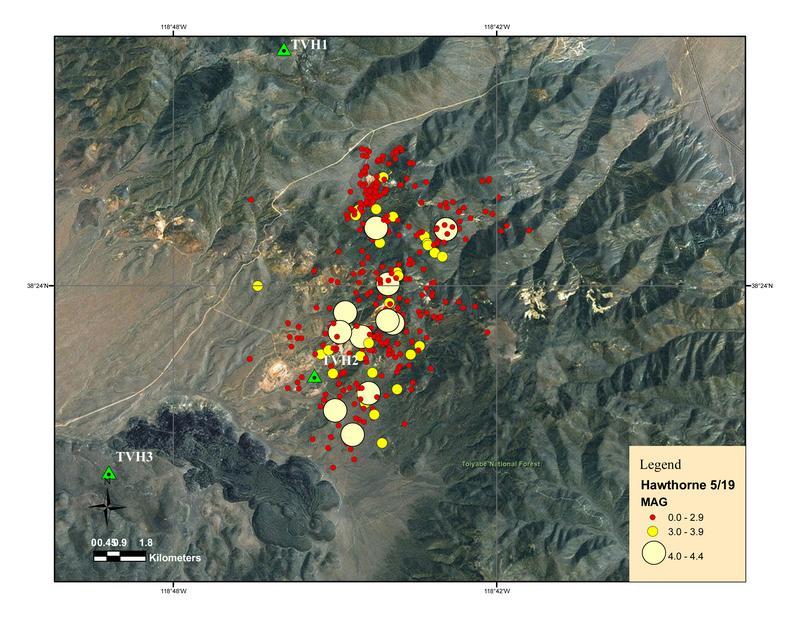
- Here is the map from the UNR Seismological Laboratory website. This shows the earthquakes recorded during the 2011 swarm along the “unnamed faults along Alakali Valley.” Here is the UNRSL website for this earthquake. I include the UNRSL description of the 2011 Hawthorne Sequence below.
- Over the past nine weeks 42 earthquakes of Magnitude 3.0 and larger earthquakes (listed below) have been located in a sequence about 12 miles southwest of Hawthorne, Nevada. The first of these occurred on March 15th at 11:14 AM PDT and the latest at 10:23 AM PDT on May 19th. The preliminary magnitude for the largest event is M 4.6.
- In all, there have been several hundred events of Magnitude 1 and larger; only a small fraction of the entire sequence has been reviewed. There have been 1000’s of smaller magnitude events.
- The Nevada Seismological Laboratory deployed 3 temporary telemetered instruments in the source area on April 17-19 including a NetQuakes instrument at the Court House in Hawthorne. These temporary telemetered instruments deliver real-time data to the data center in Reno and are configured with 3-channel broadband sensors and 3-channel accelerometers.
- Here is a map from Nagorsen-Rinke et al. (2012) with regional faults mapped. Note how the sisnistral faults that bound blocks in the Mina deflection are each slightly more counterclockwise rotated with the fault at the base of the southeastern Excelsior Mountains being the most northerly striking of these faults. If this configuration of faulting were in the basin to the NE of the Bodie Hills, it would explain the northeast striking sinistral interpretation for the 2016 series.
Shaded relief map of the southern part of the Mina deflection and northern part of the eastern California shear zone showing the major Quaternary faults. Solid black ball is located on the hanging wall of normal faults; arrow pairs indicate relative motion across strike-slip faults. Heavy arrow in northwest corner of map shows the present-day motion of the Sierra Nevada (SN) with respect to North America (NA) (Dixon et al., 2000). Location of the Adobe Hills geologic map shown in Figure 4A is outlined with a dashed line and location of this map is shown in Figure 1. PS—Pizona Springs; CF—Coaldale fault; CSF— Coyote Springs fault; DSF—Deep Springs fault; FLVFZ—Fish Lake Valley fault zone; HCF—Hilton Creek fault; OVF—Owens Valley fault; QVF—Queen Valley fault; RVF— Round Valley fault; WMFZ—White Mountains fault zone.
- Here is the comparison map for the 2011 and 2016 earthquakes. This is the same data set as presented in the poster above, but I include the 2016 moment tensors here. If the two M 5.7 and one M 5.5 earthquakes are along a NW striking fault, it would be dipping at ~42° and daylight ~4km to the southwest. There is an east-west striking fault mapped at this distance and with this strike immediately to the east of the M 5.7 (2) moment tensor. The strike of this mapped fault is actually more aligned with the moment tensors than the other north striking Aurora Crater faults. What do you think?
References:
- Adams, K., and Sawyer, T.L., compilers, 1998 (A), Fault number 1299, Unnamed faults near Alkali Valley, in Quaternary fault and fold database of the United States: U.S. Geological Survey website, https://earthquakes.usgs.gov/hazards/qfaults, accessed 12/28/2016 11:51 AM.
- Adams, K., and Sawyer, T.L., compilers, 1998 (B), Fault number 1298, Unnamed faults west of Aurora Crater, in Quaternary fault and fold database of the United States: U.S. Geological Survey website, https://earthquakes.usgs.gov/hazards/qfaults, accessed 12/28/2016 10:11 AM.
- Adams, K., and Sawyer, T.L., compilers, 1999, Fault number 1300, Wassuk Range fault zone, in Quaternary fault and fold database of the United States: U.S. Geological Survey website, https://earthquakes.usgs.gov/hazards/qfaults, accessed 12/28/2016 11:52 AM.
- Bormann, J.M., Hammond, W.C., Kreemer, C., and Blewitt, G., 2016. Accommodation of missing shear strain in the Central Walker Lane, western North America: Constraints from dense GPS measurements in EPSL, v. 440, p. 169-177.
- Lee, J., Garwood, J., Stockli, D.F., and Gosse, J., 2009. Quaternary faulting in Queen Valley, California-Nevada: Implications for kinematics of fault-slip transfer in the eastern California shear zone Walker Lane belt in GSA Bulletin, v. 121, no. 3/4, p. 599-614.
- Nagorsen-Rinke, S., Lee, J., and Clavert, A., 2012. Pliocene sinistral slip across the Adobe Hills, eastern California–western Nevada: Kinematics of fault slip transfer across the Mina deflection in Geosphere, v. 9, no. 1, p. 37-53.
- Stockli, D.F., Dumitru, T.A., McWilliams, M.O., and Farley, K.A., 2003. Cenozoic tectonic evolution of the White Mountains,California and Nevada in GSA Bulletin, v. 115, no. 7, p/ 788-816.
- Wesnouskky, S.G., Bormann, J.M., Kreemer, C., Hammond, W.C., and Brune, J.N., 2012. Neotectonics, geodesy, and seismic hazard in the Northern Walker Lane of Western North America: Thirty kilometers of crustal shear and no strike-slip? in EPSL, v. 329-330, p. 133-140.
Nice job! I’m going to share this on the labs Facebook page.
Nice article, simple to understood, thanks Jay