This page presents a tutorial on how to interpret the USGS onePAGER Alerts.
PAGER provides shaking and loss estimates following significant earthquakes anywhere in the world. These estimates are generally available within 30 minutes and are updated as more information becomes available. Rapid estimates include the number of people and names of cities exposed to each shaking intensity level as well as the likely ranges of fatalities and economic losses. PAGER does not consider secondary effects such as landslides, liquefaction, and tsunami in loss estimates at this time. For tsunami warnings see http://tsunami.noaa.gov/
Information on the extent of shaking will be uncertain in the minutes and hours following an earthquake and typically improves as additional sensor data and reported intensities are acquired and incorporated into models of the earthquake’s source. Users of PAGER need to account for uncertainty and always seek the most current PAGER release for any earthquake.
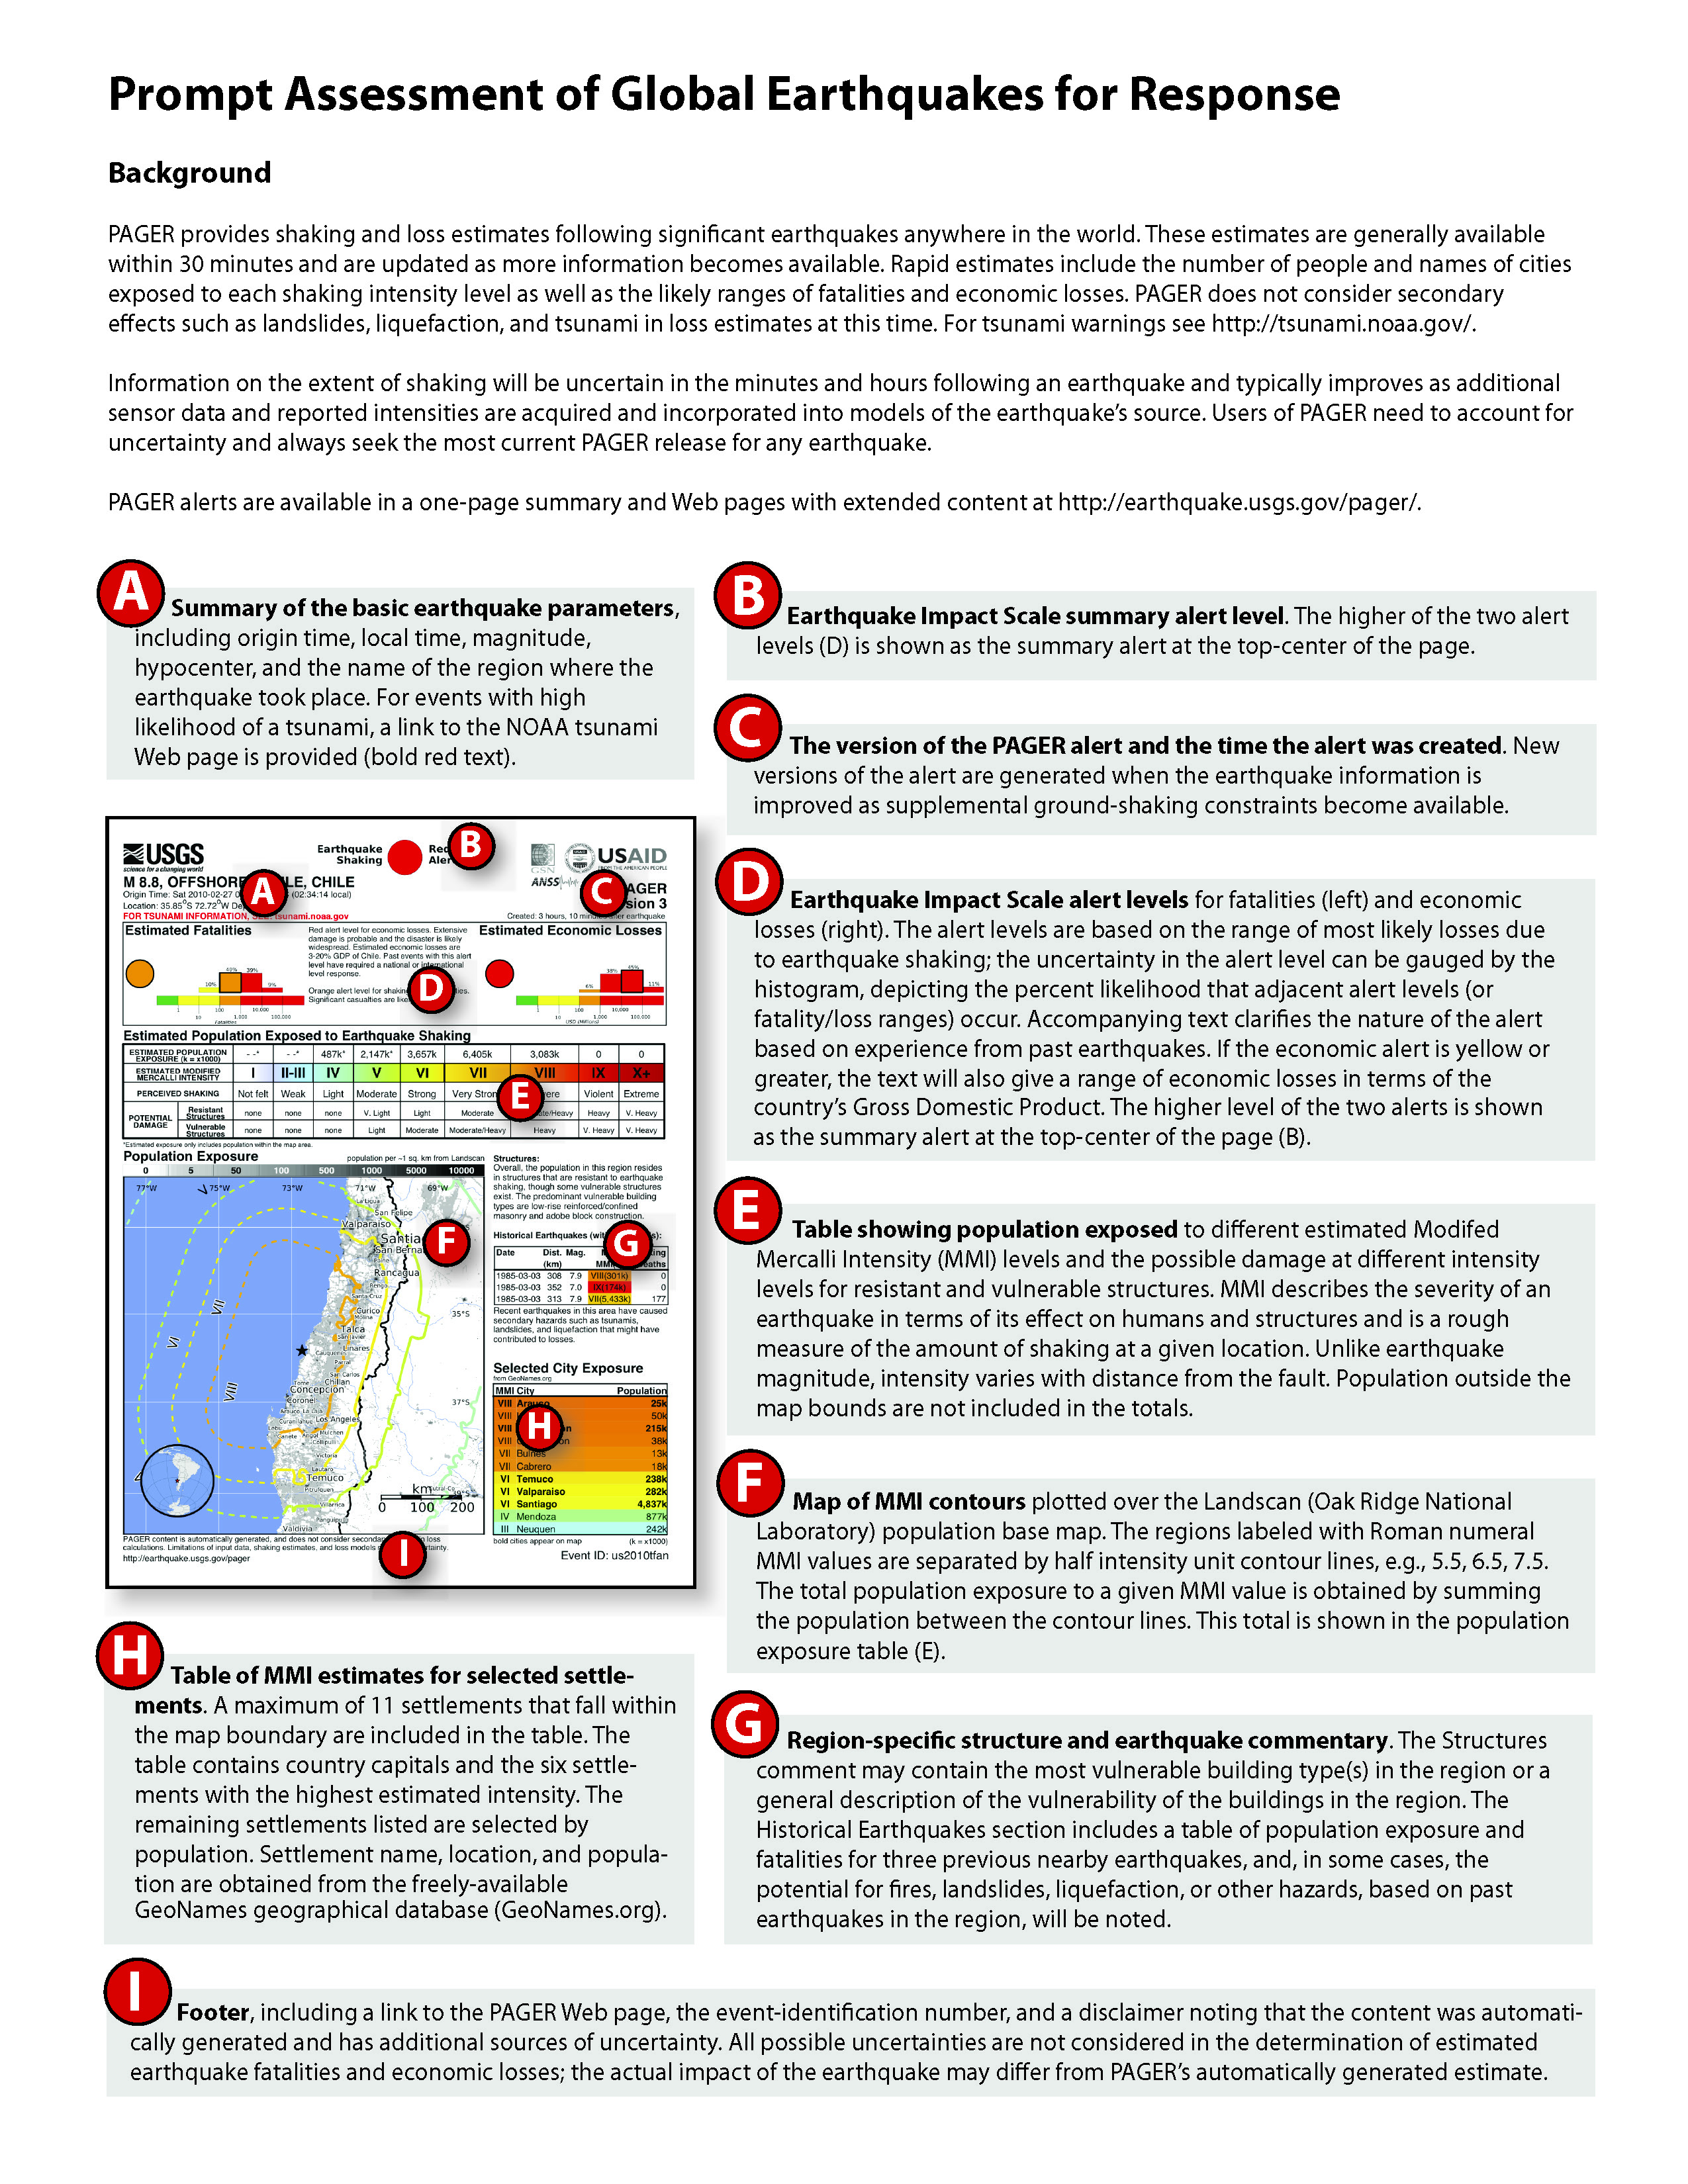
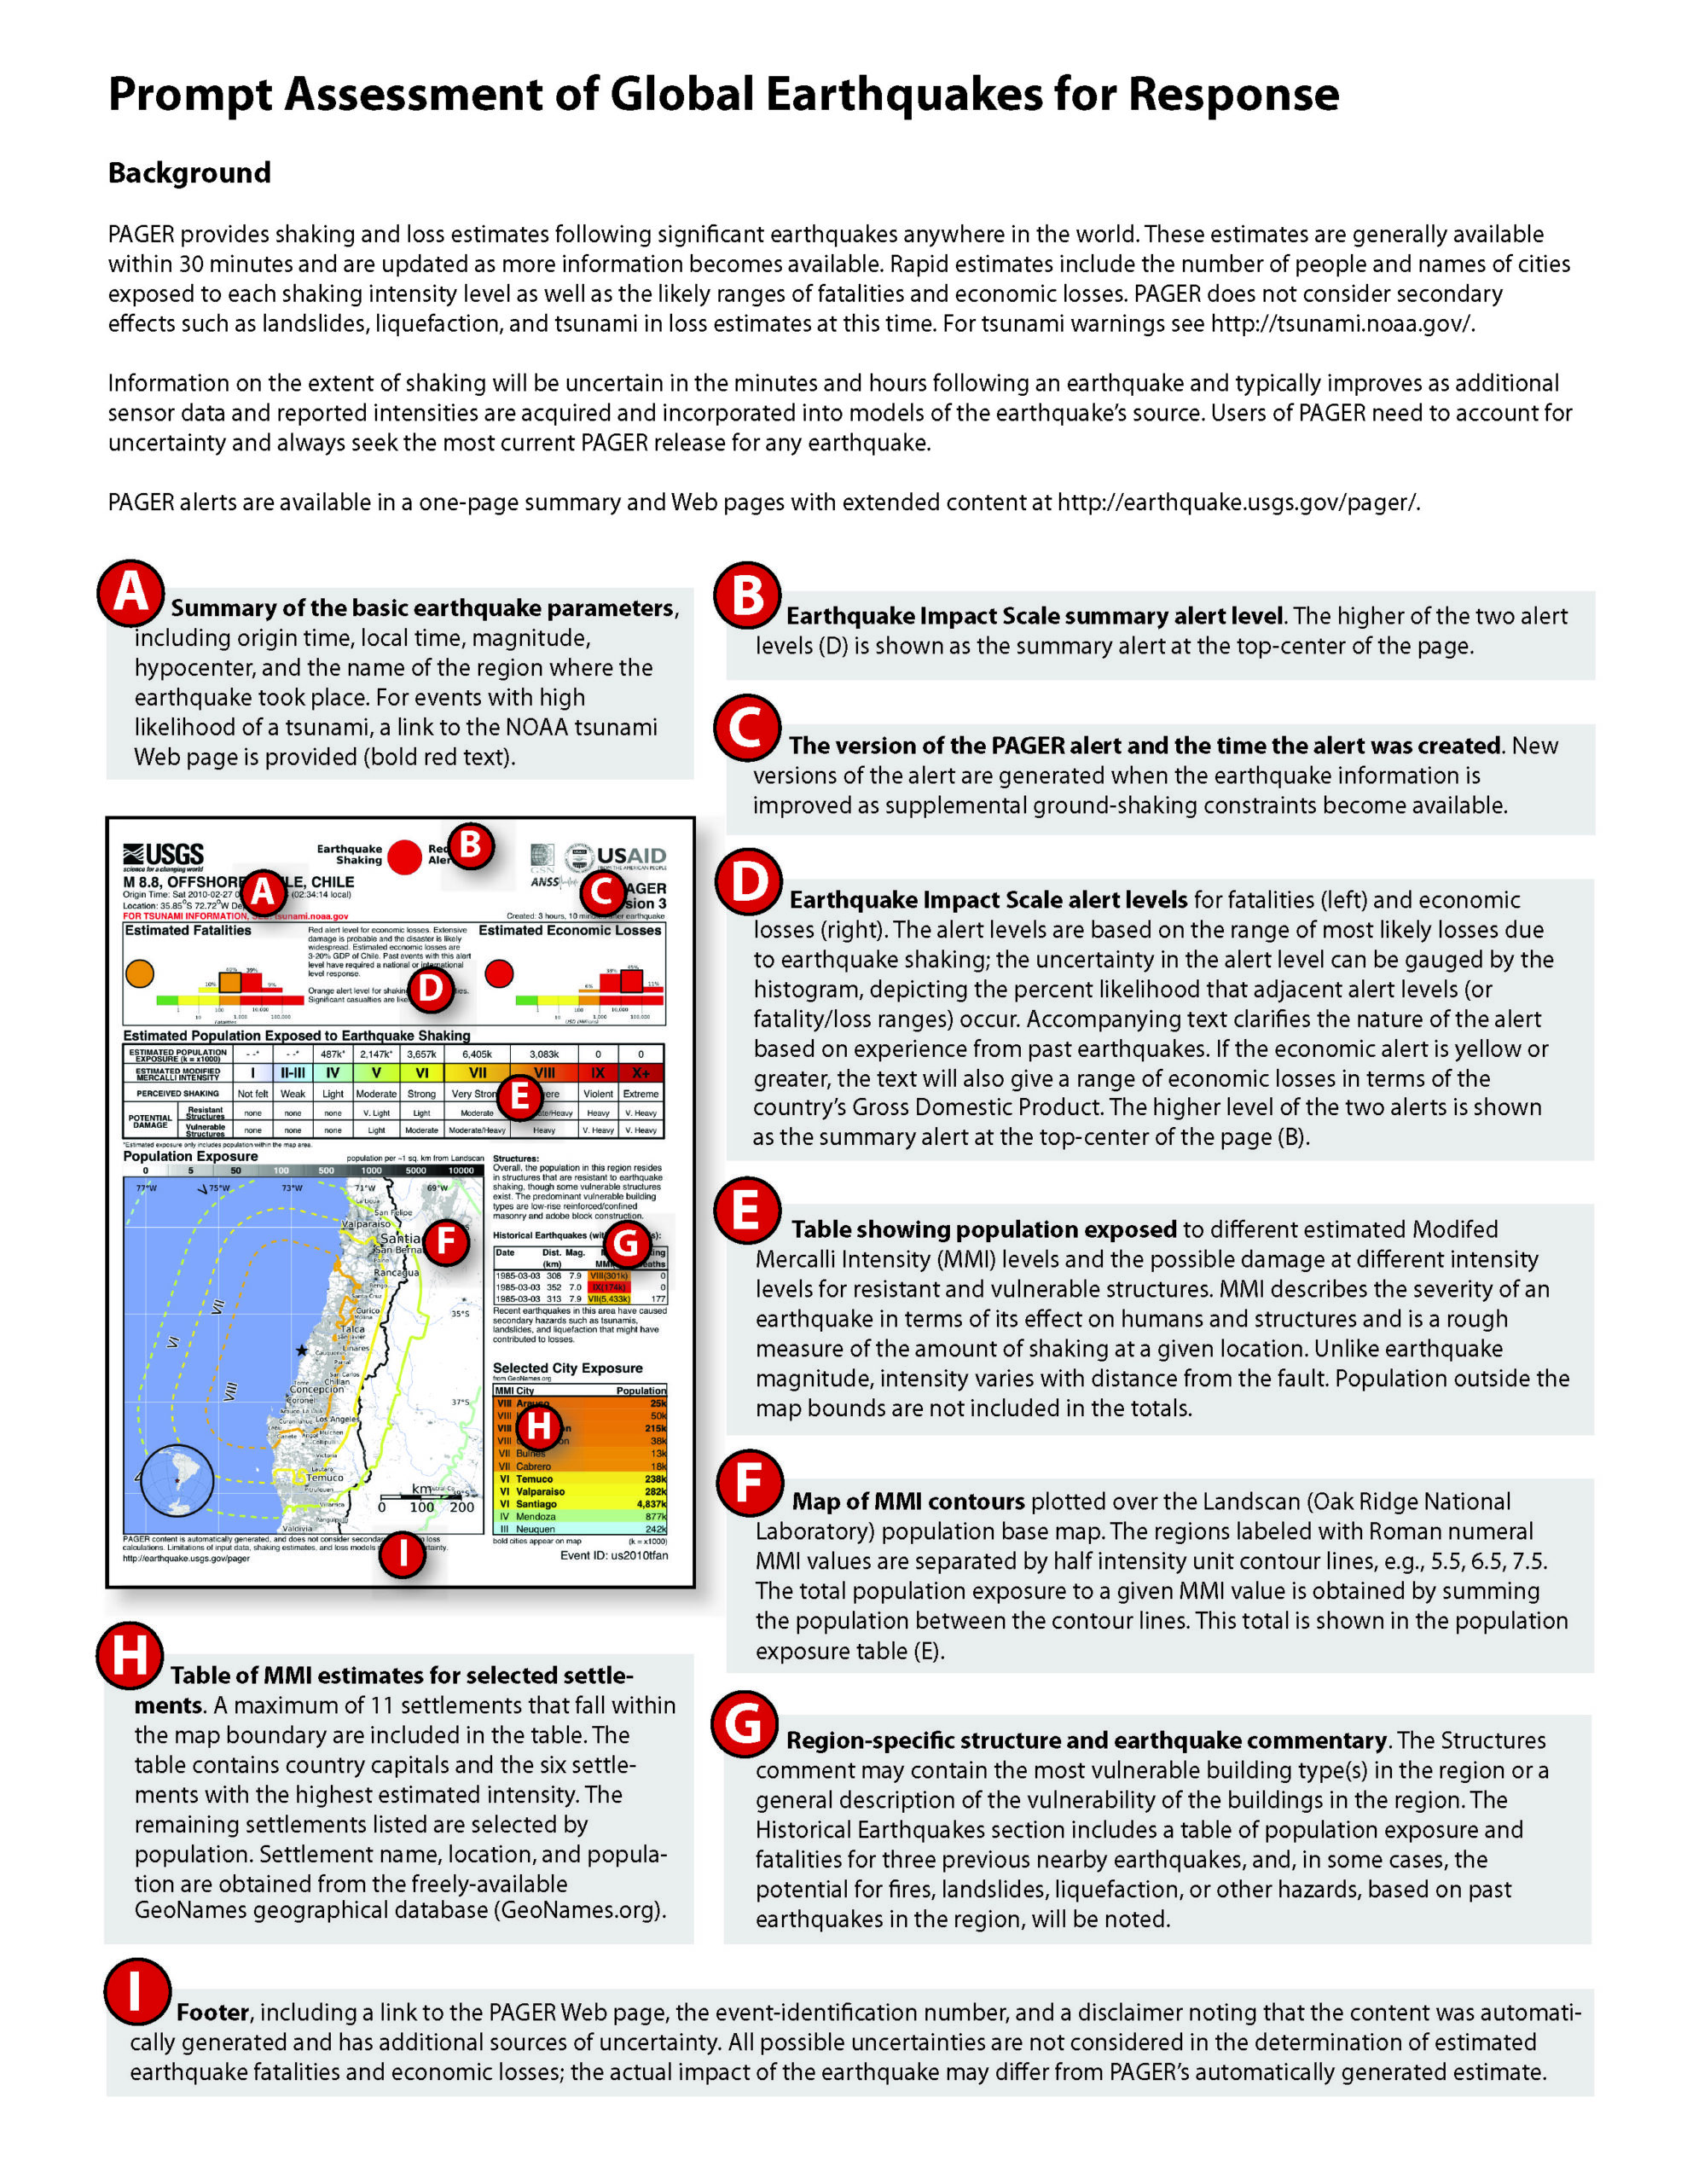
- Summary of the basic earthquake parameters, including origin time, local time, magnitude, hypocenter, and the name of the region where the earthquake took place. For events with high likelihood of a tsunami, a link to the NOAA tsunami Web page is provided (bold red text).
- Earthquake Impact Scale summary alert level . The higher of the two alert levels (D) is shown as the summary alert at the top-center of the page.
- The version of the PAGER alert and the time the alert was created. New versions of the alert are generated when the earthquake information is improved as supplemental ground-shaking constraints become available.
- Earthquake Impact Scale alert levels for fatalities (left) and economic losses (right). The alert levels are based on the range of most likely losses; the uncertainty in the alert level can be gauged by the histogram, depicting the percent likelihood that adjacent alert levels (or fatality/loss ranges) occur. Accompanying text clarifies the nature of the alert based on experience from past earthquakes. If the economic alert is yellow or greater, the text will also give a range of economic losses in terms of the country’s Gross Domestic Product. The higher level of the two alerts is shown as the summary alert at the top-center of the page (B).
- Table showing population exposed to different Modified Mercalli Intensity (MMI) levels and the possible damage at different intensity levels for resistant and vulnerable structures. MMI describes the severity of an earthquake in terms of its effect on humans and structures and is a rough measure of the amount of shaking at a given location. Unlike earthquake magnitude, intensity varies with distance from the fault. Population outside the map bounds are not included in the totals.
- Map of MMI contours plotted over the Landscan (Oak Ridge National Laboratory) population base map. The regions labeled with Roman numeral MMI values are separated by half intensity unit contour lines, e.g., 5.5, 6.5, 7.5. The total population exposure to a given MMI value is obtained by summing the population between the thick contour lines. This total is shown in the population exposure table (E).
- Region-specific structure and earthquake commentary. The Structures comment may contain the most vulnerable building type(s) in the region or a general description of the vulnerability of the buildings in the region. The Historical Earthquakes section includes a table of population exposure and fatalities for three previous nearby earthquakes and, in some cases, the potential for fires, landslides, liquefaction, or other hazards, based on past earthquakes in the region, will be noted.
- Table of MMI estimates for selected settlements. A maximum of 11 settlements that fall within the map boundary are included in the table. The table contains country capitals and the six settlements with the highest estimated intensity. The remaining settlements listed are selected by population. Settlement name, location and population are obtained from the freely-available GeoNames geographical database.
- Footer, including a link to the PAGER web page, event identification information, and a disclaimer noting that the content was automatically generated, and has additional sources of uncertainty. All possible uncertainties are not considered in the determination of estimated earthquake fatalities and economic losses; the actual impact of the earthquake may differ from PAGER’s automatically generated estimate.