I don’t always have the time to write a proper Earthquake Report. However, I prepare interpretive posters for these events.
Because of this, I present Earthquake Report Lite. (but it is more than just water, like the adult beverage that claims otherwise). I will try to describe the figures included in the poster, but sometimes I will simply post the poster here.
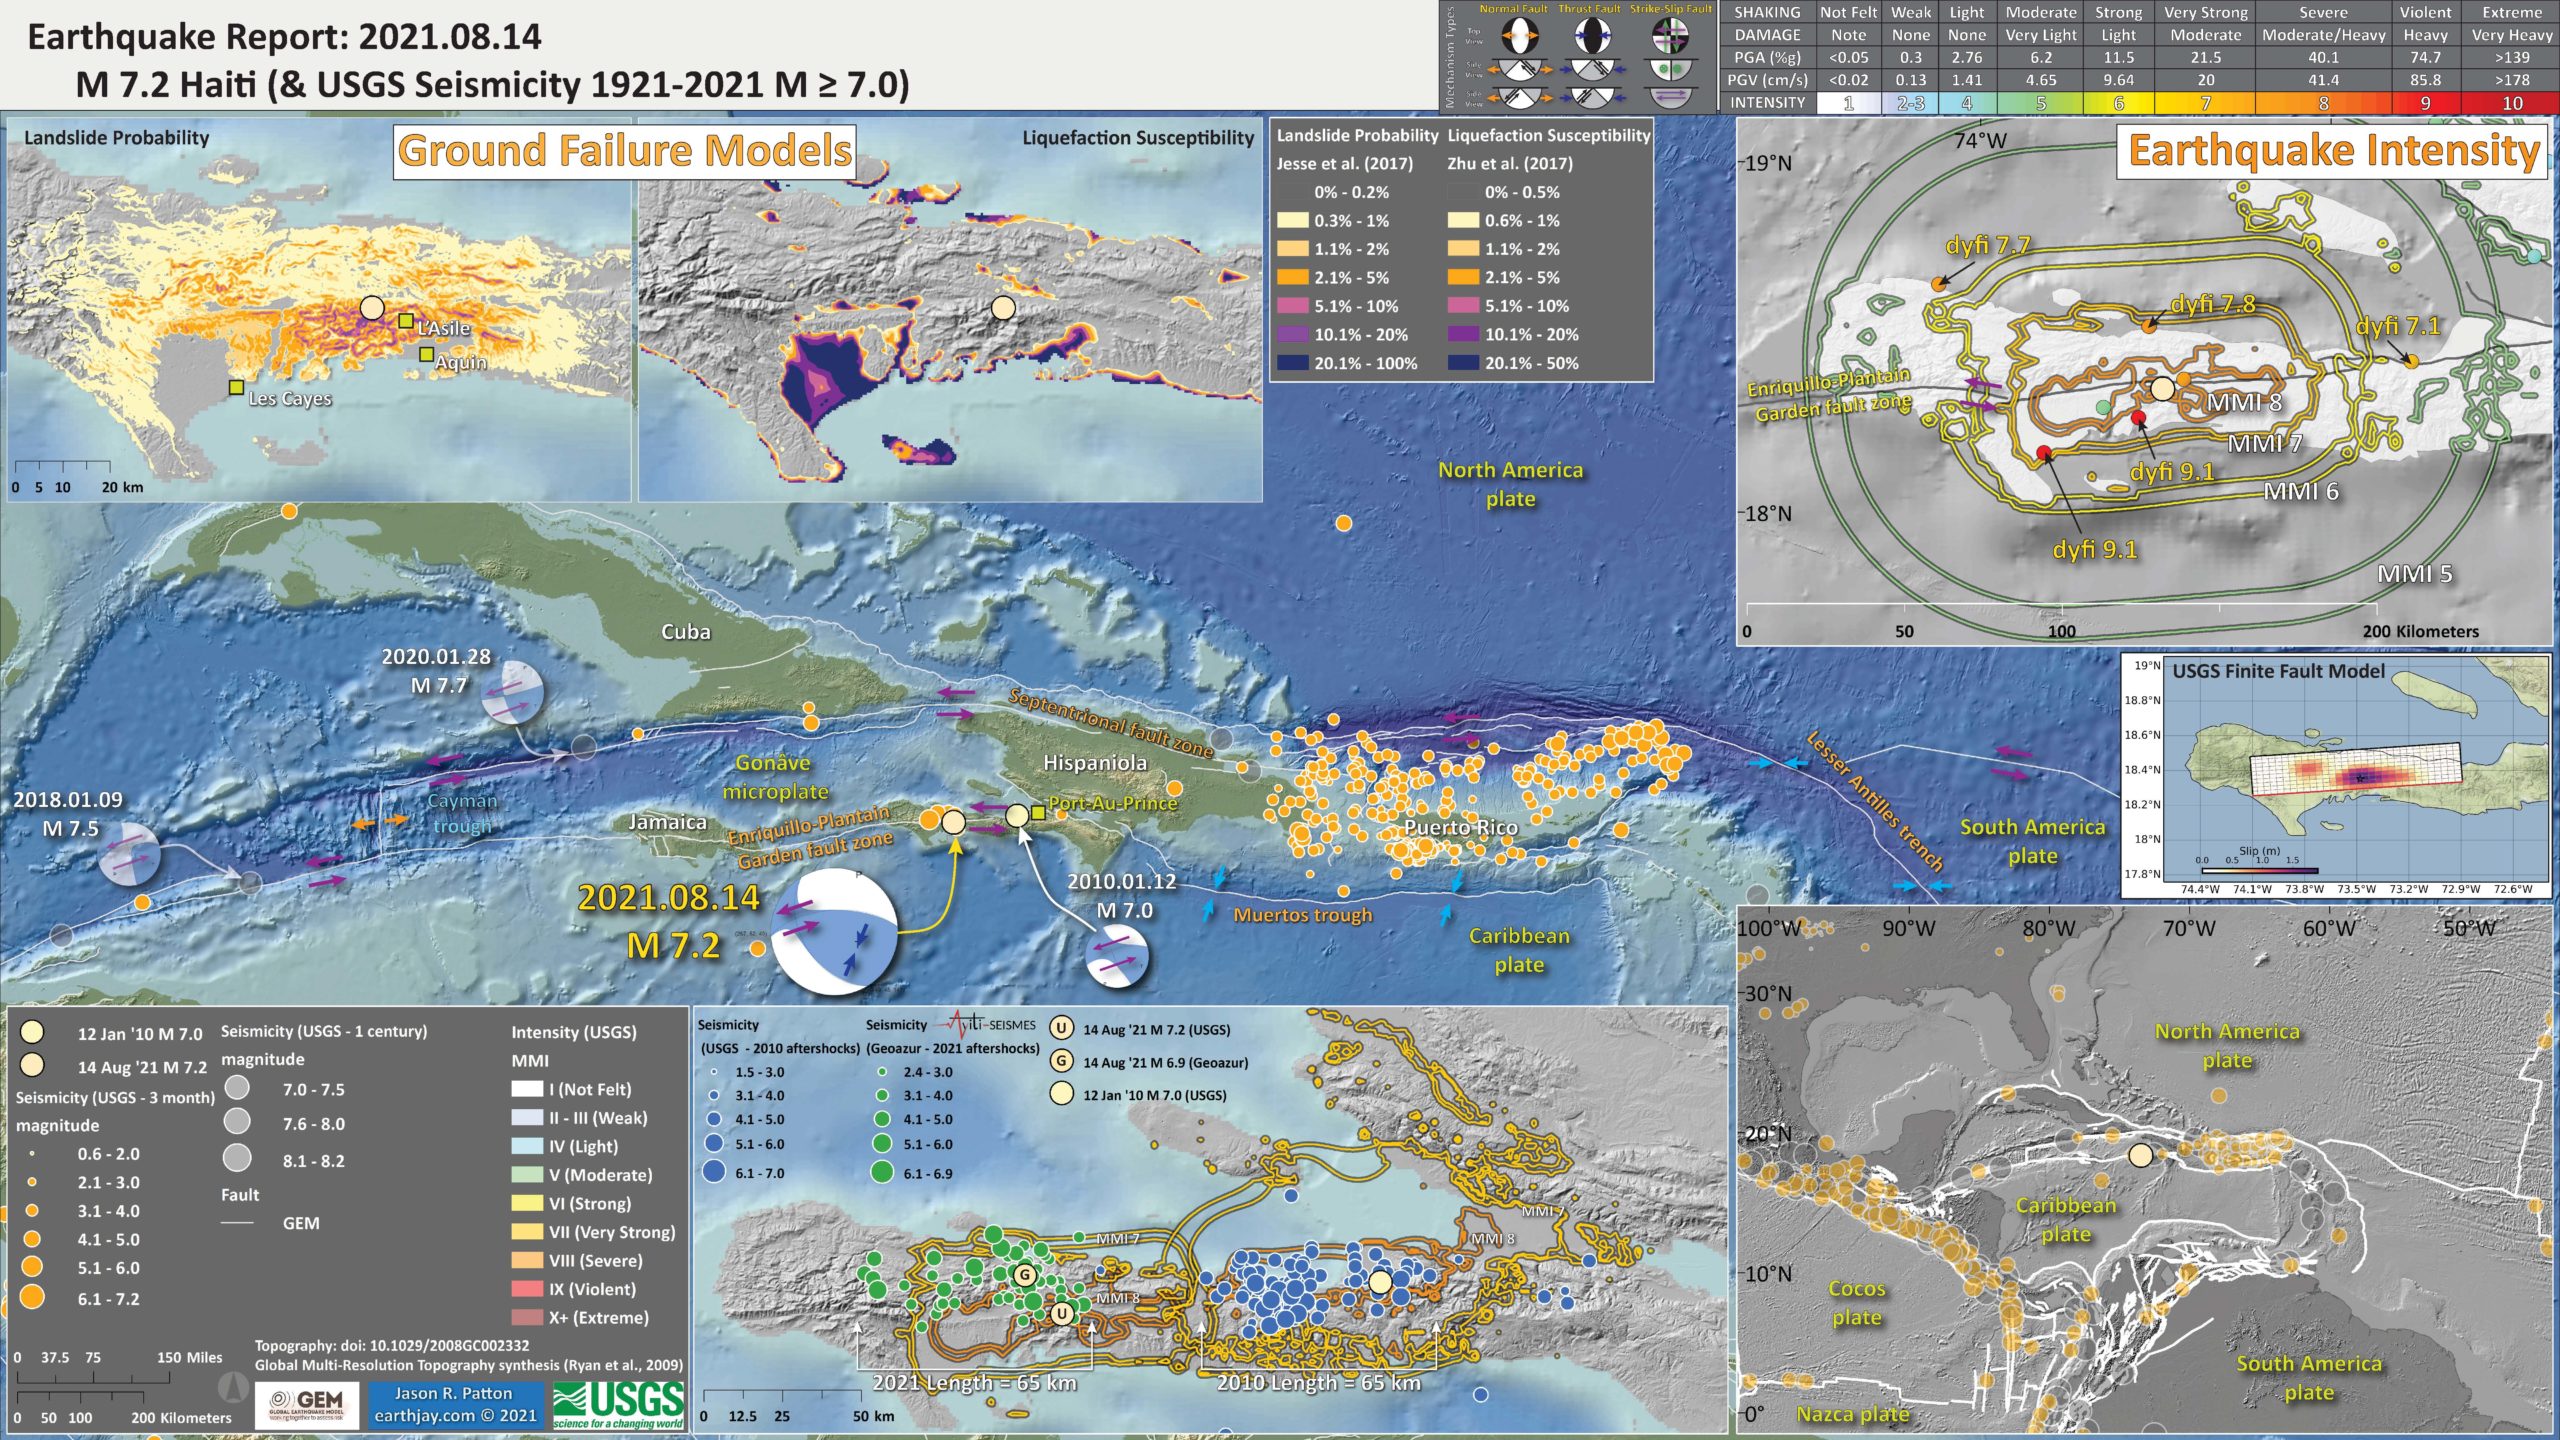
On 14 August ’21 there was a magnitude M 7.2 oblique strike-slip earthquake in Haiti. This earthquake was along the Enriquillo-Plantain Garden fault zone, which also ruptured in 2010. Here is my report for the 2010 Haiti earthquake (see more about the tectonics of this region of the world).
https://earthquake.usgs.gov/earthquakes/eventpage/us6000f65h/executive
Below is my interpretive poster for this earthquake
- I plot the seismicity from the past month, with diameter representing magnitude (see legend). I include earthquake epicenters from 1921-2021 with magnitudes M ≥ 7.0 in one version.
- I plot the USGS fault plane solutions (moment tensors in blue and focal mechanisms in orange), possibly in addition to some relevant historic earthquakes.
- A review of the basic base map variations and data that I use for the interpretive posters can be found on the Earthquake Reports page. I have improved these posters over time and some of this background information applies to the older posters.
- Some basic fundamentals of earthquake geology and plate tectonics can be found on the Earthquake Plate Tectonic Fundamentals page.
- in the lower right corner is a small scale plate tectonic map.
- Above that map is a plot showing the USGS finite fault slip model. This shows the location of the fault and color represents how much the fault slipped during the earthquake.
- In the upper right corner is a map that compares the USGS earthquake intensity models (the contoured lines) with the USGS Did You Feel It? observations from real people.
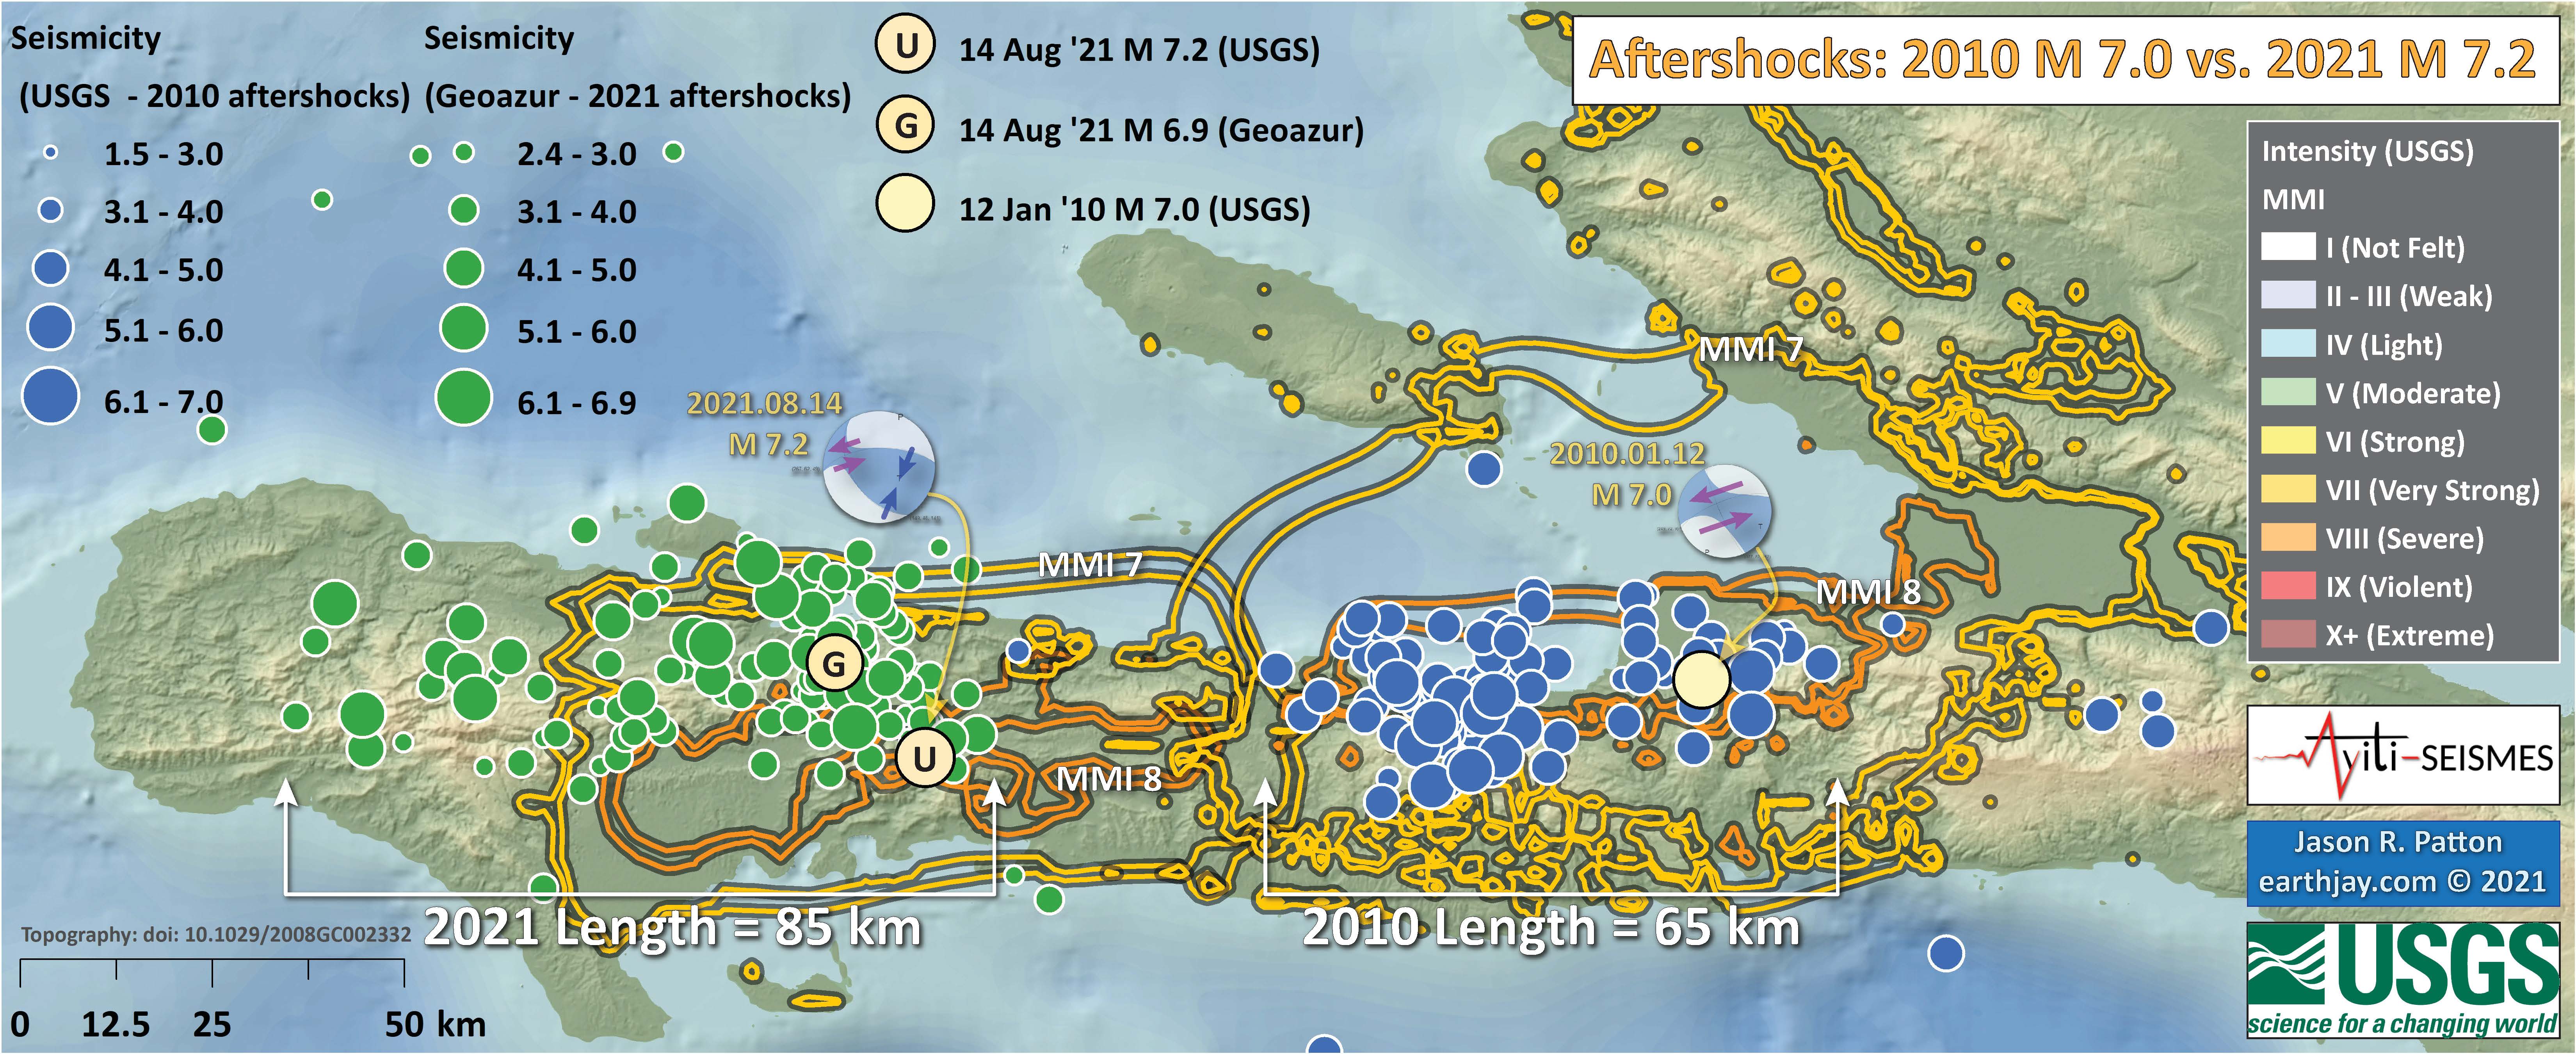
- In the lower center is a map that shows the aftershocks from the M 7.2 earthquake and from the 2010 M 7.0 earthquake.
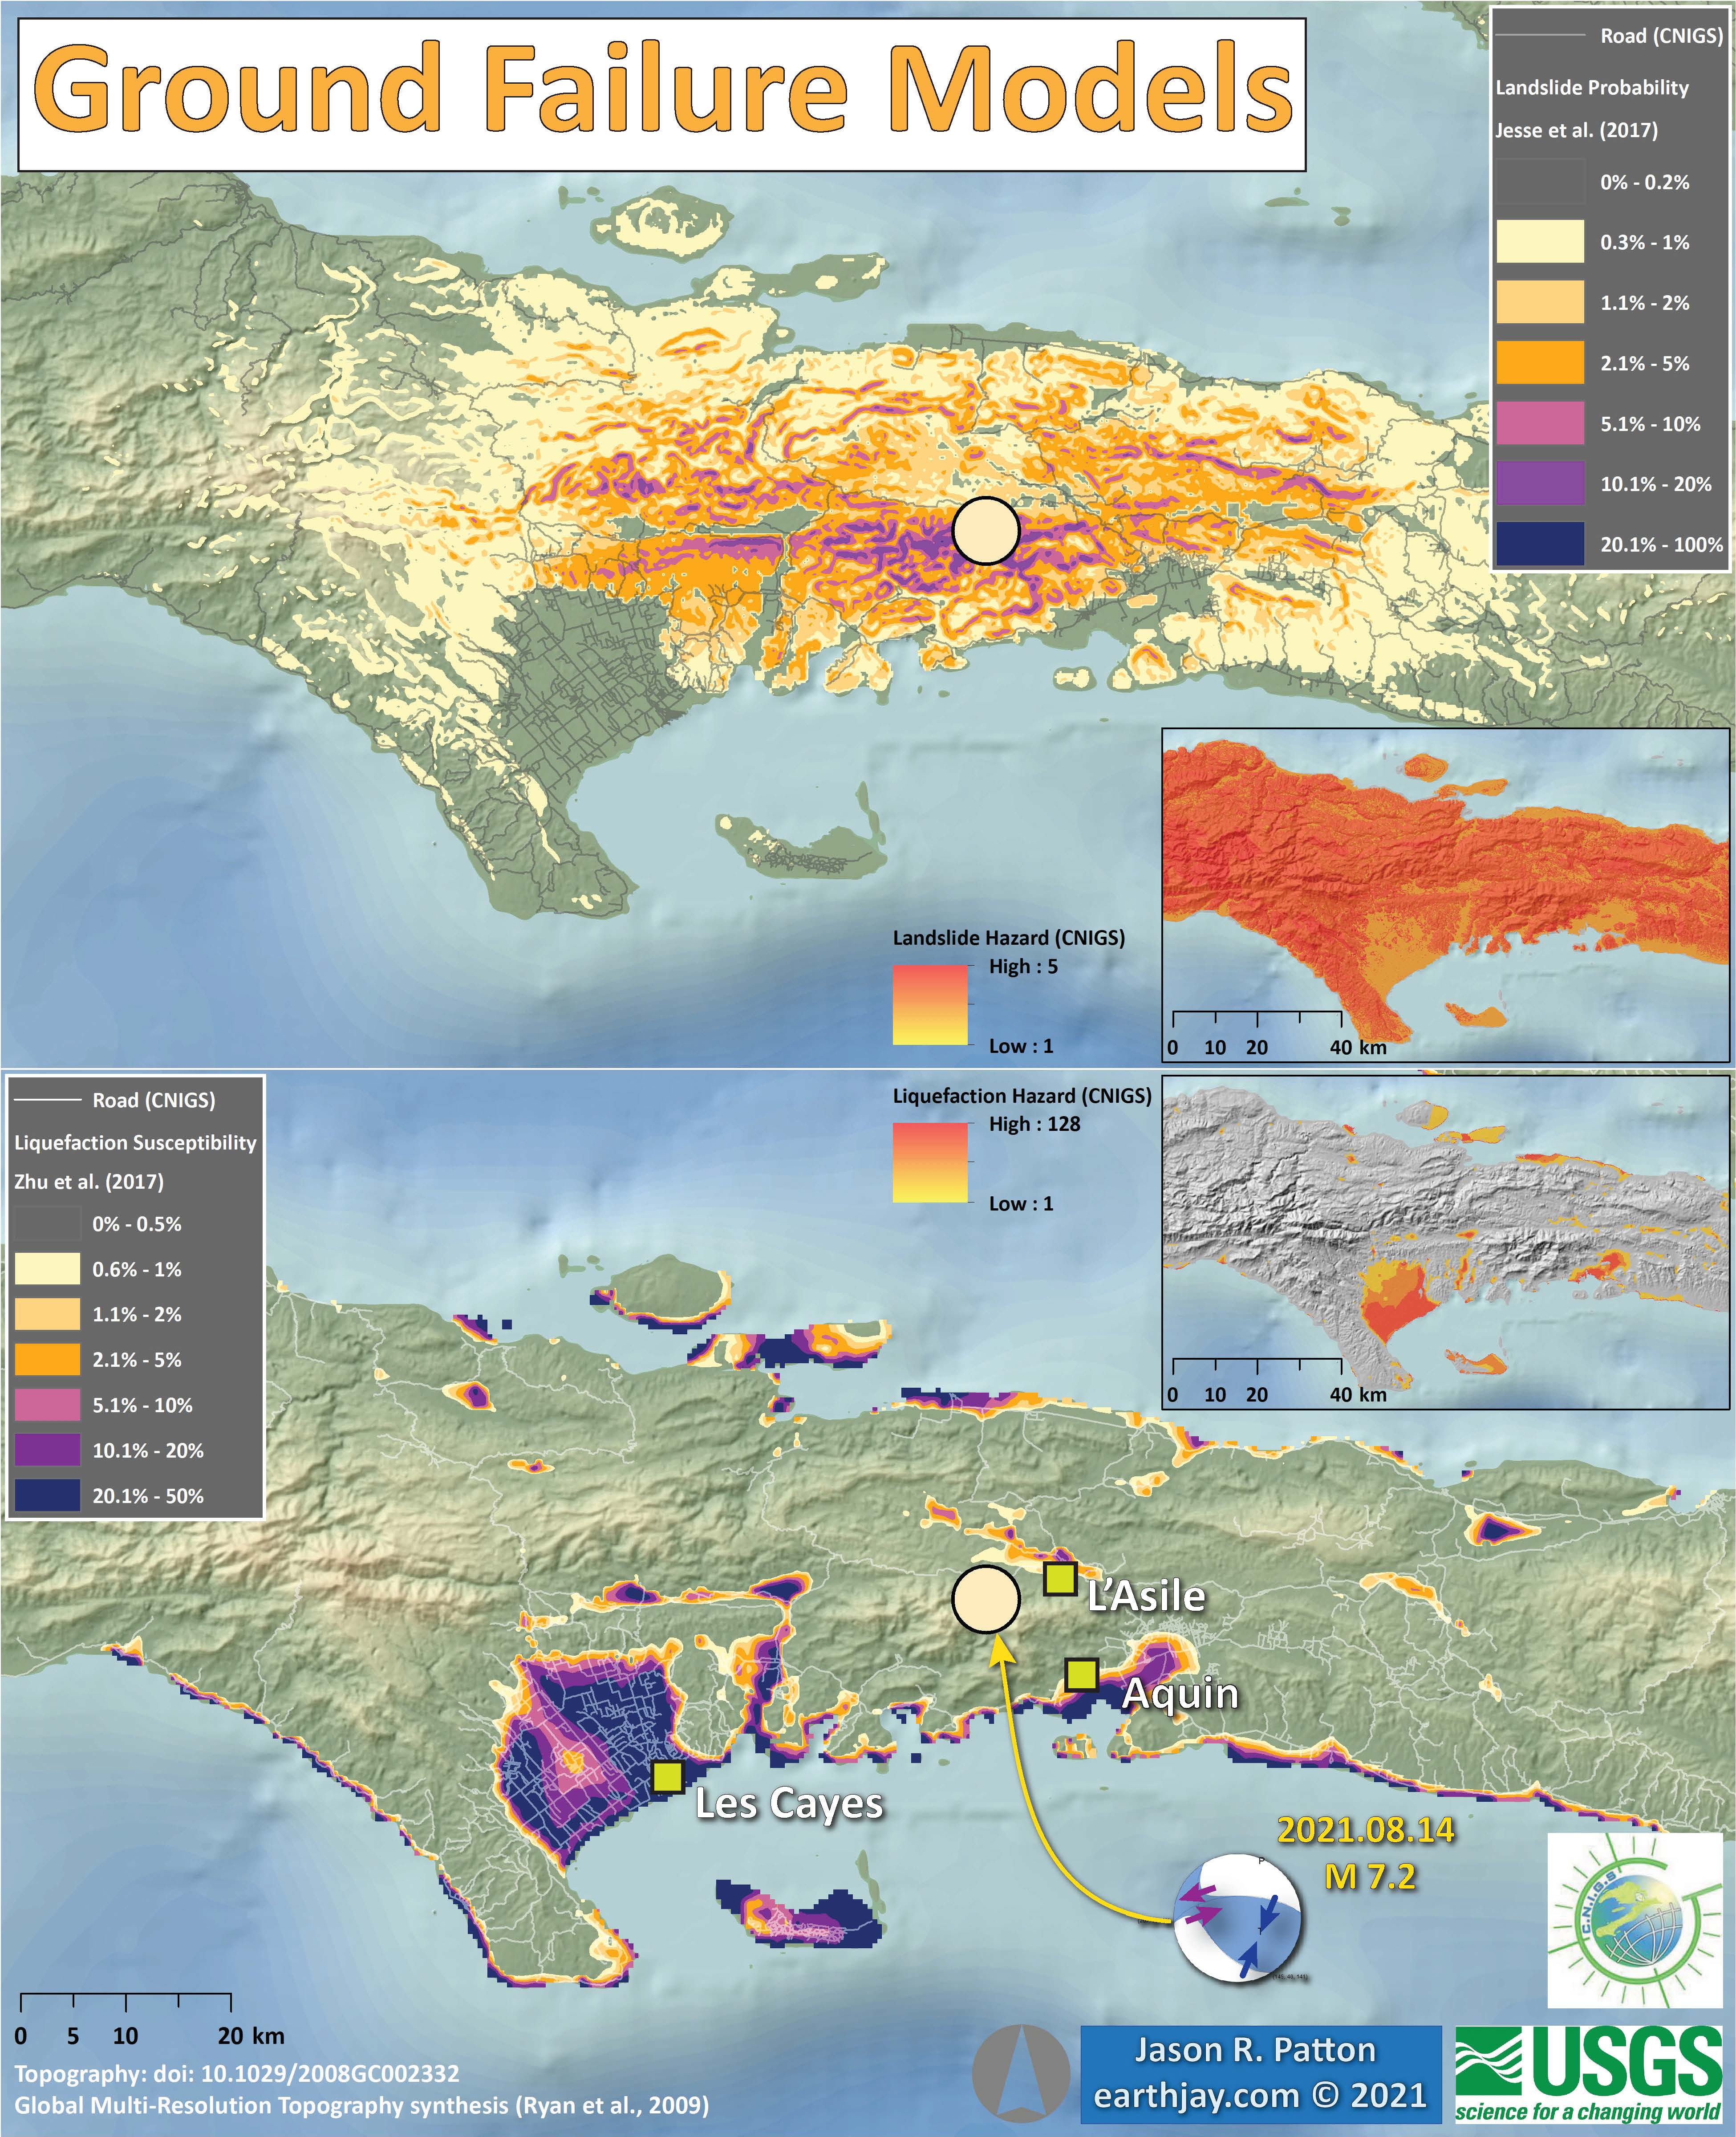
- In the upper left are two maps that show models of earthquake triggered landslides and earthquake induced liquefaction for this M 7.2 event. Read more about these models here.
I include some inset figures.
- Here is the map with 3 month’s seismicity plotted.

Earthquake Aftershocks
- Below a map showing the aftershocks from the 2021 M 7.2 and 2010 M 7.0 Haiti earthquakes.
Potential for Ground Failure
- Below are a series of maps that show the potential for landslides and liquefaction. These are all USGS data products.
- There are many different ways in which a landslide can be triggered. The first order relations behind slope failure (landslides) is that the “resisting” forces that are preventing slope failure (e.g. the strength of the bedrock or soil) are overcome by the “driving” forces that are pushing this land downwards (e.g. gravity). The ratio of resisting forces to driving forces is called the Factor of Safety (FOS).
- Below is the liquefaction susceptibility and landslide probability map (Jessee et al., 2017; Zhu et al., 2017). Please head over to that report for more information about the USGS Ground Failure products (landslides and liquefaction). Basically, earthquakes shake the ground and this ground shaking can cause landslides.
- I use the same color scheme that the USGS uses on their website. Note how the areas that are more likely to have experienced earthquake induced liquefaction are in the valleys. Learn more about how the USGS prepares these model results here.
- Below are maps showing a comparison between the USGS modeled earthquake triggered landslides and liquefaction potential with the Centre Nationale De Information Géospatiale (CNIGS) probabilistic models of ground failure.
We can write this ratio like this:
FOS = Resisting Force / Driving Force
When FOS > 1, the slope is stable and when FOS < 1, the slope fails and we get a landslide. The illustration below shows these relations. Note how the slope angle α can take part in this ratio (the steeper the slope, the greater impact of the mass of the slope can contribute to driving forces). The real world is more complicated than the simplified illustration below.

Landslide ground shaking can change the Factor of Safety in several ways that might increase the driving force or decrease the resisting force. Keefer (1984) studied a global data set of earthquake triggered landslides and found that larger earthquakes trigger larger and more numerous landslides across a larger area than do smaller earthquakes. Earthquakes can cause landslides because the seismic waves can cause the driving force to increase (the earthquake motions can “push” the land downwards), leading to a landslide. In addition, ground shaking can change the strength of these earth materials (a form of resisting force) with a process called liquefaction.
Sediment or soil strength is based upon the ability for sediment particles to push against each other without moving. This is a combination of friction and the forces exerted between these particles. This is loosely what we call the “angle of internal friction.” Liquefaction is a process by which pore pressure increases cause water to push out against the sediment particles so that they are no longer touching.
An analogy that some may be familiar with relates to a visit to the beach. When one is walking on the wet sand near the shoreline, the sand may hold the weight of our body generally pretty well. However, if we stop and vibrate our feet back and forth, this causes pore pressure to increase and we sink into the sand as the sand liquefies. Or, at least our feet sink into the sand.
Below is a diagram showing how an increase in pore pressure can push against the sediment particles so that they are not touching any more. This allows the particles to move around and this is why our feet sink in the sand in the analogy above. This is also what changes the strength of earth materials such that a landslide can be triggered.

Below is a diagram based upon a publication designed to educate the public about landslides and the processes that trigger them (USGS, 2004). Additional background information about landslide types can be found in Highland et al. (2008). There was a variety of landslide types that can be observed surrounding the earthquake region. So, this illustration can help people when they observing the landscape response to the earthquake whether they are using aerial imagery, photos in newspaper or website articles, or videos on social media. Will you be able to locate a landslide scarp or the toe of a landslide? This figure shows a rotational landslide, one where the land rotates along a curvilinear failure surface.

- 2016.01.17 1900-2016 Summary northern Caribbean
- 2021.08.14 M 7.2 Haiti
- 2020.01.28 M 7.7 Cayman Islands
- 2020.01.07 M 6.4 Puerto Rico
- 2019.09.24 M 6.0 Puerto Rico (Mona Passage) Poster
- 2018.08.21 M 7.3 Venezuela
- 2018.01.10 M 7.6 Cayman Trough
- 2016.01.17 M 5.1 pair Cuba
- 2010.01.12 M 7.0 Haiti
Caribbean
General Overview
Earthquake Reports
Social Media
My original Tweet:
#EarthquakeReport for M7.2 #TremblementDeTerre #Terrremoto #Earthquake in #Haiti #HaitiEarthquake #HaitiEarthquake2021
updated poster: compare shaking intensity MMI and aftershock regions between 2010 M 7.0 & 2021 M 7.2
read more about 2010 M 7 Event https://t.co/KDzf1PtjyE pic.twitter.com/wIURgKsbOa
— Jason "Jay" R. Patton (@patton_cascadia) August 15, 2021
Haiti's 1860 Jour de Pâques earthquakes may have released strain in key fault zone https://t.co/JKBJiHZ5jo #RSESpapers Stacey Martin & Susan Hough https://t.co/hz1uosClX3 pic.twitter.com/n2N6nblQui
— ANU Earth Sciences 🌏 (@anuearthscience) July 14, 2022
Given the larger magnitude and farther west location of this 2021 Haiti quake relative to the 2010 earthquake, it is also worth noting the short time elapsed between the last historical sequence of large quakes on this fault. Fig from our 2012 paperhttps://t.co/zLQ8wSbtWr pic.twitter.com/ux17G6bz2F
— Austin Elliott (@TTremblingEarth) August 14, 2021
Why was there a gap between the 2010 and 2021 Haiti earthquakes? Because a sequence of moderate quakes in 1860 released strain in the gap! https://t.co/rpuXfEw78G
— Dr. Susan Hough 🦖 (@SeismoSue) July 15, 2022
I was excited to see & have a chance to comment on a study published in Science yesterday, discussed here. The response to the 2021 Nippes, Haiti, earthquake was very different from the response in 2010, 1/https://t.co/y6l3jjsAYQ
— Dr. Susan Hough 🦖 (@SeismoSue) March 11, 2022
Saturday's M7.2 earthquake in Haiti was close to the 2010 M7.0 earthquake. Both events are devastating on their own but compounded by ongoing problems the region faces. Compare @IRIS_EPO's Teachable Moments:
2010 M7.0: https://t.co/FgYVeGH6Zy
2021 M7.2: https://t.co/z007x1QxC4 pic.twitter.com/VpkCSo90G2
— Southern California Earthquake Center (@SCEC) August 16, 2021
Here is a comparison of Peak Ground Acceleration (perceived shaking) for the January 2010 M7.0 and August 2021 M7.2* events. Note the notable difference at Port-au-Prince. #Haiti #Earthquake
*ShakeMap (version 5) remains preliminary and subject to USGS updates. pic.twitter.com/AiH2FU1NeU
— Steve Bowen (@SteveBowenWx) August 14, 2021
- Frisch, W., Meschede, M., Blakey, R., 2011. Plate Tectonics, Springer-Verlag, London, 213 pp.
- Hayes, G., 2018, Slab2 – A Comprehensive Subduction Zone Geometry Model: U.S. Geological Survey data release, https://doi.org/10.5066/F7PV6JNV.
- Holt, W. E., C. Kreemer, A. J. Haines, L. Estey, C. Meertens, G. Blewitt, and D. Lavallee (2005), Project helps constrain continental dynamics and seismic hazards, Eos Trans. AGU, 86(41), 383–387, , https://doi.org/10.1029/2005EO410002. /li>
- Jessee, M.A.N., Hamburger, M. W., Allstadt, K., Wald, D. J., Robeson, S. M., Tanyas, H., et al. (2018). A global empirical model for near-real-time assessment of seismically induced landslides. Journal of Geophysical Research: Earth Surface, 123, 1835–1859. https://doi.org/10.1029/2017JF004494
- Kreemer, C., J. Haines, W. Holt, G. Blewitt, and D. Lavallee (2000), On the determination of a global strain rate model, Geophys. J. Int., 52(10), 765–770.
- Kreemer, C., W. E. Holt, and A. J. Haines (2003), An integrated global model of present-day plate motions and plate boundary deformation, Geophys. J. Int., 154(1), 8–34, , https://doi.org/10.1046/j.1365-246X.2003.01917.x.
- Kreemer, C., G. Blewitt, E.C. Klein, 2014. A geodetic plate motion and Global Strain Rate Model in Geochemistry, Geophysics, Geosystems, v. 15, p. 3849-3889, https://doi.org/10.1002/2014GC005407.
- Meyer, B., Saltus, R., Chulliat, a., 2017. EMAG2: Earth Magnetic Anomaly Grid (2-arc-minute resolution) Version 3. National Centers for Environmental Information, NOAA. Model. https://doi.org/10.7289/V5H70CVX
- Müller, R.D., Sdrolias, M., Gaina, C. and Roest, W.R., 2008, Age spreading rates and spreading asymmetry of the world’s ocean crust in Geochemistry, Geophysics, Geosystems, 9, Q04006, https://doi.org/10.1029/2007GC001743
- Pagani,M. , J. Garcia-Pelaez, R. Gee, K. Johnson, V. Poggi, R. Styron, G. Weatherill, M. Simionato, D. Viganò, L. Danciu, D. Monelli (2018). Global Earthquake Model (GEM) Seismic Hazard Map (version 2018.1 – December 2018), DOI: 10.13117/GEM-GLOBAL-SEISMIC-HAZARD-MAP-2018.1
- Silva, V ., D Amo-Oduro, A Calderon, J Dabbeek, V Despotaki, L Martins, A Rao, M Simionato, D Viganò, C Yepes, A Acevedo, N Horspool, H Crowley, K Jaiswal, M Journeay, M Pittore, 2018. Global Earthquake Model (GEM) Seismic Risk Map (version 2018.1). https://doi.org/10.13117/GEM-GLOBAL-SEISMIC-RISK-MAP-2018.1
- Zhu, J., Baise, L. G., Thompson, E. M., 2017, An Updated Geospatial Liquefaction Model for Global Application, Bulletin of the Seismological Society of America, 107, p 1365-1385, https://doi.org/0.1785/0120160198
References:
Basic & General References
Specific References
Return to the Earthquake Reports page.
- Sorted by Magnitude
- Sorted by Year
- Sorted by Day of the Year
- Sorted By Region