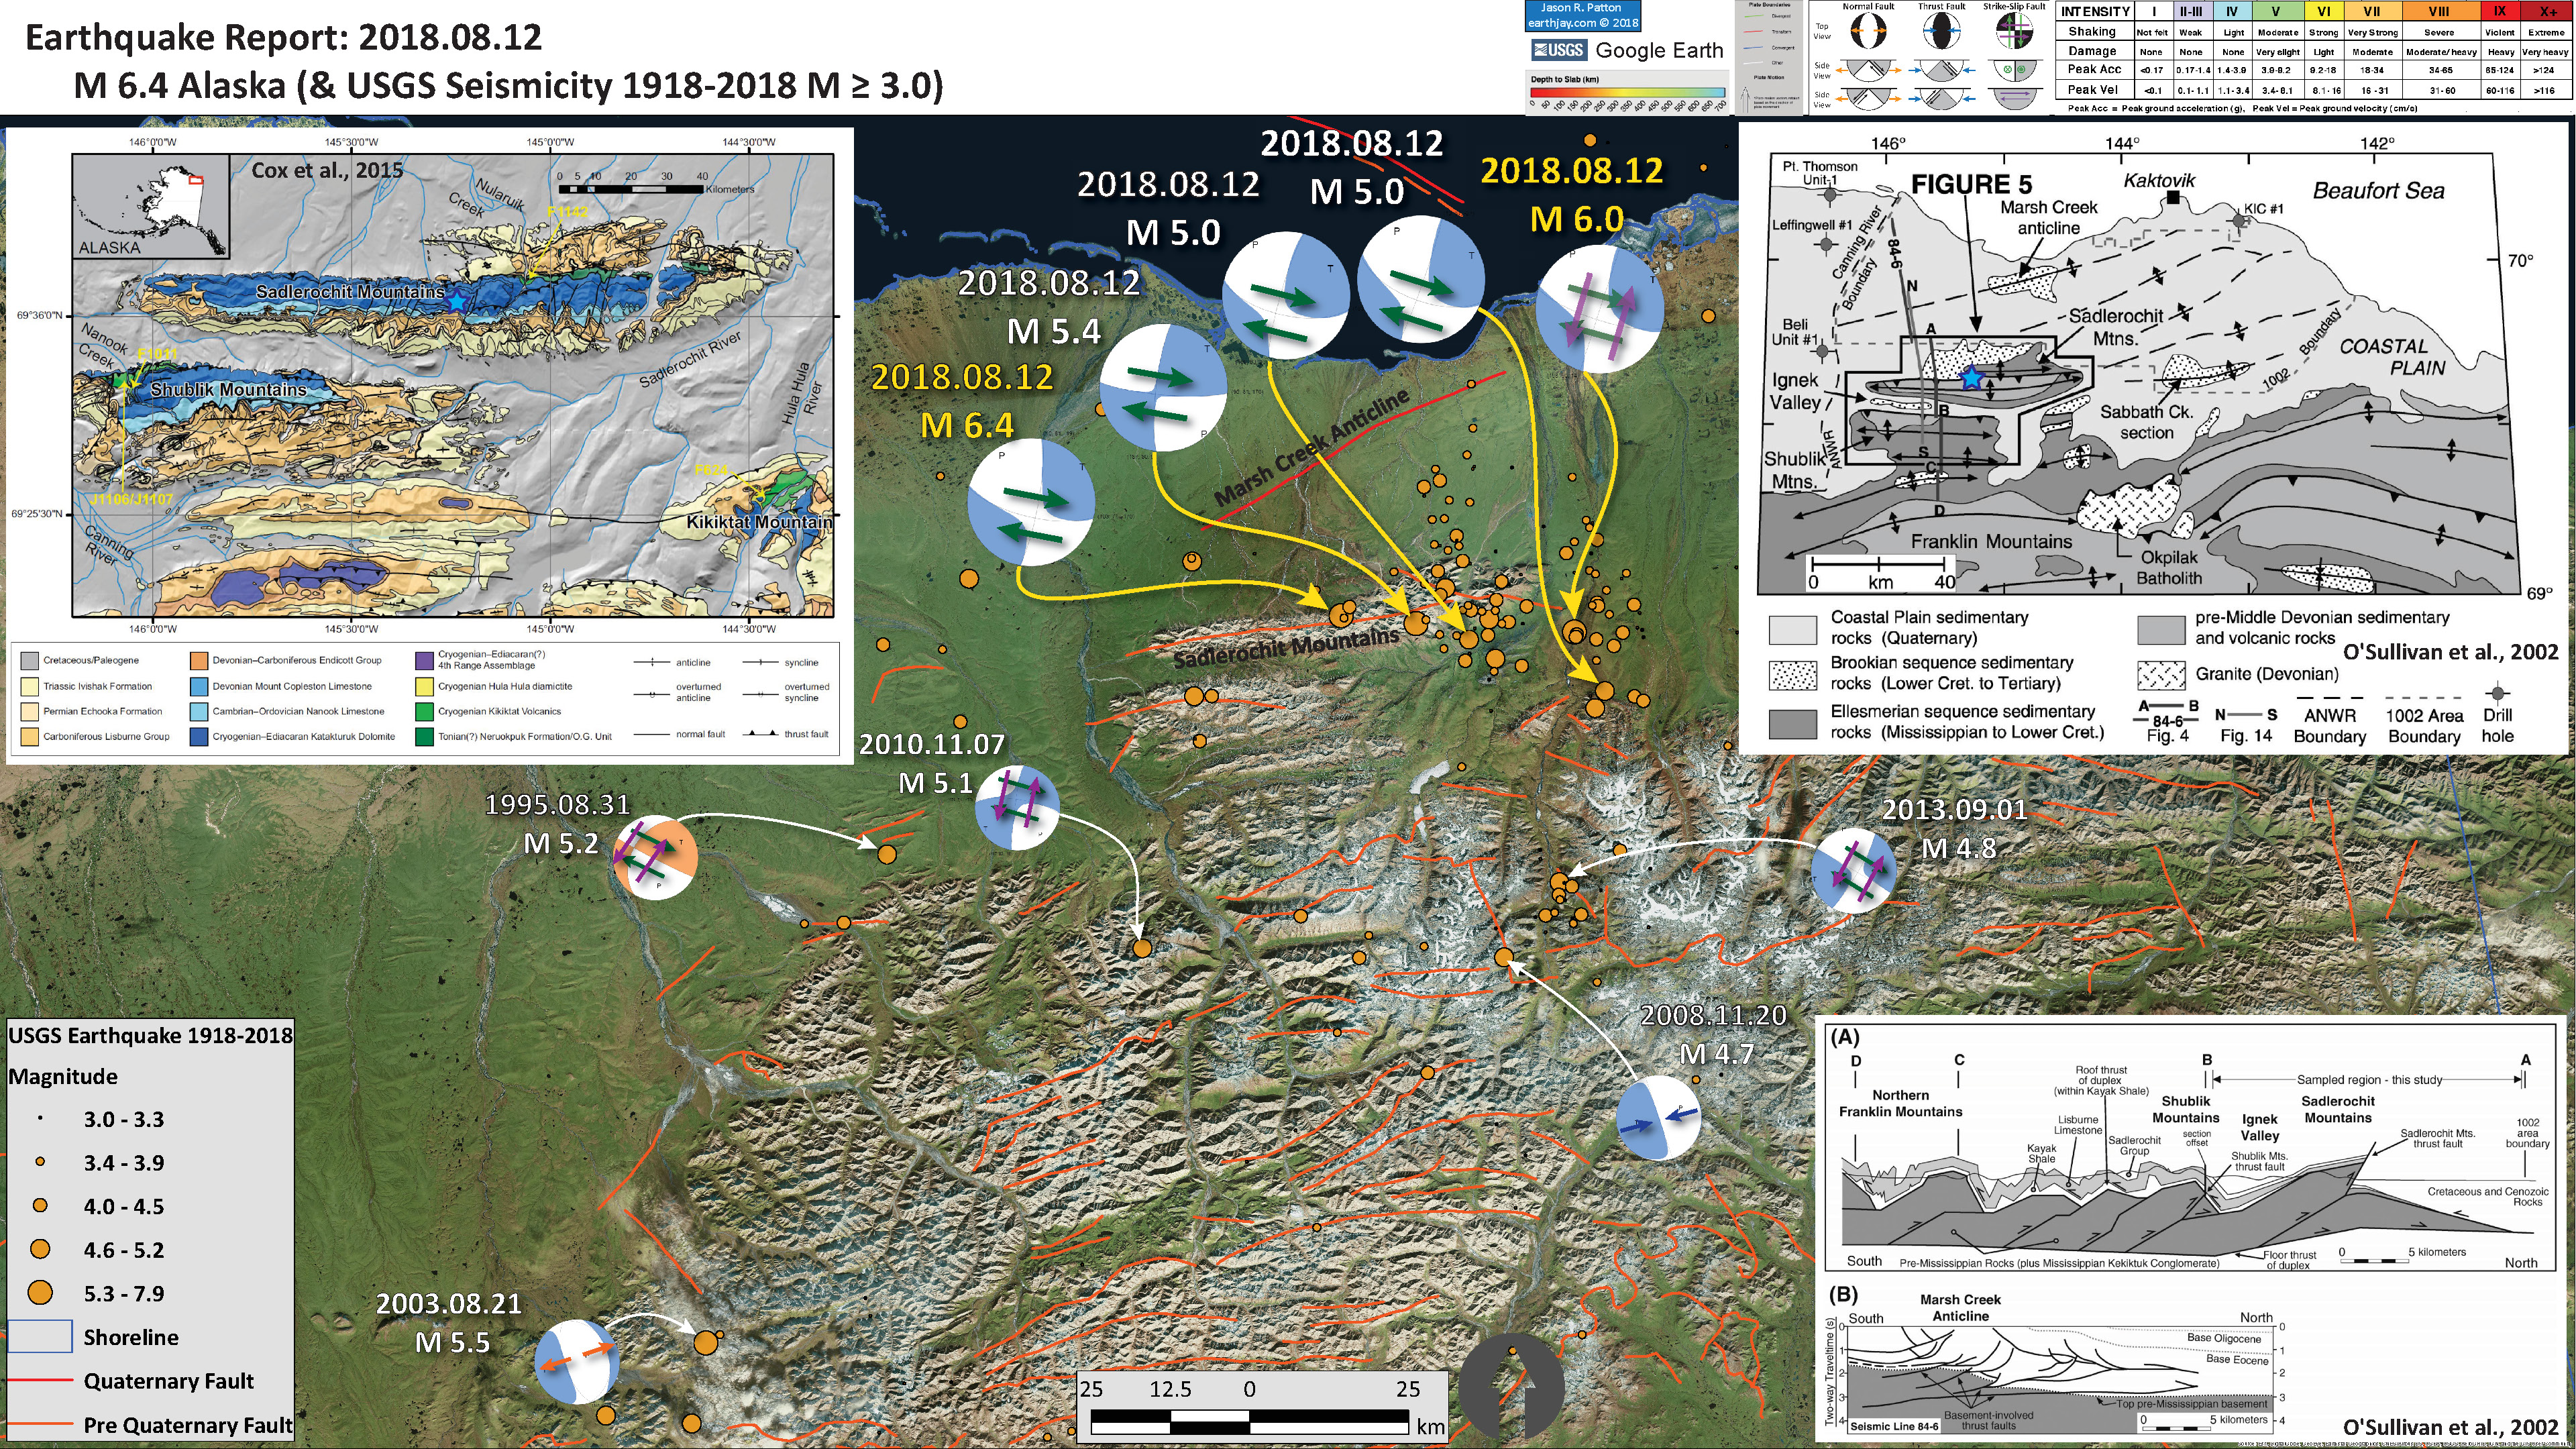
Well, I awakened shortly after this M 6.4 earthquake hit the northern part of Alaska, along the north Slope, north of the Brooks Range.
My inbox has had a lower frequency of USGS ENS notifications since Kilauea has settled down somewhat. However, today, the aftershocks just keep rolling in. Those who are on the north slope are getting rattled for sure. I have had to reproduce my seismicity maps several times as the epicenters keep getting updated (thanks USGS). The two largest earthquakes are now actually aligned with the west northwest strike of the earthquake.
There are no active faults mapped in the region of today’s earthquakes. There is a series of thrust faults that form the mountains in this area (e.g. the Sadlerochit Mountains). To the north is a Quaternary active fold (the Marsh Creek anticline), however, this structure is too far away to be related to today’s activity.
The interesting thing is that today’s series of earthquakes are strike-slip earthquakes. It is possible that one of these thrust faults has been reactivated as a strike-slip fault (but they are probably dipping too shallow to do this). So, i suspect that these earthquakes are either on an un-mapped active fault or are distributed throughout the region on a variety of different faults (seems more likely, but I would defer to those who are studying the tectonics on the North Slope to be more informed about this). These earthquakes remind me of the 2002 dextral (right-lateral) strike-slip Denali fault earthquake. More on the Denali Earthquake can be found here too.
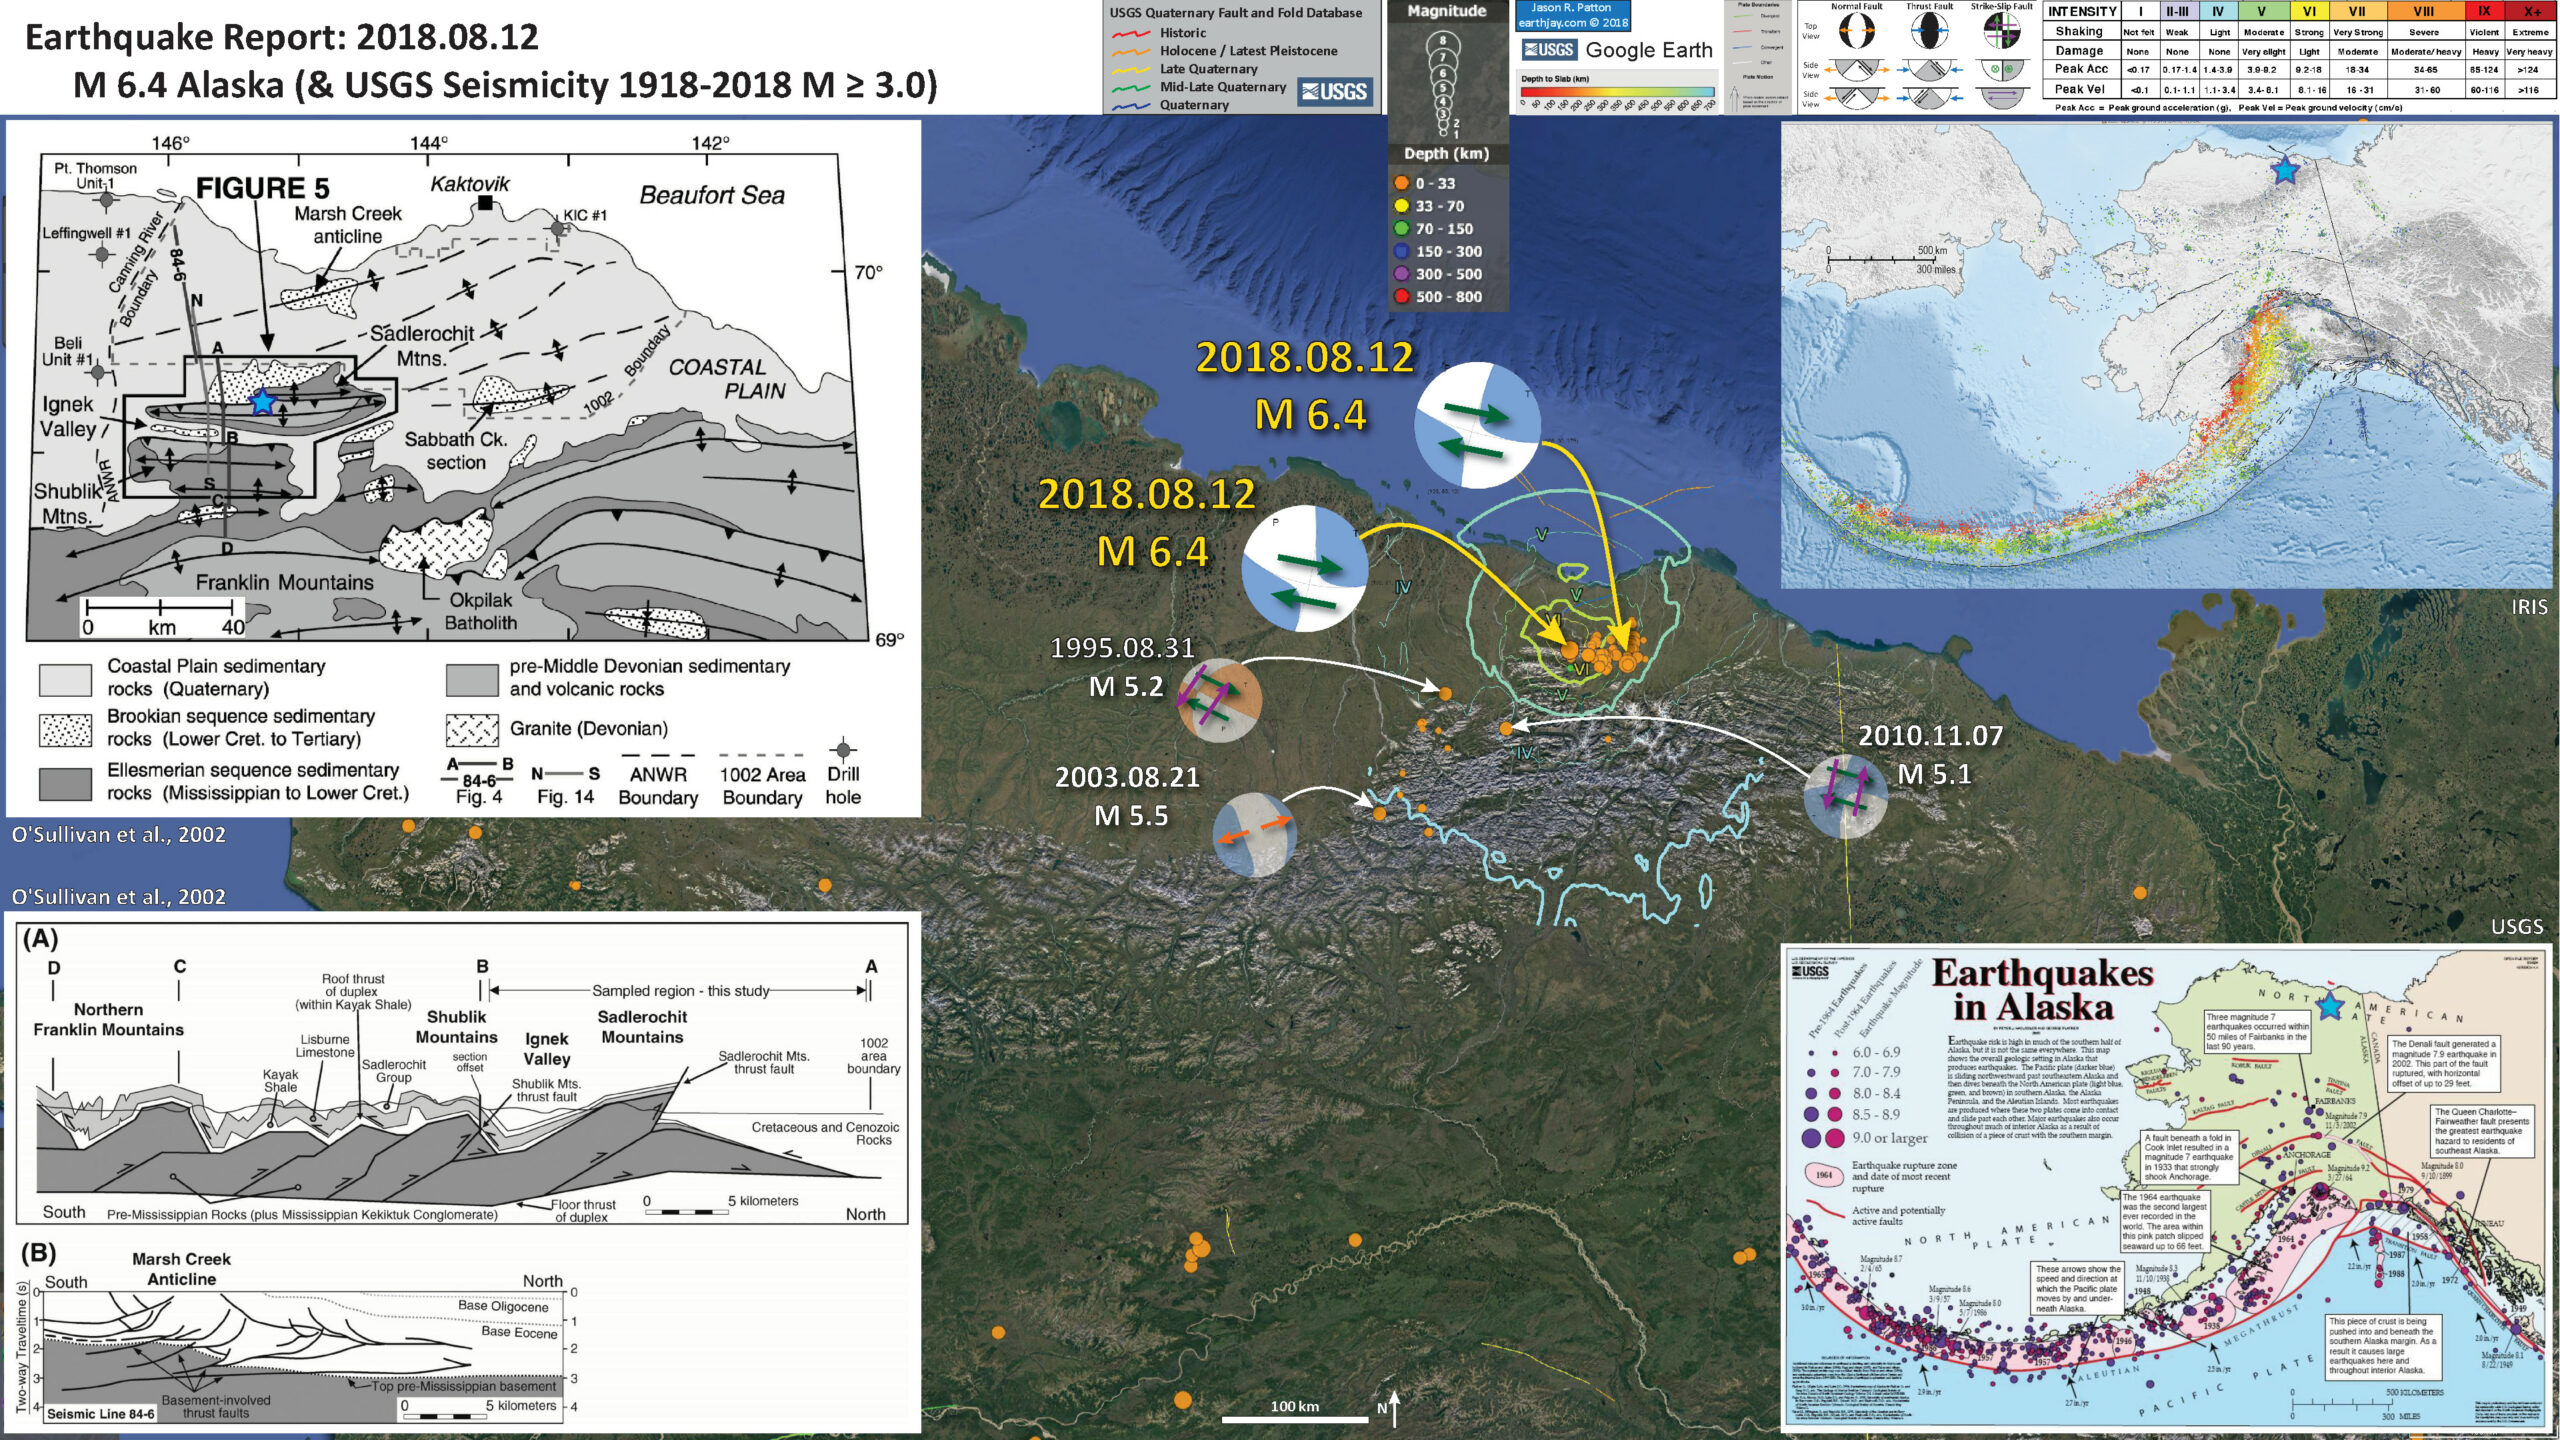
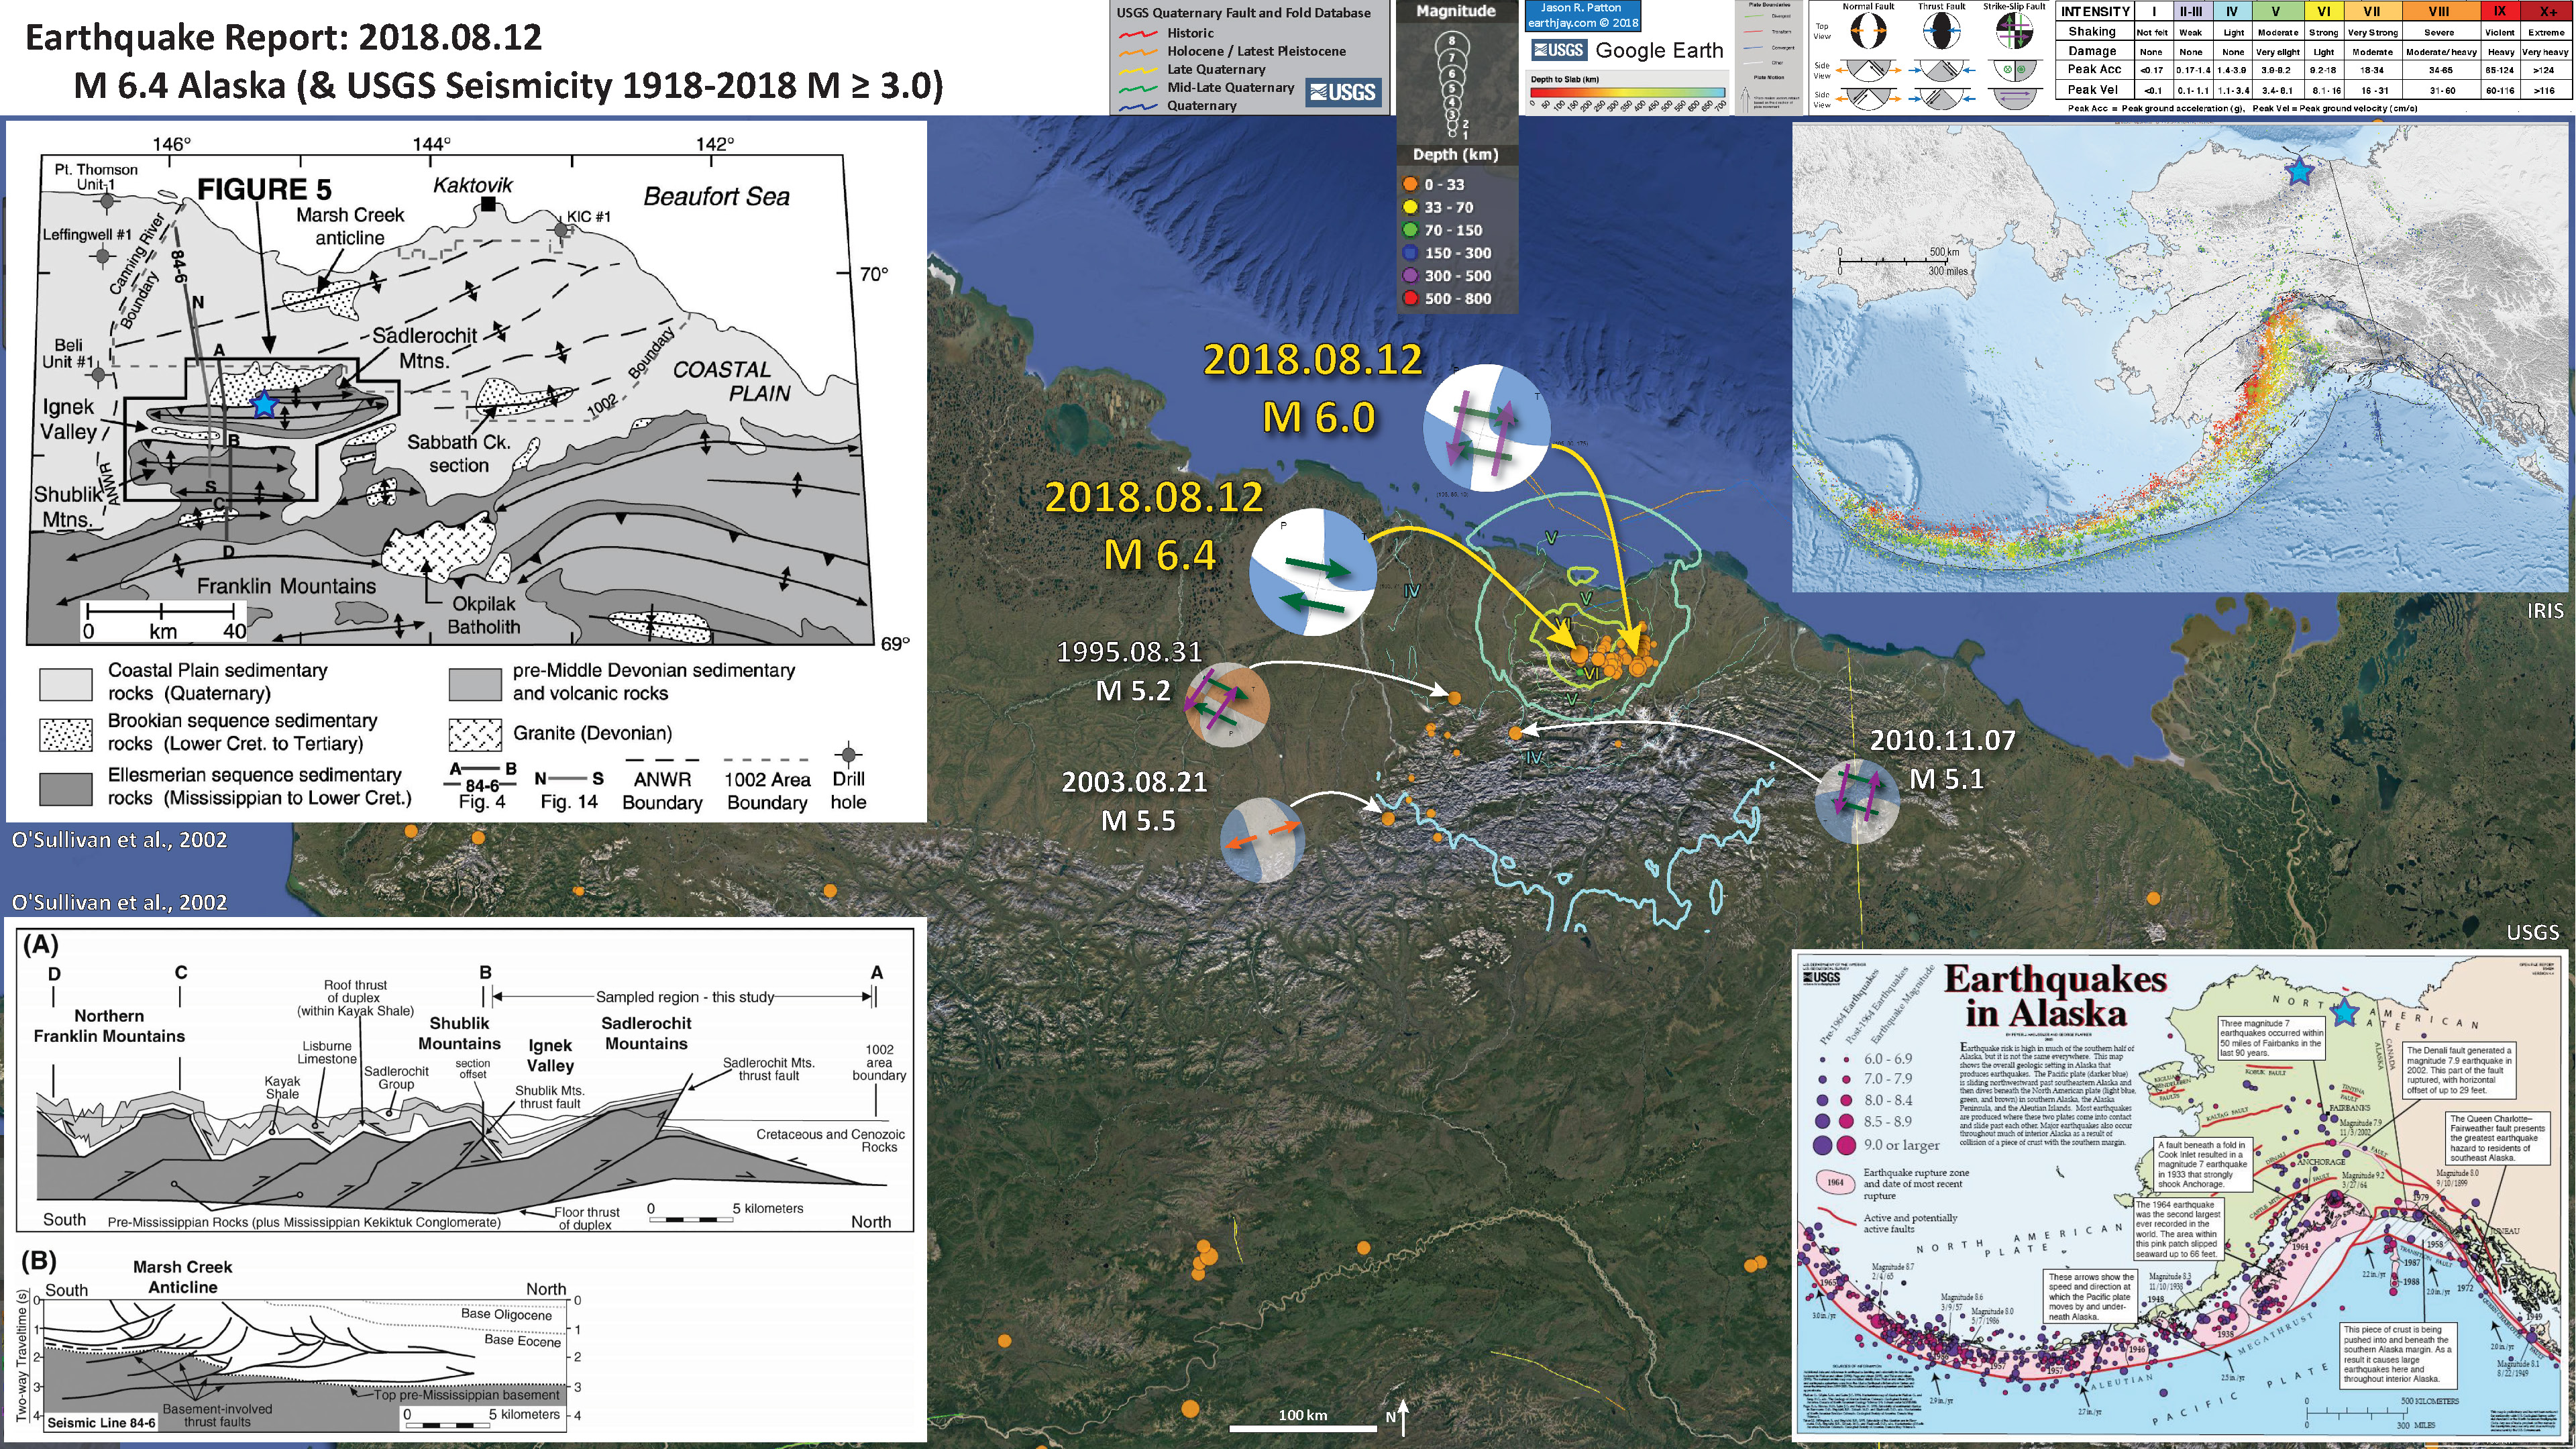
I include a second poster below that has more details about the regional geology. On this map I include faults and folds from the Alaska Quaternary Active Faults and Folds database (Keohler et al., 2013).
Based upon the seismicity, I interpret these earthquakes (at least the ones with mechanisms) as east striking right-lateral strike-slip earthquakes. The historic earthquakes are not as easy to interpret, so I include both nodal plane solutions as being possible. However, if they are related in some way to today’s seismicity, they are probably also right-lateral strike-slip earthquakes.
Below is my interpretive poster for this earthquake
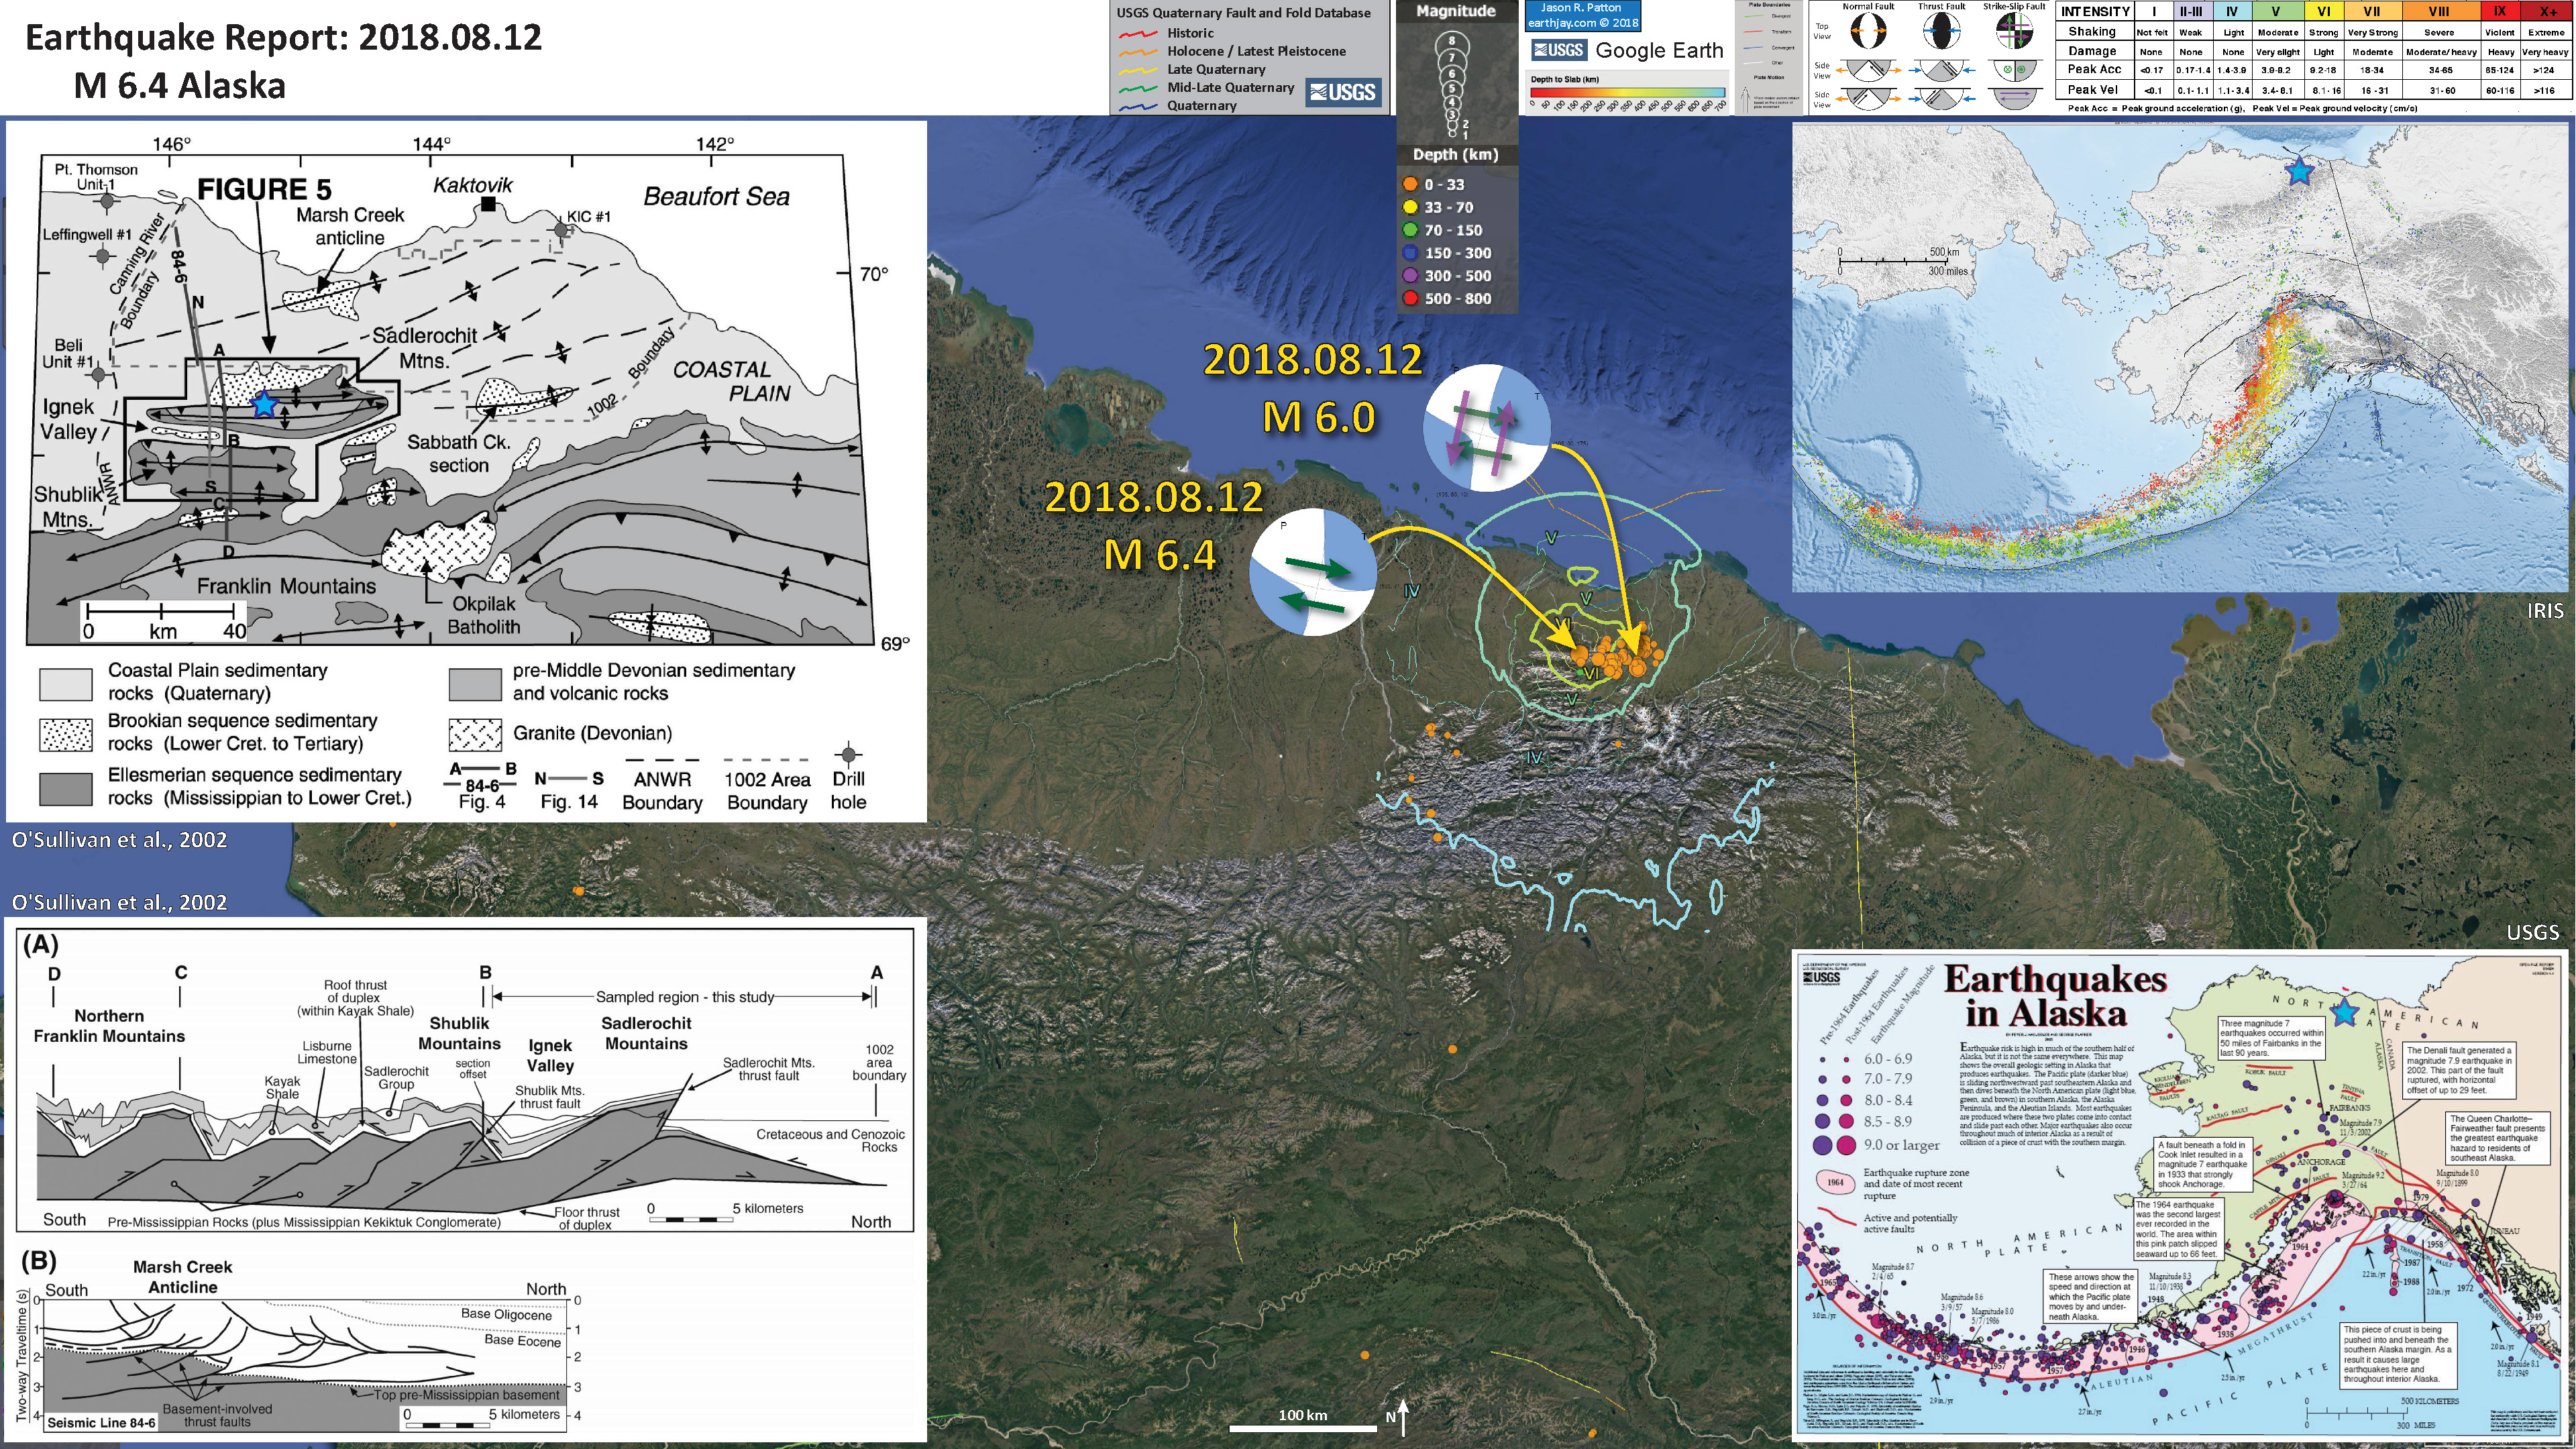
I plot the seismicity from the past month, with color representing depth and diameter representing magnitude (see legend). I include earthquake epicenters from 1918-2018 with magnitudes M ≥ 3.0 in one version.
I plot the USGS fault plane solutions (moment tensors in blue and focal mechanisms in orange), possibly in addition to some relevant historic earthquakes.
- I placed a moment tensor / focal mechanism legend on the poster. There is more material from the USGS web sites about moment tensors and focal mechanisms (the beach ball symbols). Both moment tensors and focal mechanisms are solutions to seismologic data that reveal two possible interpretations for fault orientation and sense of motion. One must use other information, like the regional tectonics, to interpret which of the two possibilities is more likely.
- I also include the shaking intensity contours on the map. These use the Modified Mercalli Intensity Scale (MMI; see the legend on the map). This is based upon a computer model estimate of ground motions, different from the “Did You Feel It?” estimate of ground motions that is actually based on real observations. The MMI is a qualitative measure of shaking intensity. More on the MMI scale can be found here and here. This is based upon a computer model estimate of ground motions, different from the “Did You Feel It?” estimate of ground motions that is actually based on real observations.
- In the upper right corner is a map from IRIS that shows historic seismicity in the Alaska region. Color represents depth. One may visualize the subduction zone as shallower earthquakes are green in color and the deeper earthquakes are red in color.
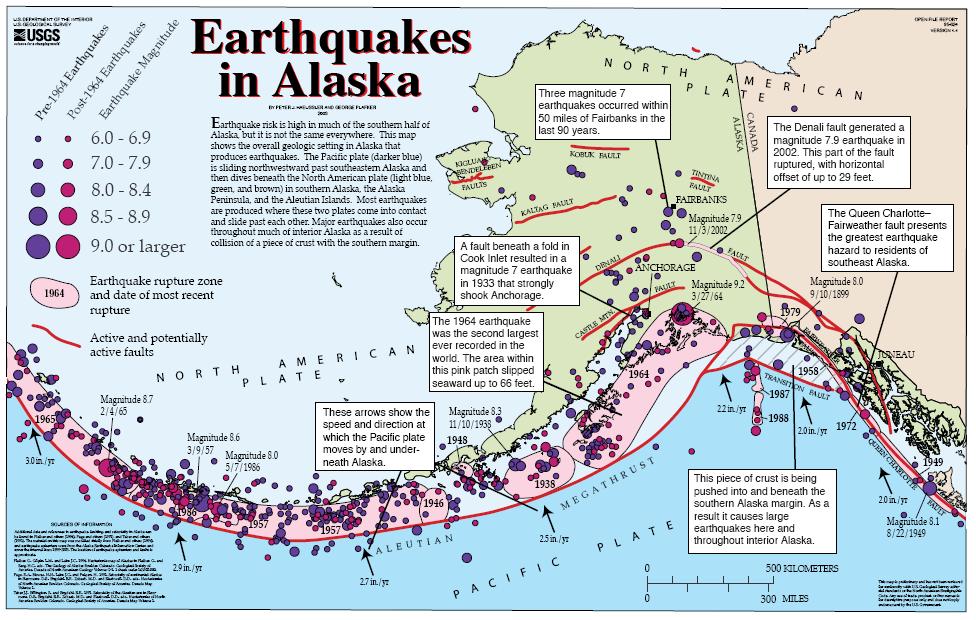
- In the lower right corner is a USGS map showing the major historic earthquakes in Alaska. Most of these are subduction zone earthquakes, however, the 2002 Denali Earthquake also shows up. This was a right-lateral strike-slip earthquake on the Denali fault. I place a blue star in the general location of today’s first M 6.4 earthquake.
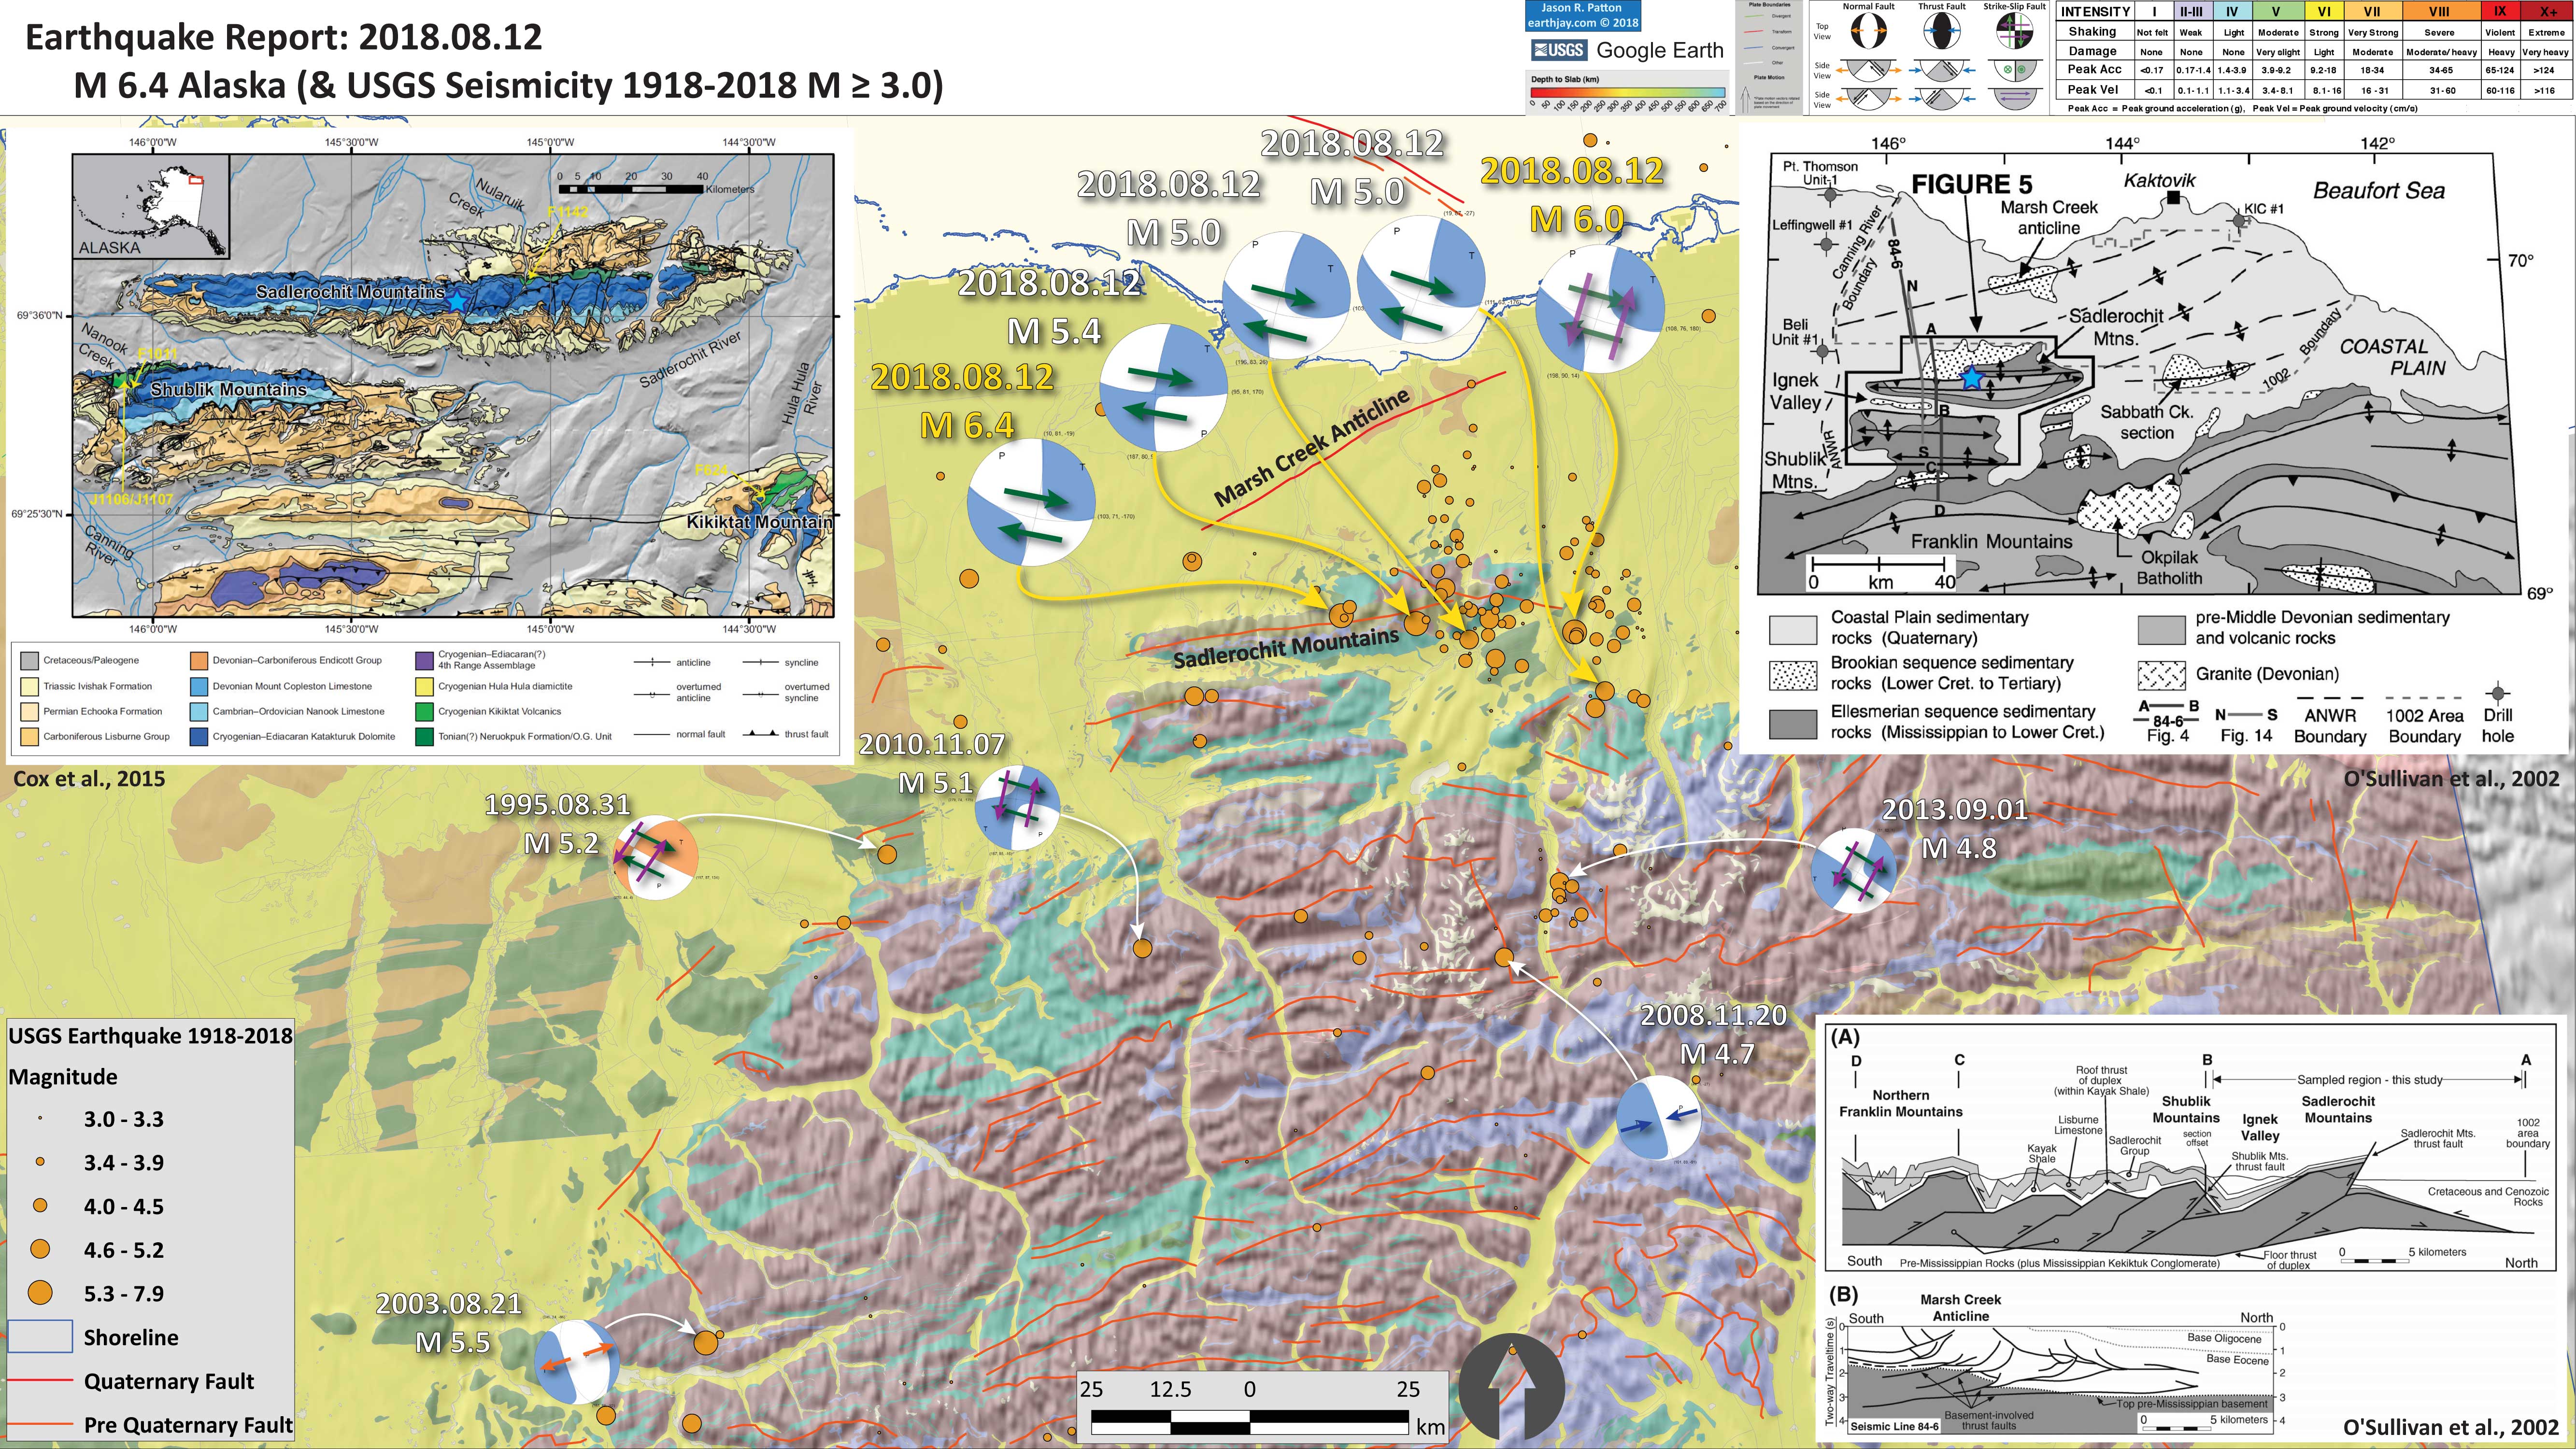
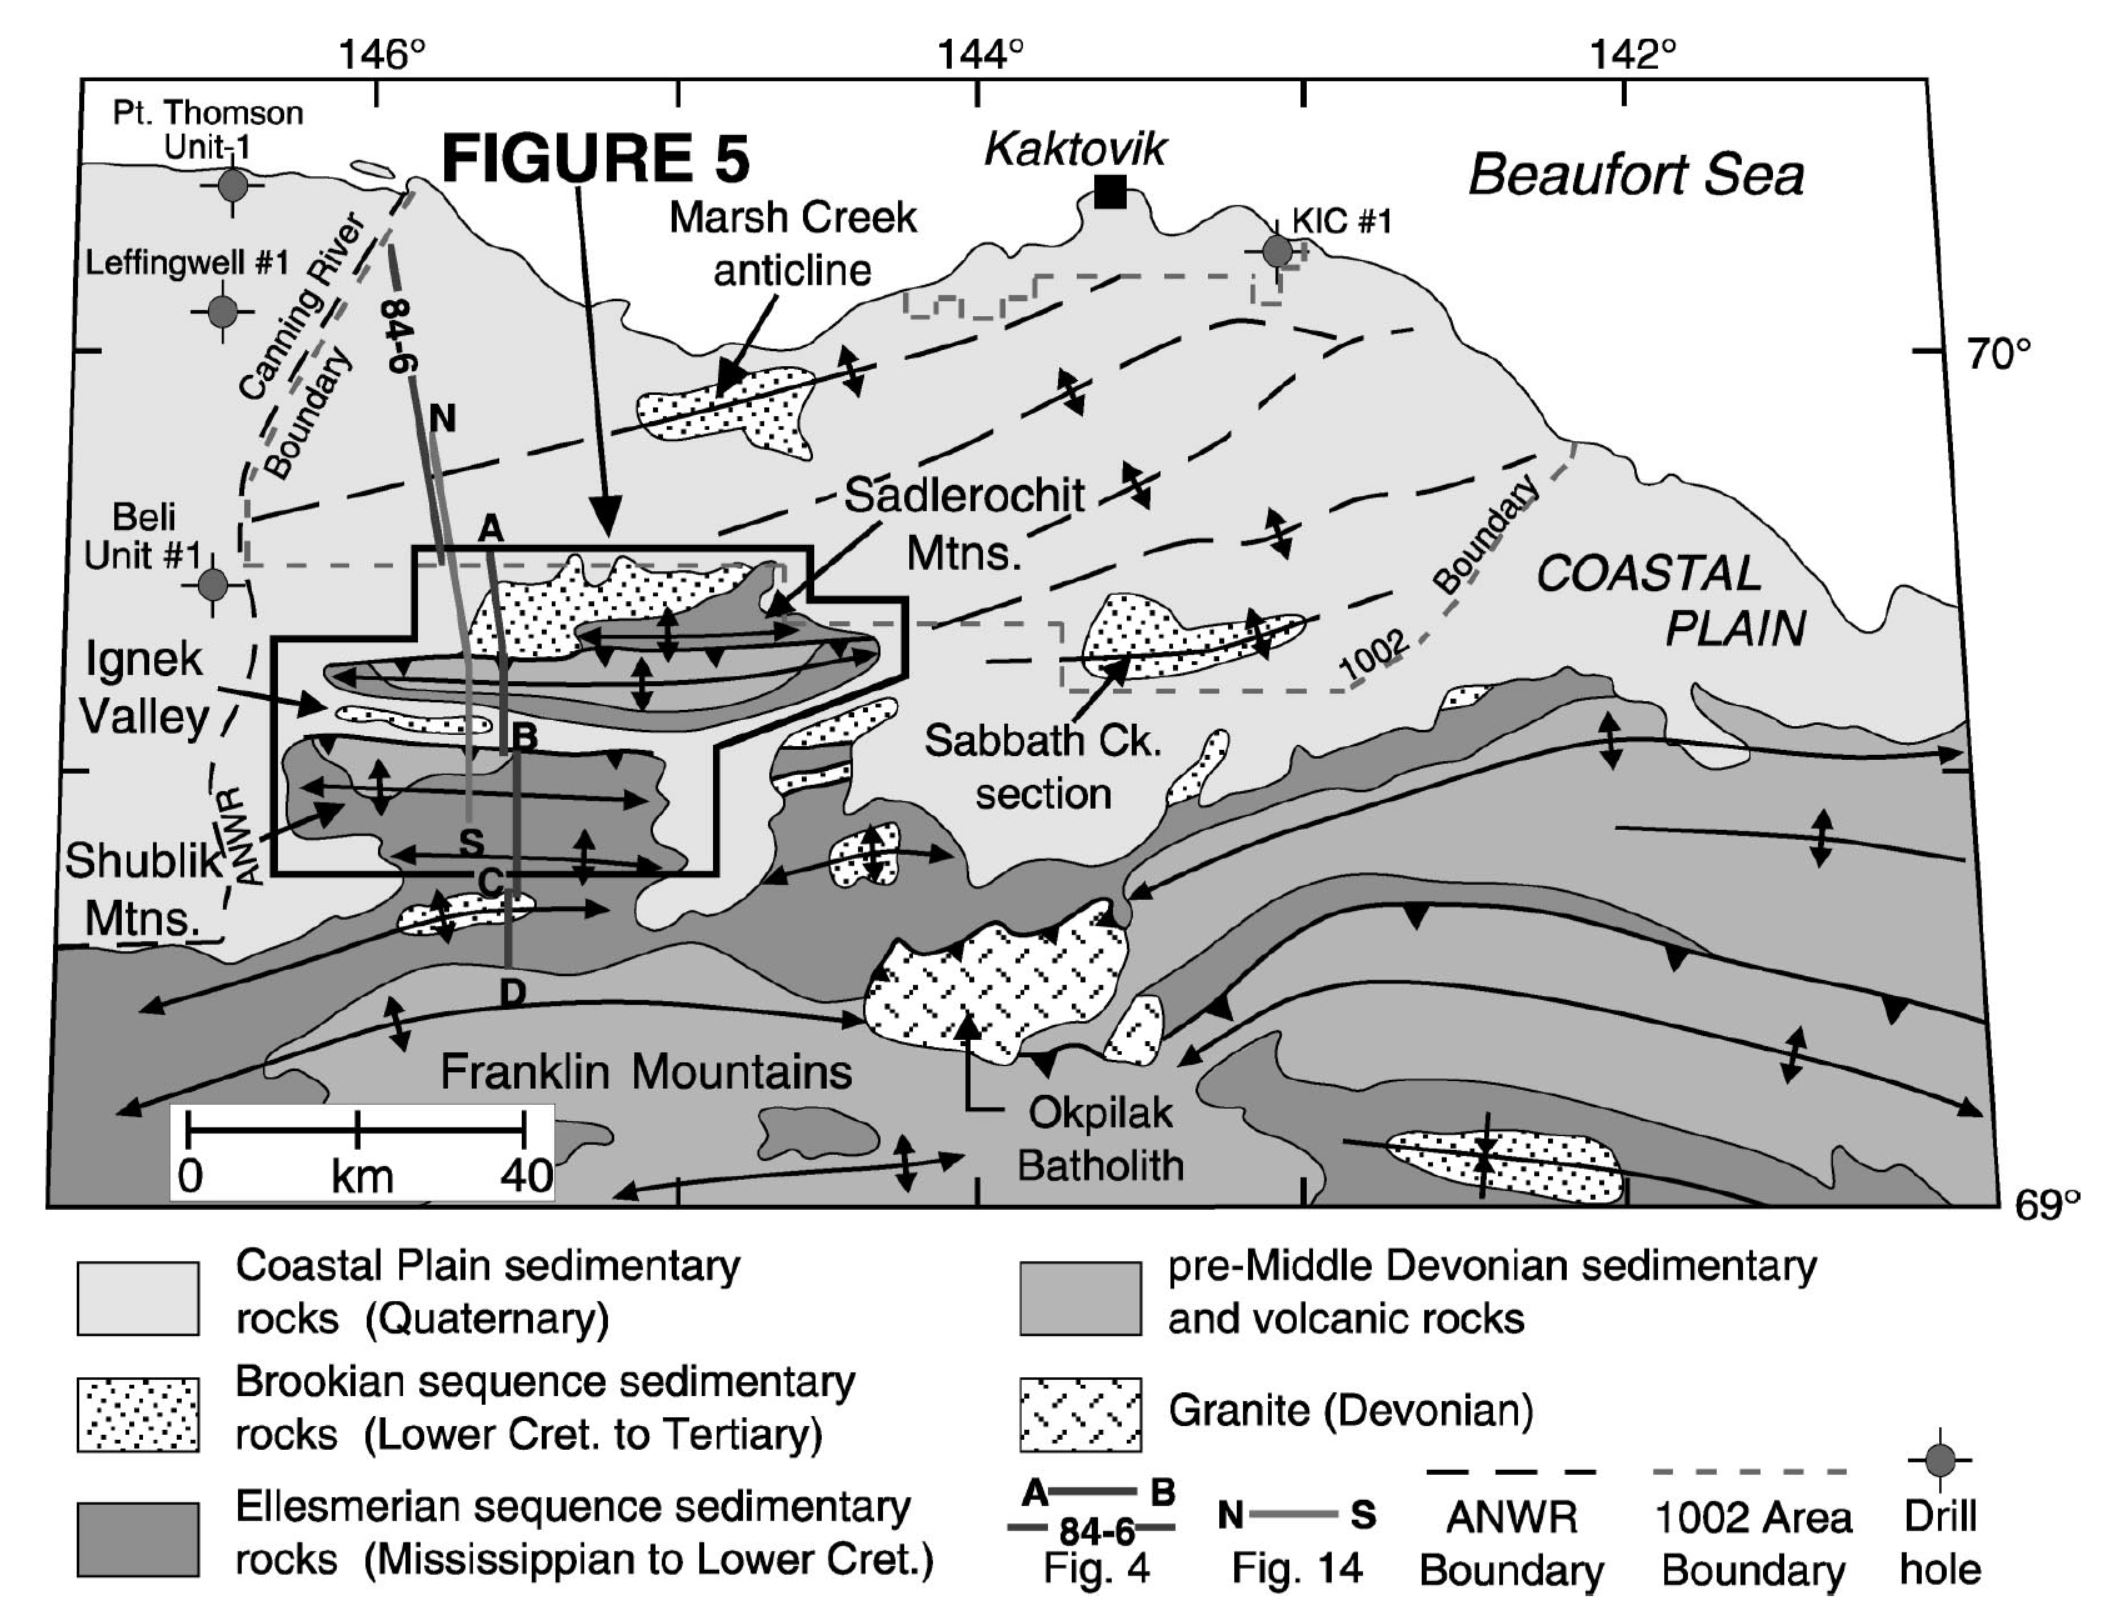
- In the upper left corner is a large scale map showing the tectonics on the eastern North Slope (O’Sullivan et al., 2012). This map shows the anticlines and thrust faults. Anticlines are folds in the crust that are formed by compression, with the fold being pushed upwards (viewed from the side, it would look like a frown). The thrust fautls are symbolized with triangles pointed in the direction down dip (into the earth). There is a thrust fault on the north flank of the southern of the two anticlines in the Sadlerochit Mountains.
- In the lower left corner is a cross section showing how these thrust faults and anticlines are possibly configured (O’Sullivan et al., 2012).
I include some inset figures. Some of the same figures are located in different places on the larger scale map below.
- Here is the map with a month’s seismicity plotted.
- Here is the map with a centuries’ seismicity plotted.
- Here is the larger scale map showing more detail. This includes faults from the Alaska QFF (Koehler et al., 2013). I include a shaded relief map as a base map. I also include the state geological map (Wheeler et al., 1997), colored relative to the age of the geologic unit.
- UPDATE This is the same map with ESRI imagery as a basemap.
Other Report Pages
Some Relevant Discussion and Figures
- Here is an informational video from IRIS explaining the tectonics in Alaska. There is a paucity of information about the geology of the north slope in this video, but it is still very educational.
- Here is the USGS mpa showing historic earthquakes in Alaska.
- Here is the IRIS map showing seismicity relative to depth (color).

- This is the low angle oblique view of the Alaska-Aleutian subduction zone. Note how the downgoing Pacific plate subducts beneath the North America plate.

- Below are 3 figures from O’Sullivan et al. (2012) that present their interpretations for the tectonic structures along the eastern portion of the North Slope in Alaska.
- Here is their intro overview map. The second map below is outlined here.
- This is a larger scale map showing the details for the structures in the area. The cross section locations are labeled here.
- This is a cross section showing their interpretation of how these thrust faults relate to each other. Note the lack of a strike slip fault in this area.
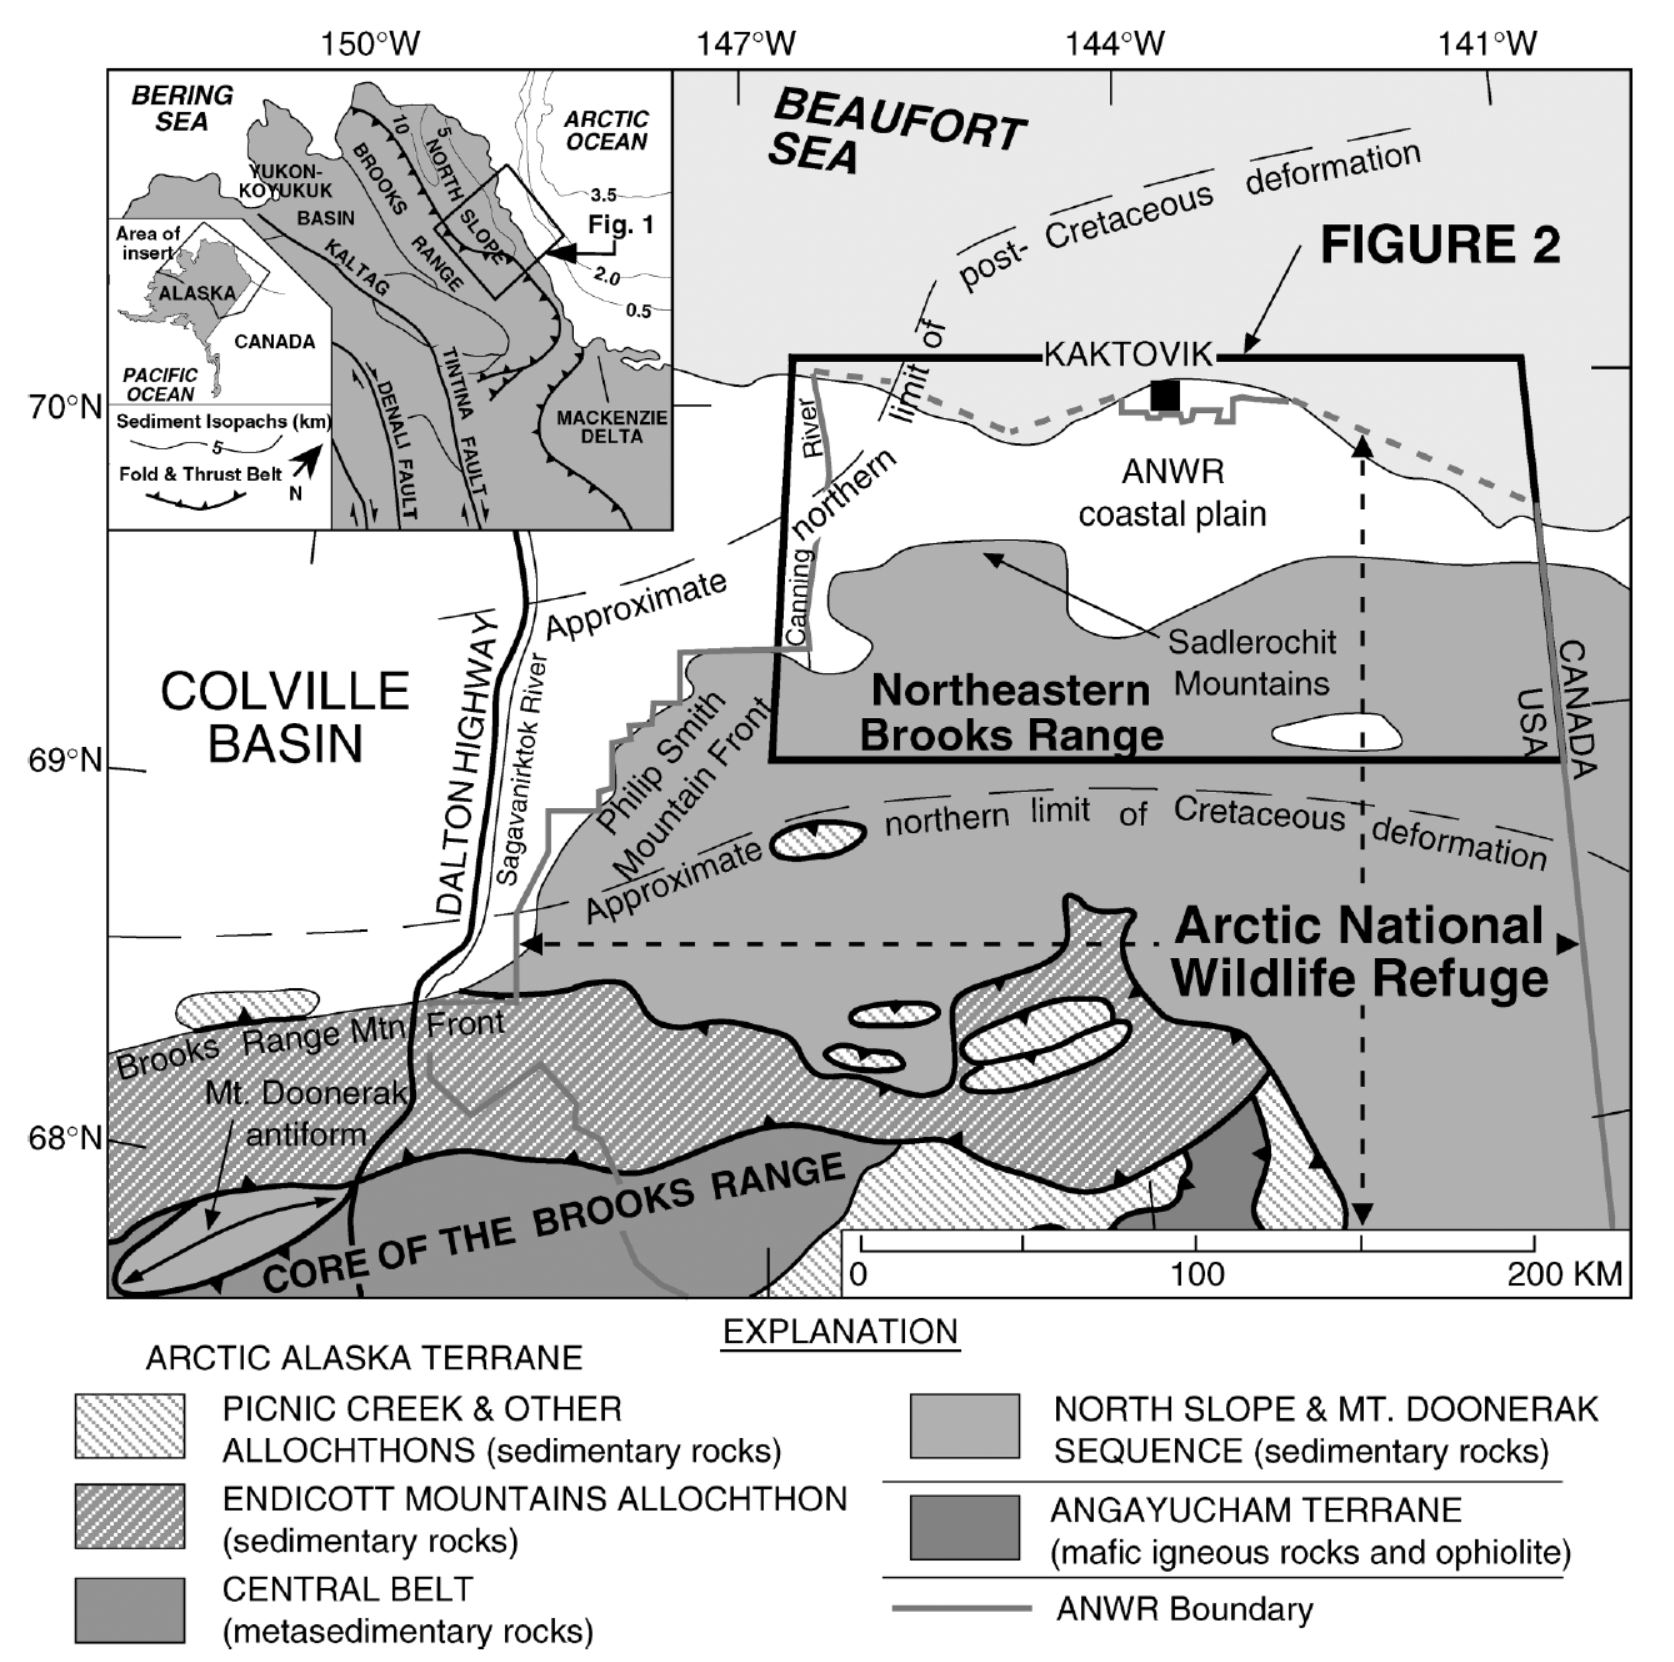
Generalized geologic map of northeastern Alaska, showing the location of the Arctic National Wildlife Refuge (ANWR), the northeastern Brooks Range, and other features specifically mentioned in the text.
Tectonic map of the northeastern Brooks Range, showing the location of the Sadlerochit and Shublik mountain ranges, Ignek Valley, the Beli Unit #1 well, seismic line 84-6, and other features mentioned in the text. Map modified from Wallace and Hanks (1990).
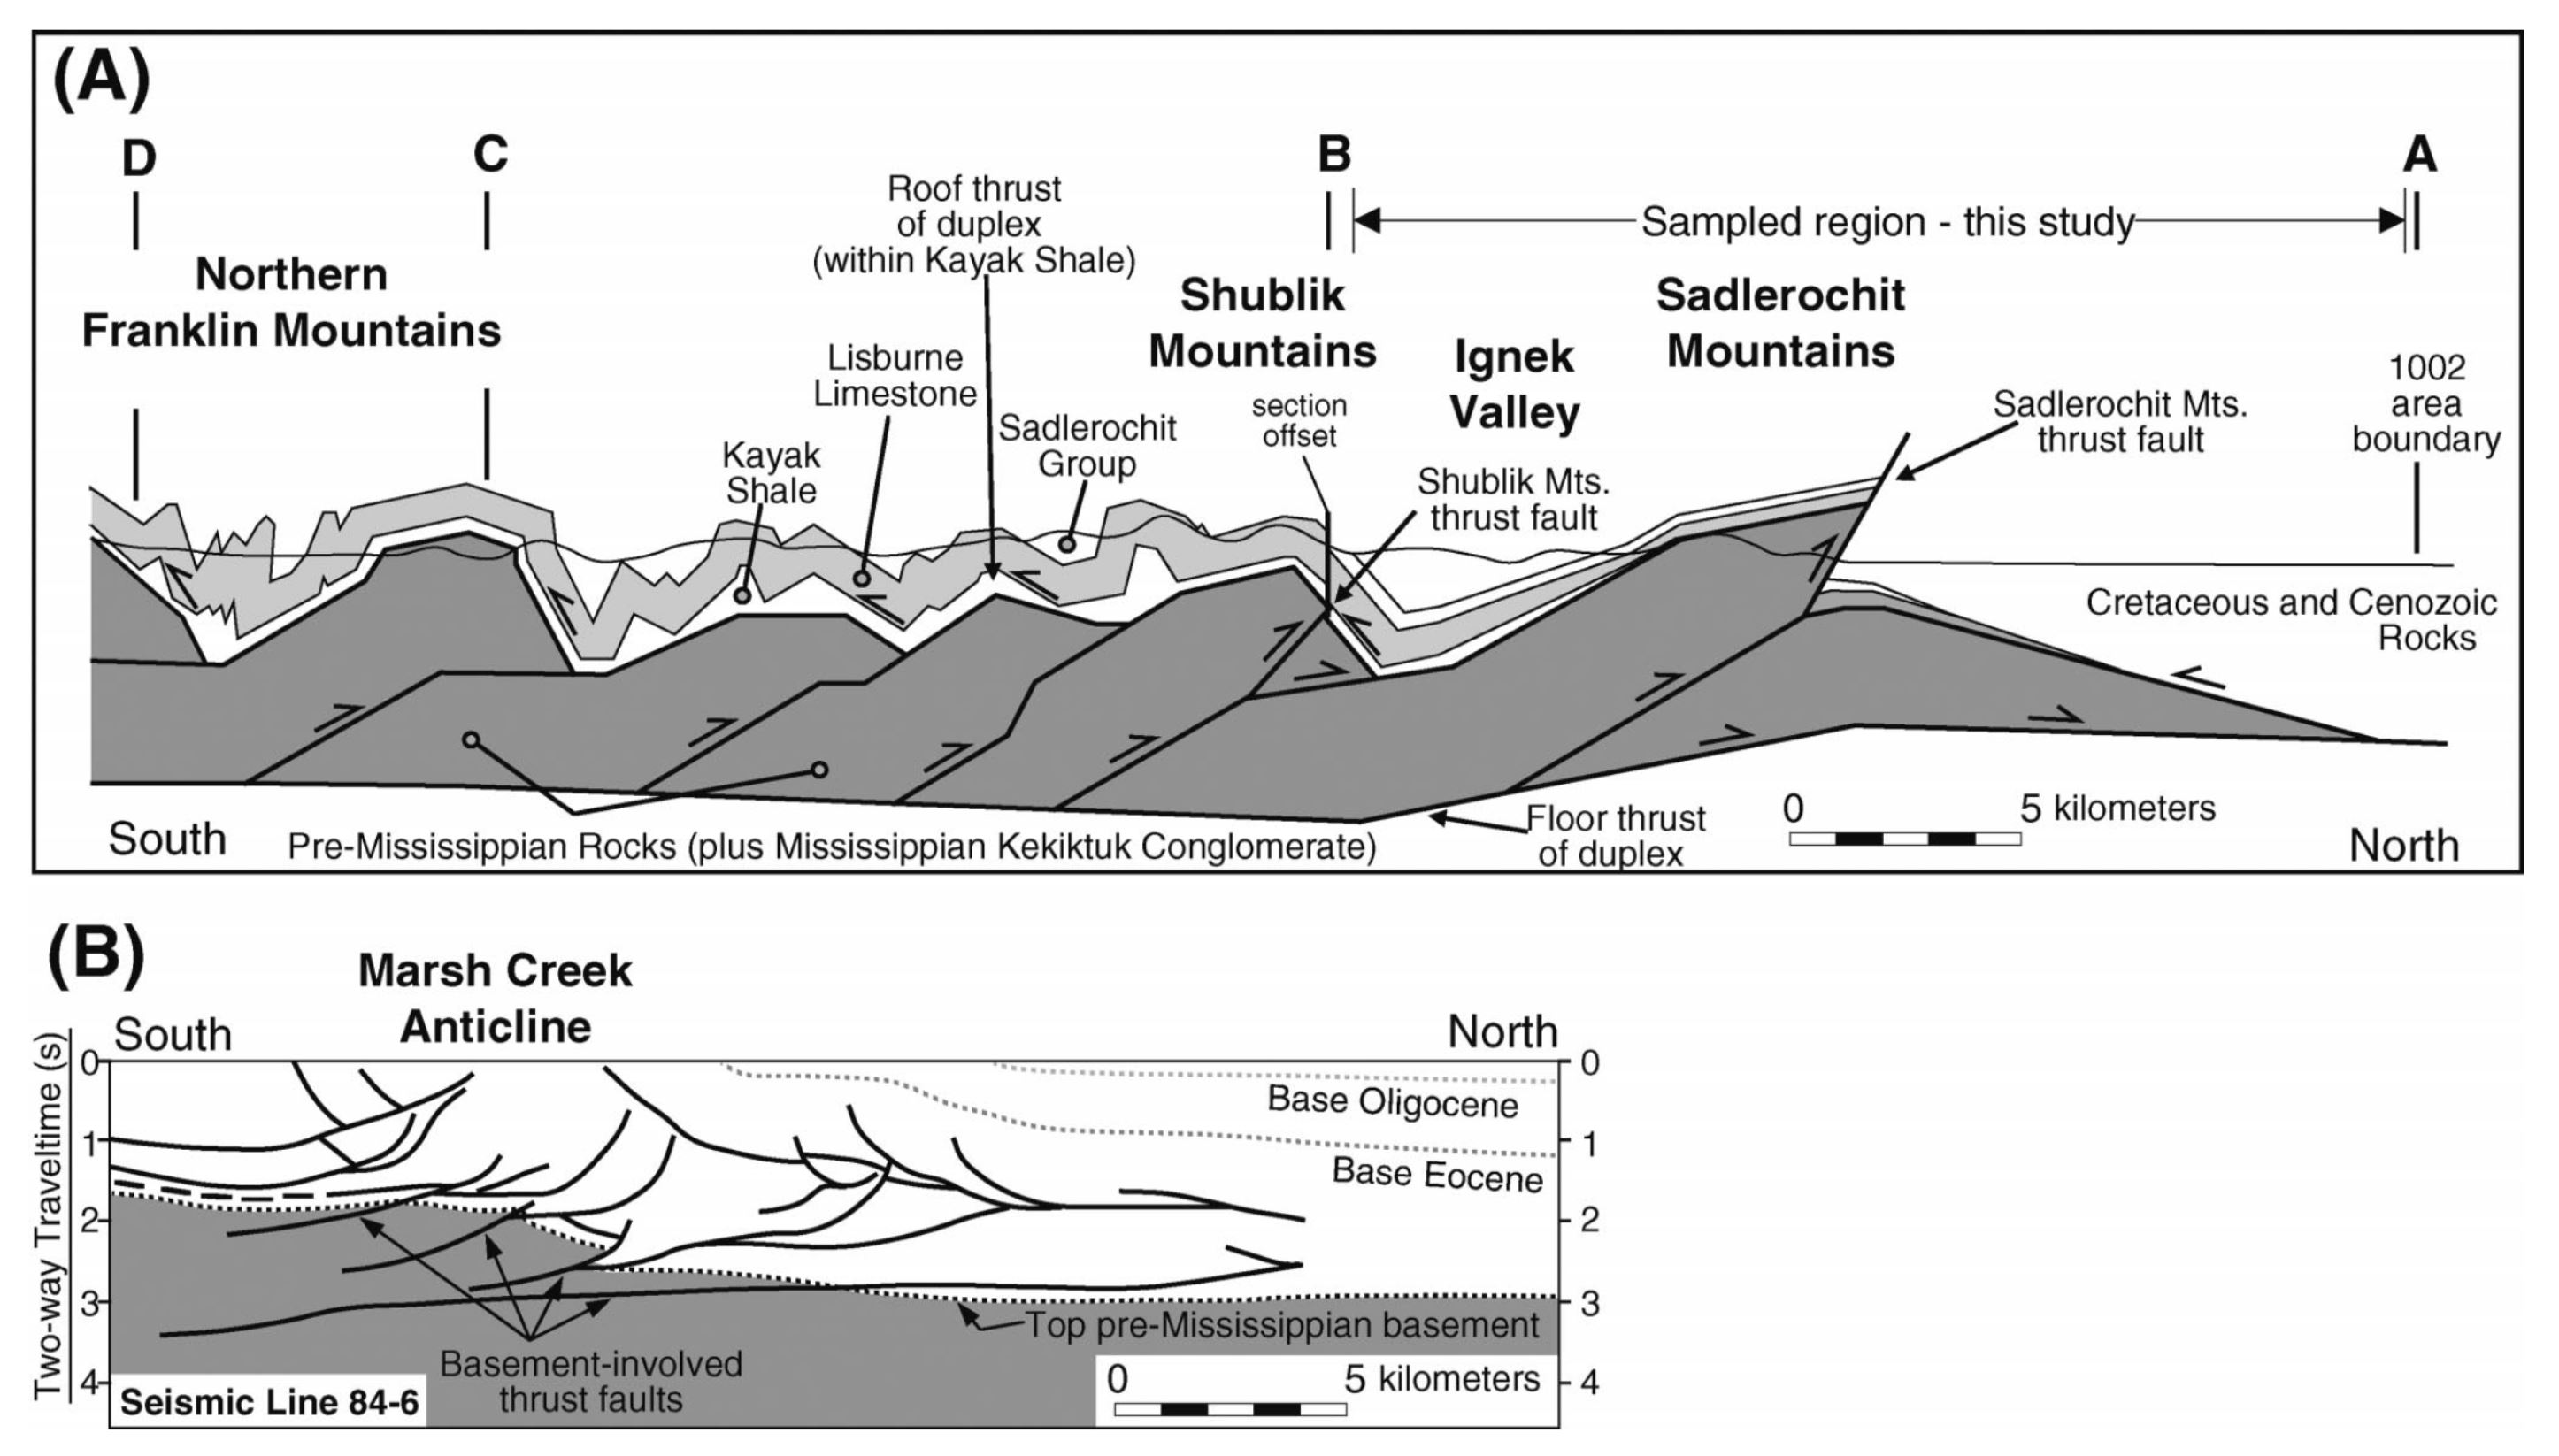
Presentation of known structures recognized within the Sadlerochit Mountains region. (A) Balanced cross section through the northern part of northeastern Brooks Range (modified from Wallace, 1993). Each basement-cored anticlinorium is interpreted to mark a horse in a duplex formed above a detachment at depth in basement (dark shading). The roof thrust in Kayak Shale terminates to north in the Sadlerochit Mountains owing to depositional discontinuity. All structures shown are interpreted to be Cenozoic in age. (B) Reproduced interpretation of seismic line 84-6 by Potter et al. (1999, plate BD2), indicating that basement rocks were involved in deformation beneath the coastal plain to the north of the Sadlerochit Mountains (at same scale as A).
- Here is a map from Cox et al. (2015) that shows some detailed geologic mapping in the region.

Simplified geologic map of the Shublik and Sadlerochit Mountains, northeastern Brooks Range, Alaska. The Kikiktat volcanics are shown in green and outcrop in the hanging wall of large N-directed Cretaceous–Tertiary Brookian thrust sheets. Geologic is mapping by Strauss and Macdonald, with modifications from Robinson et al. (1989) and Bader and Bird (1986).
Geologic Fundamentals
- For more on the graphical representation of moment tensors and focal mechnisms, check this IRIS video out:
- Here is a fantastic infographic from Frisch et al. (2011). This figure shows some examples of earthquakes in different plate tectonic settings, and what their fault plane solutions are. There is a cross section showing these focal mechanisms for a thrust or reverse earthquake. The upper right corner includes my favorite figure of all time. This shows the first motion (up or down) for each of the four quadrants. This figure also shows how the amplitude of the seismic waves are greatest (generally) in the middle of the quadrant and decrease to zero at the nodal planes (the boundary of each quadrant).

- Here is another way to look at these beach balls.
The two beach balls show the stike-slip fault motions for the M6.4 (left) and M6.0 (right) earthquakes. Helena Buurman's primer on reading those symbols is here. pic.twitter.com/aWrrb8I9tj
— AK Earthquake Center (@AKearthquake) August 15, 2018
- There are three types of earthquakes, strike-slip, compressional (reverse or thrust, depending upon the dip of the fault), and extensional (normal). Here is are some animations of these three types of earthquake faults. The following three animations are from IRIS.
Strike Slip:
Compressional:
Extensional:
- This is an image from the USGS that shows how, when an oceanic plate moves over a hotspot, the volcanoes formed over the hotspot form a series of volcanoes that increase in age in the direction of plate motion. The presumption is that the hotspot is stable and stays in one location. Torsvik et al. (2017) use various methods to evaluate why this is a false presumption for the Hawaii Hotspot.
- Here is a map from Torsvik et al. (2017) that shows the age of volcanic rocks at different locations along the Hawaii-Emperor Seamount Chain.

A cutaway view along the Hawaiian island chain showing the inferred mantle plume that has fed the Hawaiian hot spot on the overriding Pacific Plate. The geologic ages of the oldest volcano on each island (Ma = millions of years ago) are progressively older to the northwest, consistent with the hot spot model for the origin of the Hawaiian Ridge-Emperor Seamount Chain. (Modified from image of Joel E. Robinson, USGS, in “This Dynamic Planet” map of Simkin and others, 2006.)

Hawaiian-Emperor Chain. White dots are the locations of radiometrically dated seamounts, atolls and islands, based on compilations of Doubrovine et al. and O’Connor et al. Features encircled with larger white circles are discussed in the text and Fig. 2. Marine gravity anomaly map is from Sandwell and Smith.
- Summary of the 1964 Earthquake
- 2018.08.12 M 6.4 North Alaska
- 2018.01.23 M 7.9 Gulf of Alaska
- 2018.01.23 M 7.9 Gulf of Alaska UPDATE #1
- 2018.01.23 M 7.9 Gulf of Alaska UPDATE #2
- 2017.07.17 M 7.7 Aleutians
- 2017.07.17 M 7.7 Aleutians UPDATE #1
- 2017.06.02 M 6.8 Aleutians
- 2017.05.08 M 6.2 Aleutians
- 2017.05.01 M 6.3 British Columbia
- 2017.03.29 M 6.6 Kamchatka
- 2017.03.02 M 5.5 Alaska
- 2016.09.05 M 6.3 Bering Kresla (west of Aleutians)
- 2016.04.13 M 5.7 & 6.4 Kamchatka
- 2016.04.02 M 6.2 Alaska Peninsula
- 2016.03.27 M 5.7 Aleutians
- 2016.03.12 M 6.3 Aleutians
- 2016.01.29 M 7.2 Kamchatka
- 2016.01.24 M 7.1 Alaska
- 2015.11.09 M 6.2 Aleutians
- 2015.11.02 M 5.9 Aleutians
- 2015.11.02 M 5.9 Aleutians (update)
- 2015.07.27 M 6.9 Aleutians
- 2015.05.29 M 6.7 Alaska Peninsula
- 2015.05.29 M 6.7 Alaska Peninsula (animations)
- 1964.03.27 M 9.2 Good Friday
Alaska | Kamchatka | Kurile Earthquake Reports
General Overview
Earthquake Reports
- 2017.01.08 M 5.8 Arctic
Arctic
General Overview
Earthquake Reports
Social Media
Mw=6.1, NORTHERN ALASKA (Depth: 9 km), 2018/08/12 21:15:00 UTC – Full details here: https://t.co/5MGjW6asRG pic.twitter.com/2o7sjaY4rz
— Earthquakes (@geoscope_ipgp) August 12, 2018
Thirty minutes of ground motion data from seismic stations across Alaska. The red star is the epicenter, and the dots are stations. The animation includes two aftershocks, a M4.9 at 7:14 am and a M4.7 at 07:18. pic.twitter.com/Q7Wy0ikGRj
— AK Earthquake Center (@AKearthquake) August 12, 2018
M6.4 #earthquake in Alaska's Arctic National Wildlife Refuge (ANWR) this morning. A subset of Transportable Array stations show the data coming in. Close stations like C26K and C27K (also in ANWR) have a shorter signal because there was less time for different waves to separate. pic.twitter.com/HAzo8csMCw
— Dr. Kasey Aderhold (@kaseyaderhold) August 12, 2018
Ground shaking from the M6.1 #Alaska earthquake was easily recorded on NRCan seismic stations form coast to coast to coast (from Inuvik to Victoria to Halifax). The seismic surface waves only took ~20 minutes to travel to Nova Scotia.
CNSN seismic data:https://t.co/9tr7colMOx pic.twitter.com/6j3VToVNSA— John Cassidy (@earthquakeguy) August 12, 2018
Auto solution FMNEAR (Géoazur) with regional records for M 6.4 – 84km SW of Kaktovik, Alaska, 69.624°N 145.247°W (PDE USGS used to trigger inversion). pic.twitter.com/nLi29wjA70
— Bertrand Delouis (@BertrandDelouis) August 12, 2018
we also start testing automated slipmaps at Géoazur. Here the result for with regional records for M 6.4 – 84km SW of Kaktovik, Alaska, 69.624°N 145.247°W (PDE USGS used to trigger inversion), using the FM solution from FMNEAR previously twitted. EW plane selected as rupt plane. pic.twitter.com/Wvhh45rz1J
— Bertrand Delouis (@BertrandDelouis) August 12, 2018
M6.4 earthquake in northern #Alaska – details from the USGS:https://t.co/PYiuZCEdkB
No reports (yet) of this earthquake being felt in Canada – but well-recorded – see shaking at Inuvik, NT (480 km distant):https://t.co/5siks24kpL pic.twitter.com/S4bczTVIlm— John Cassidy (@earthquakeguy) August 12, 2018
Shallow, crustal earthquakes are extremely common throughout Alaska and do not indicate induced seismicity. The crustal, strike-slip mechanism for this quake aligns with previous earthquakes in the area and is completely consistent with a natural source.
— AK Earthquake Center (@AKearthquake) August 12, 2018
Another M6.4 earthquake in Alaska, just to the NNE of the one earlier this morning. These recordings of the shaking at Inuvik and #Victoria a few minutes ago.
More info:https://t.co/qtsreelS0Ohttps://t.co/J7zVk7ZSBj pic.twitter.com/BmM3SGvu5f— John Cassidy (@earthquakeguy) August 12, 2018
My @raspishake had a very clean catch of the M6.1 Kaktovik, Alaska EQ at 14:58:54 (7:48am PDT). The first waves (P-waves) from this strike-slip quake arrived at my station at 15:05:50. That ~7min travel time places the epicenter ~2450mi away, which Google Earth Confirms. pic.twitter.com/4xB9gajZkD
— Ryan Hollister (@phaneritic) August 12, 2018
M6.4 #Alaska #earthquake and aftershocks from USGS & EMSC with fault layer from Koehler etal. 2013 & Plafker 1994. Main epicenter w/some additional geological figures. pic.twitter.com/UViycnTrLt
— Sotiris Valkaniotis (@SotisValkan) August 12, 2018
Through our partnership with Alyeska, we have instruments at pump stations along the Trans Alaska Pipeline. Via Lea Gardine, this figure shows ground motion from the M6.4 quake as it traveled from the Beaufort Sea south to the Gulf of Alaska. pic.twitter.com/aAobIKt0q7
— AK Earthquake Center (@AKearthquake) August 12, 2018
A 6.4 magnitude earthquake has hit a remote part of Alaska. There have been no reports of injuries or damage. https://t.co/FmqKRefRjd pic.twitter.com/vgllmzXV8w
— CNN (@CNN) August 12, 2018
Strong 6.5 #earthquake #Terremoto #Temblor near Kaktovic #Alaska right now 🚨 pic.twitter.com/niaFDTcSja
— Teacher From PR 🌞🌊 (@MaestroDEPR) August 12, 2018
Here's a map from Helena's piece showing earthquakes in that region recorded since 1970. Altogether we've recorded around 4,500 earthquakes up there. We've picked up 16 aftershocks from the M6.4 so far today, but manual scans and other analysis will find more. pic.twitter.com/Xin0OB8k0V
— AK Earthquake Center (@AKearthquake) August 12, 2018
Seismo Blog: When on Sunday morning shortly before 7 am local time, the citizens of Fairbanks in Alaska awoke to noticeable ground shaking, many of them thought these seismic waves were coming from the south… https://t.co/Aijoz6JYDh pic.twitter.com/EkS0WWo7oe
— Berkeley Seismo Lab (@BerkeleySeismo) August 13, 2018
- Cox, G.M., Strauss, J.V>, Hlaverson, G.P., Schmitz, M.D., McClelland, W.C., Stenenson, R.S., and Macdonald, F.A., 2015. Kikiktat volcanics of Arctic Alaska—Melting of harzburgitic mantle associated with the Franklin large igneous province in Lithosphere, v. 7, no. 3, p. 275-295.
- Koehler, R.D., Burns, P.A.C., and Weakland, J.R., 2013. Digitized faults of the Neotectonic map of Alaska (Plafker and others, 1994): Miscellaneous Publication MP 150, Alaska Division of Geological & Geophysical Surveys, Fairbanks, AK, USA.
- O’Sullivan, P.B., and Wallace, W.K., 2012. Out-of-sequence, basement-involved structures in the Sadlerochit Mountains region of the Arctic National Wildlife Refuge, Alaska: Evidence and implications from fission-track thermochronology in GSA Bulletin, v. 114, no. 11, p. 1356-1378
- Wheeler, J.O., Hoffman, P.F., Card, K.D., Davidson, A., Sanford, B.V., Okulitch, A.V., and Roest, W.R. (comp.) 1997. Geological Map of Canada, Geological Survey of Canada, Map D1860A.
Great post w details as well as background. I’m a structural geologist from way back, and in the So. CAN Rocky Mtns I was lucky enough to map a thrust fault transition ramp (McConnell to Bourgeau thrusts near Mount Baldy I think). While I didn’t get the chance to disect its mechanism (perhaps Margo McMechan or Larry Lane have), what I’m saying is that transverse motion is not unexpected in thrust terraces. See my abstracts in bottom paper in http://www.zolnai.ca/old/news.htm