There was an earthquake last night (local time) in Berkeley, aligned with the Hayward fault. The Hayward fault is one of the synthetic sister faults to the San Andreas fault, the major player in the dextral (right-lateral, strike-slip) plate boundary between the Pacific plate and the North America plate to the east.
Over 35,000 people have reported their observations on the USGS “Did You Feel It?” website for this earthquake. If you live in this region, please visit this website and register your observations!
The San Andreas fault is a right-lateral strike-slip transform plate boundary between the Pacific and North America plates. The plate boundary is composed of faults that are parallel to sub-parallel to the SAF and extend from the west coast of CA to the Wasatch fault (WF) system in central Utah (the WF runs through Salt Lake City and is expressed by the mountain range on the east side of the basin that Salt Lake City is built within).
About 75% of the relative plate motion is accommodated along the SAF and its synthetic sister faults in the northern CA region. The rest of the plate boundary motion is accommodated along the Eastern CA shear zone and Walker Lane, along with the Central Nevada Seismic Belt, and the Wasatch fault systems. In Northern CA, there is about 33-37 mm/yr strain accumulated on the SAF plate boundary system. About 18-25 mm/yr is on the SAF, 8-11 mm/yr on the MF, and 5-7 mm/yr on the Bartlett Springs fault system (Geist and Andrews, 2000).
The three main faults in the region north of San Francisco are the SAF, the Hayward fault (HF), and the Calaveras fault (CF). However, there are several others that pose a risk to the inhabitants here. Most of the faults in the region are right-lateral strike-slip faults, just like the SAF.
- Below are the USGS websites for the earthquakes in this region (mostly associated with the Hayward fault).
- M 4.4 – 3km ESE of Berkeley, CA
2018-01-04 10:39:37 UTC 37.861°N 122.242°W 13.0 km depth
https://earthquake.usgs.gov/earthquakes/eventpage/nc72948801#executive - M 4.3 – San Francisco Bay area, California
1984-03-27 03:36:35 UTC 37.741°N 122.121°W 7.0 km depth
https://earthquake.usgs.gov/earthquakes/eventpage/nc1113184#executive - M 4.0 – San Francisco Bay area, California
1987-05-11 06:45:47 UTC 37.809°N 122.187°W 4.4 km depth
https://earthquake.usgs.gov/earthquakes/eventpage/nc100229#executive - M 4.0 – San Francisco Bay area, California
1994-06-26 08:42:50 UTC 37.915°N 122.285°W 6.1 km depth
https://earthquake.usgs.gov/earthquakes/eventpage/nc30051723#executive - M 4.0 – San Francisco Bay area, California
2003-09-05 01:39:53 UTC 37.843°N 122.223°W 11.0 km depth
https://earthquake.usgs.gov/earthquakes/eventpage/nc21305648#executive - M 4.2 – San Francisco Bay area, California
2007-07-20 11:42:22 UTC 37.804°N 122.193°W 5.3 km depth
https://earthquake.usgs.gov/earthquakes/eventpage/nc40199209#executive - M 6.0 – South Napa
2014-08-24 10:20:44 UTC 38.215°N 122.312°W 11.1 km depth
https://earthquake.usgs.gov/earthquakes/eventpage/nc72282711#executive - M 4.0 – 1km N of Piedmont, California
2015-08-17 13:49:17 UTC 37.837°N 122.232°W 4.7 km depth
https://earthquake.usgs.gov/earthquakes/eventpage/nc72507396#executive - Here are some other reports on this earthquake.
- Berkeley Seismo Lab
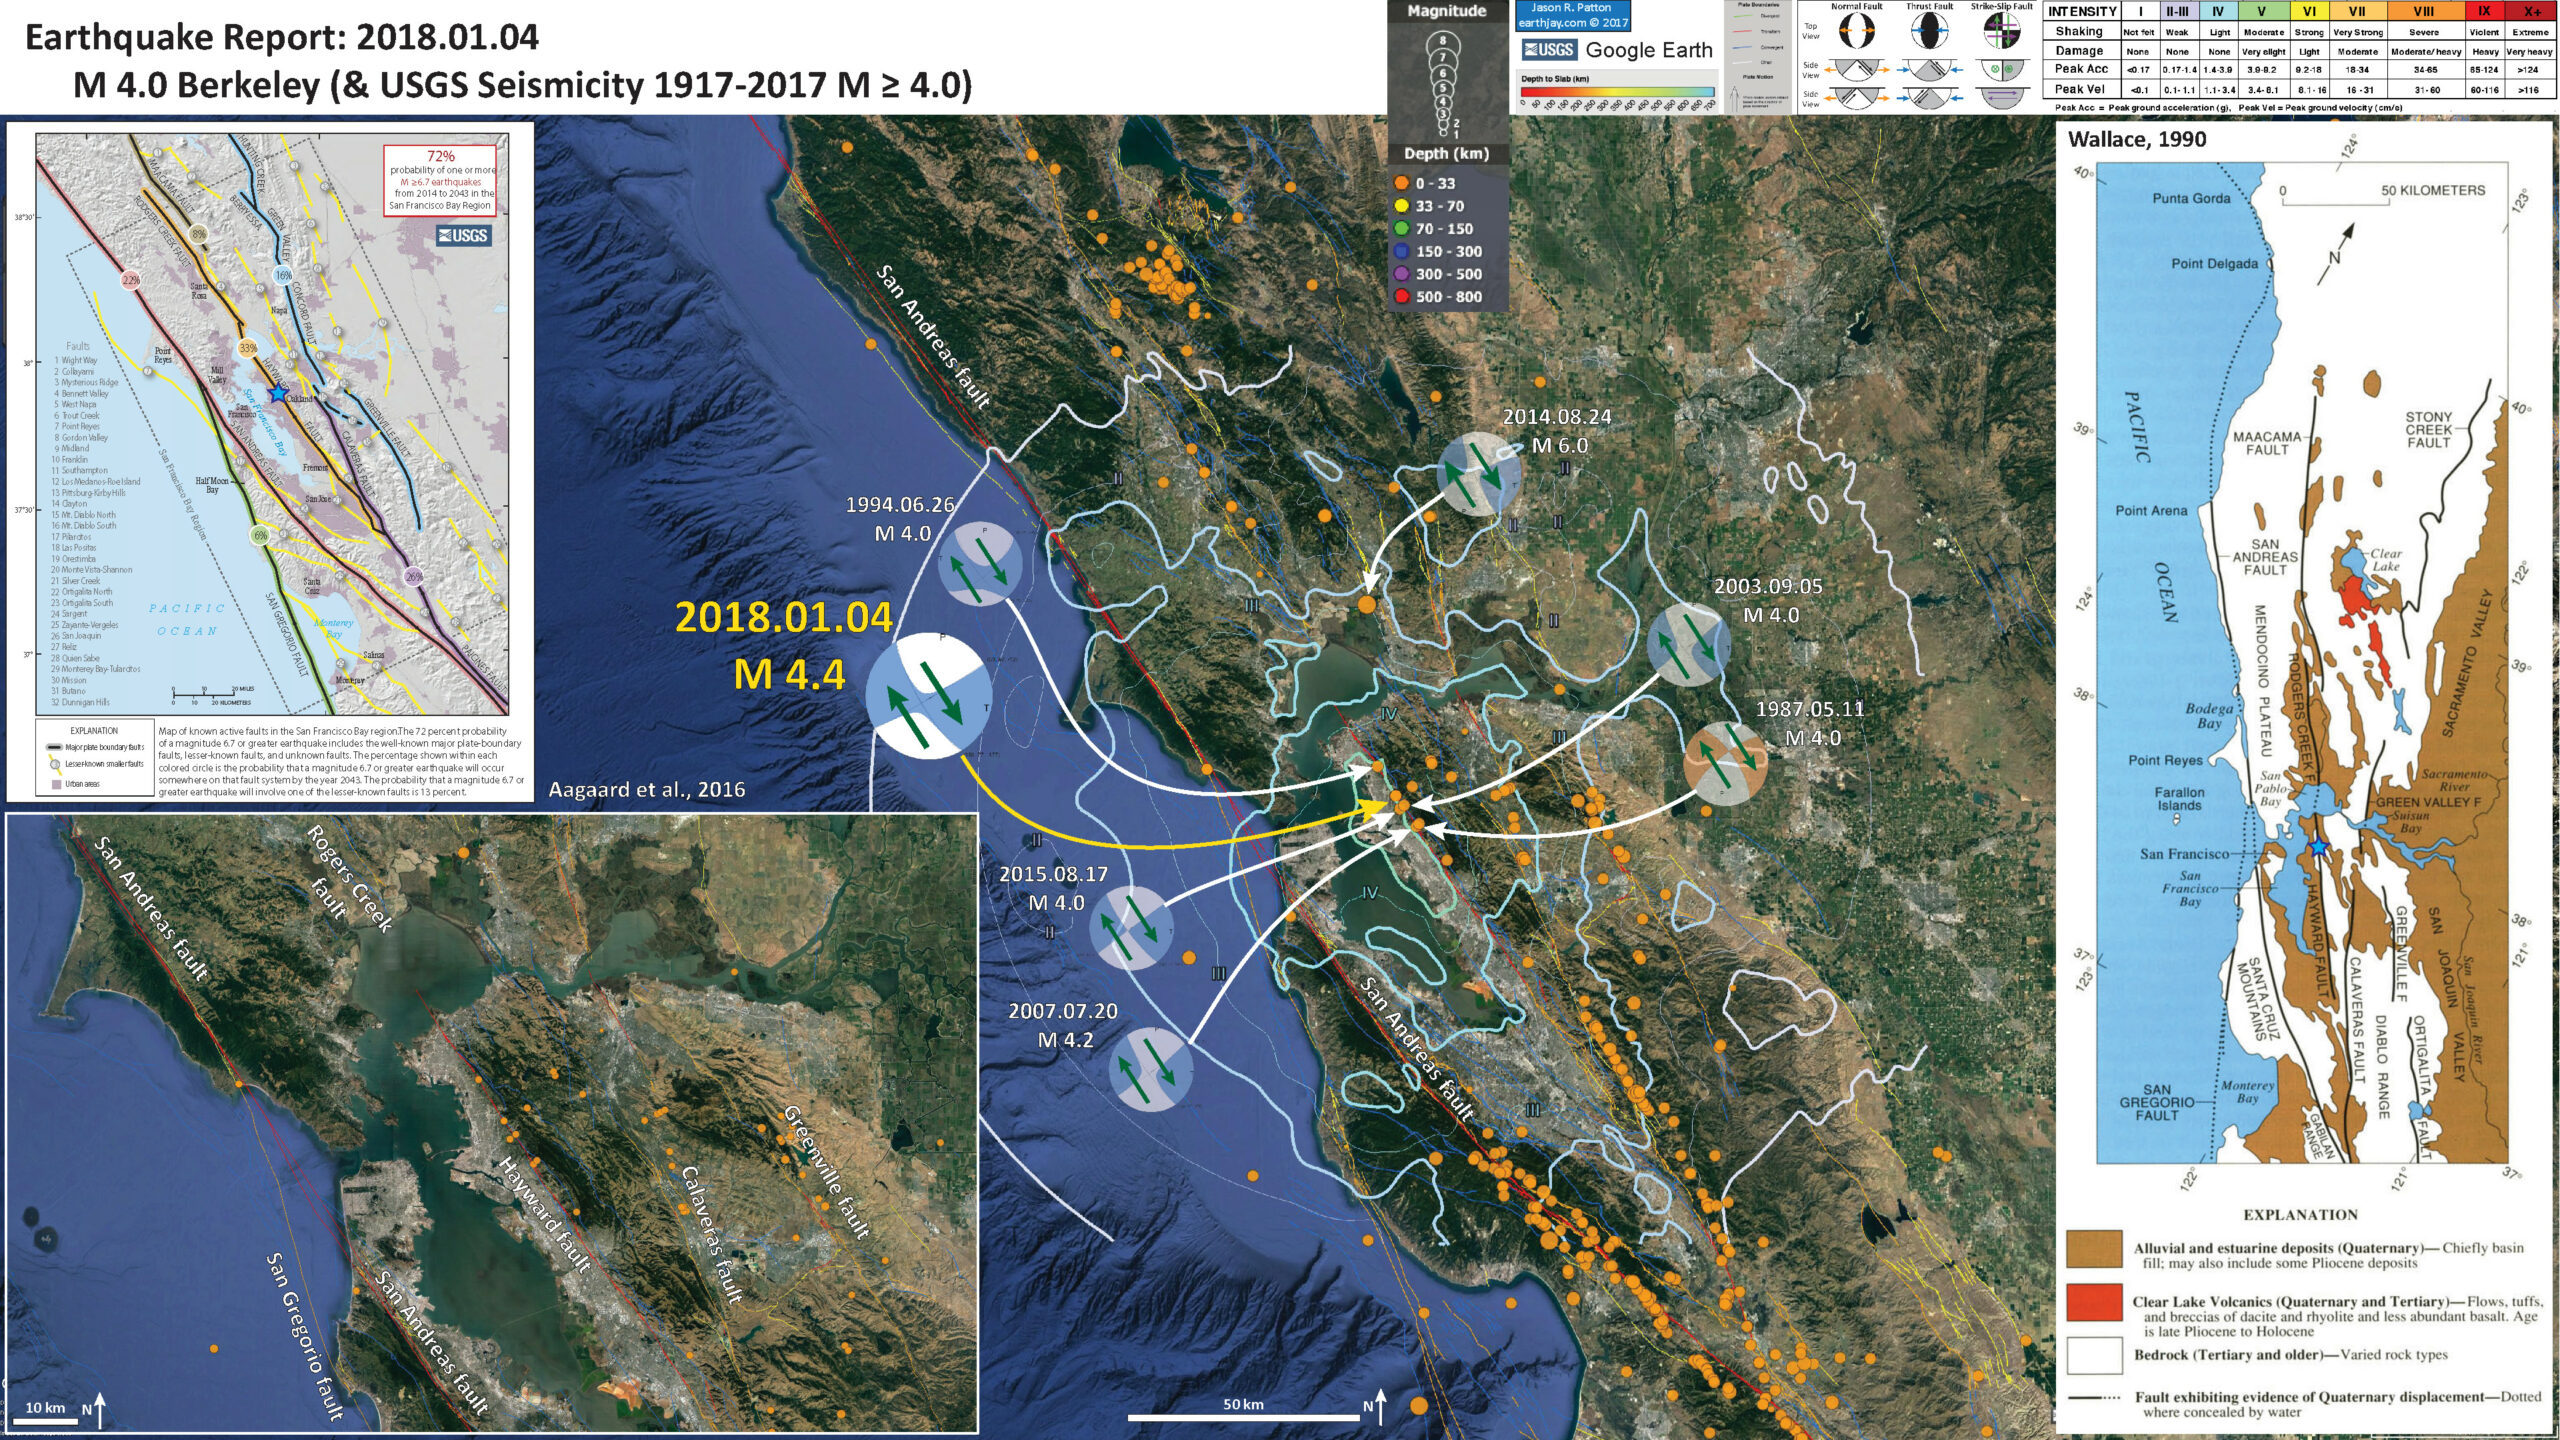
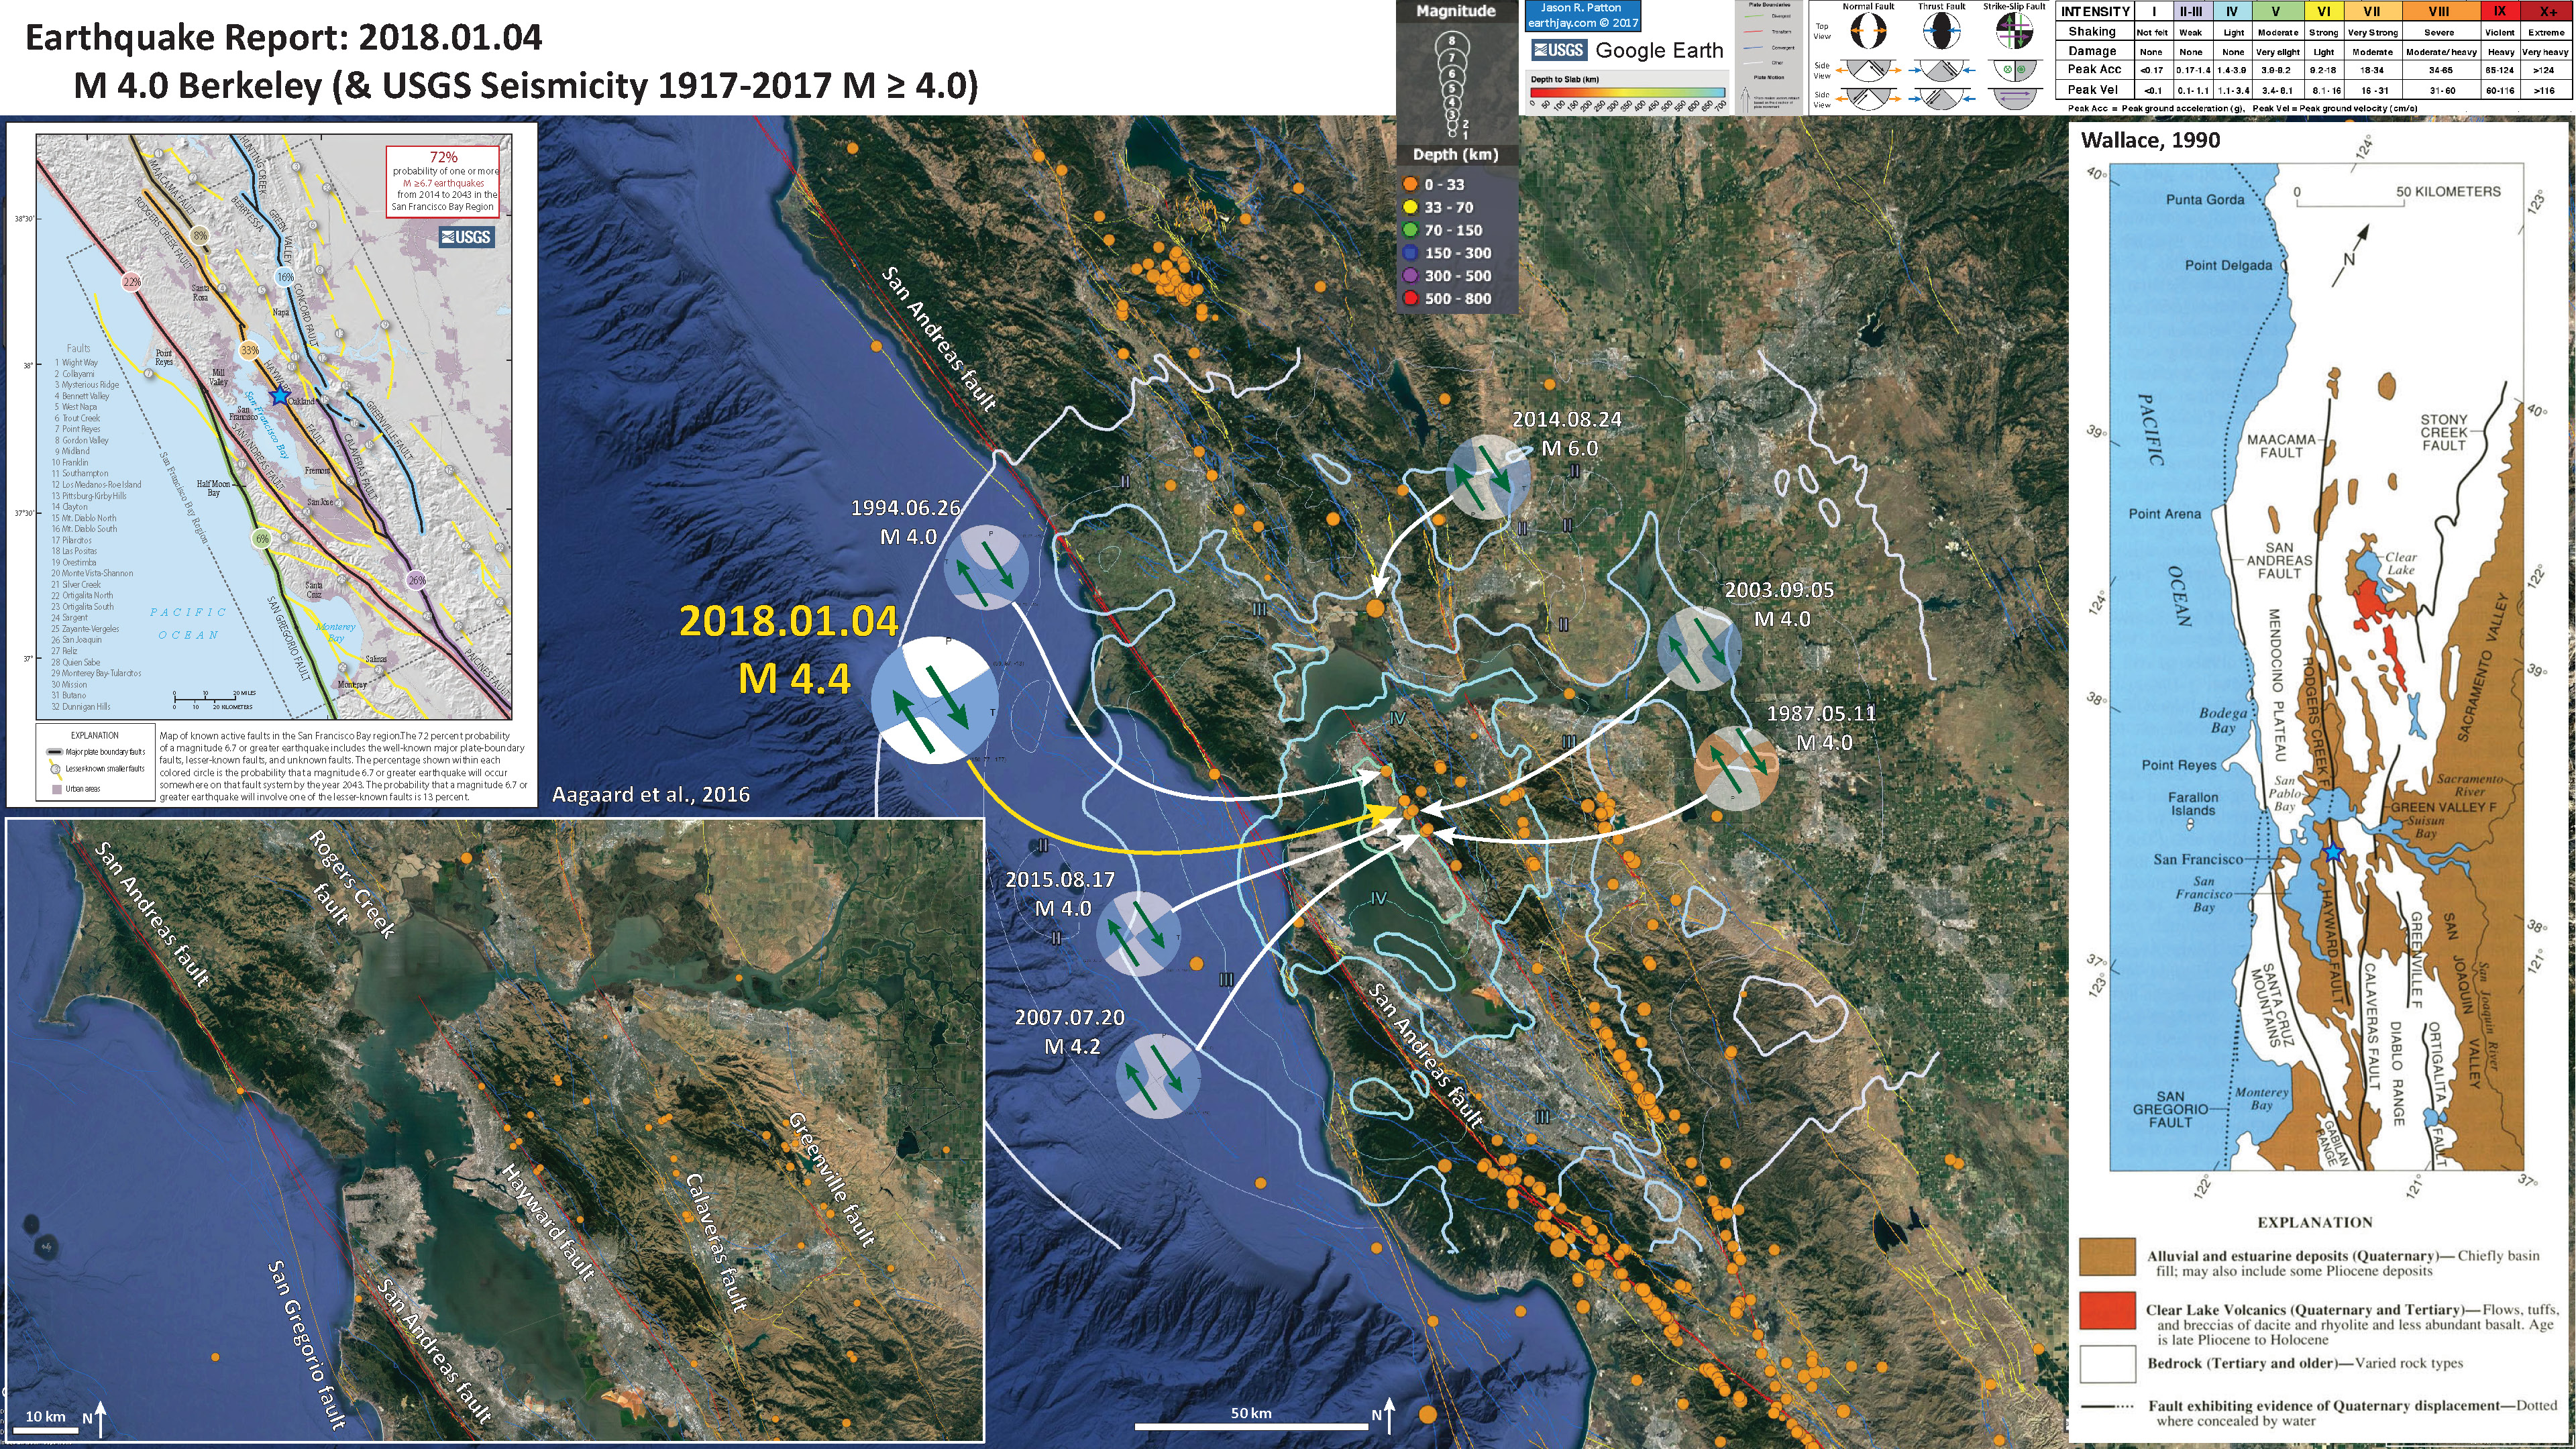
Below is my interpretive poster for this earthquake:
I plot the seismicity from the past month, with color representing depth and diameter representing magnitude (see legend). I include earthquake epicenters from 1917-2017 with magnitudes M > 4.0.
I use the USGS Quaternary fault and fold database for the faults.
I plot the USGS fault plane solutions (moment tensors in blue,focal mechanisms in orange) for some relevant historic earthquakes.
- I placed a moment tensor / focal mechanism legend on the poster. There is more material from the USGS web sites about moment tensors and focal mechanisms (the beach ball symbols). Both moment tensors and focal mechanisms are solutions to seismologic data that reveal two possible interpretations for fault orientation and sense of motion. One must use other information, like the regional tectonics, to interpret which of the two possibilities is more likely. Based upon the tectonics associated with the San Andreas and Hayward faults, I interpret this M 4.4 earthquake to be a right-lateral strike-slip fault.
- I also include the shaking intensity contours on the map. These use the Modified Mercalli Intensity Scale (MMI; see the legend on the map). This is based upon a computer model estimate of ground motions, different from the “Did You Feel It?” estimate of ground motions that is actually based on real observations. The MMI is a qualitative measure of shaking intensity. More on the MMI scale can be found here and here. This is based upon a computer model estimate of ground motions, different from the “Did You Feel It?” estimate of ground motions that is actually based on real observations.
-
I include some inset figures.
- On the right, I include generalized fault map of northern California from Wallace (1990). I place a blue star in the general location of today’s M 4.4 earthquake.
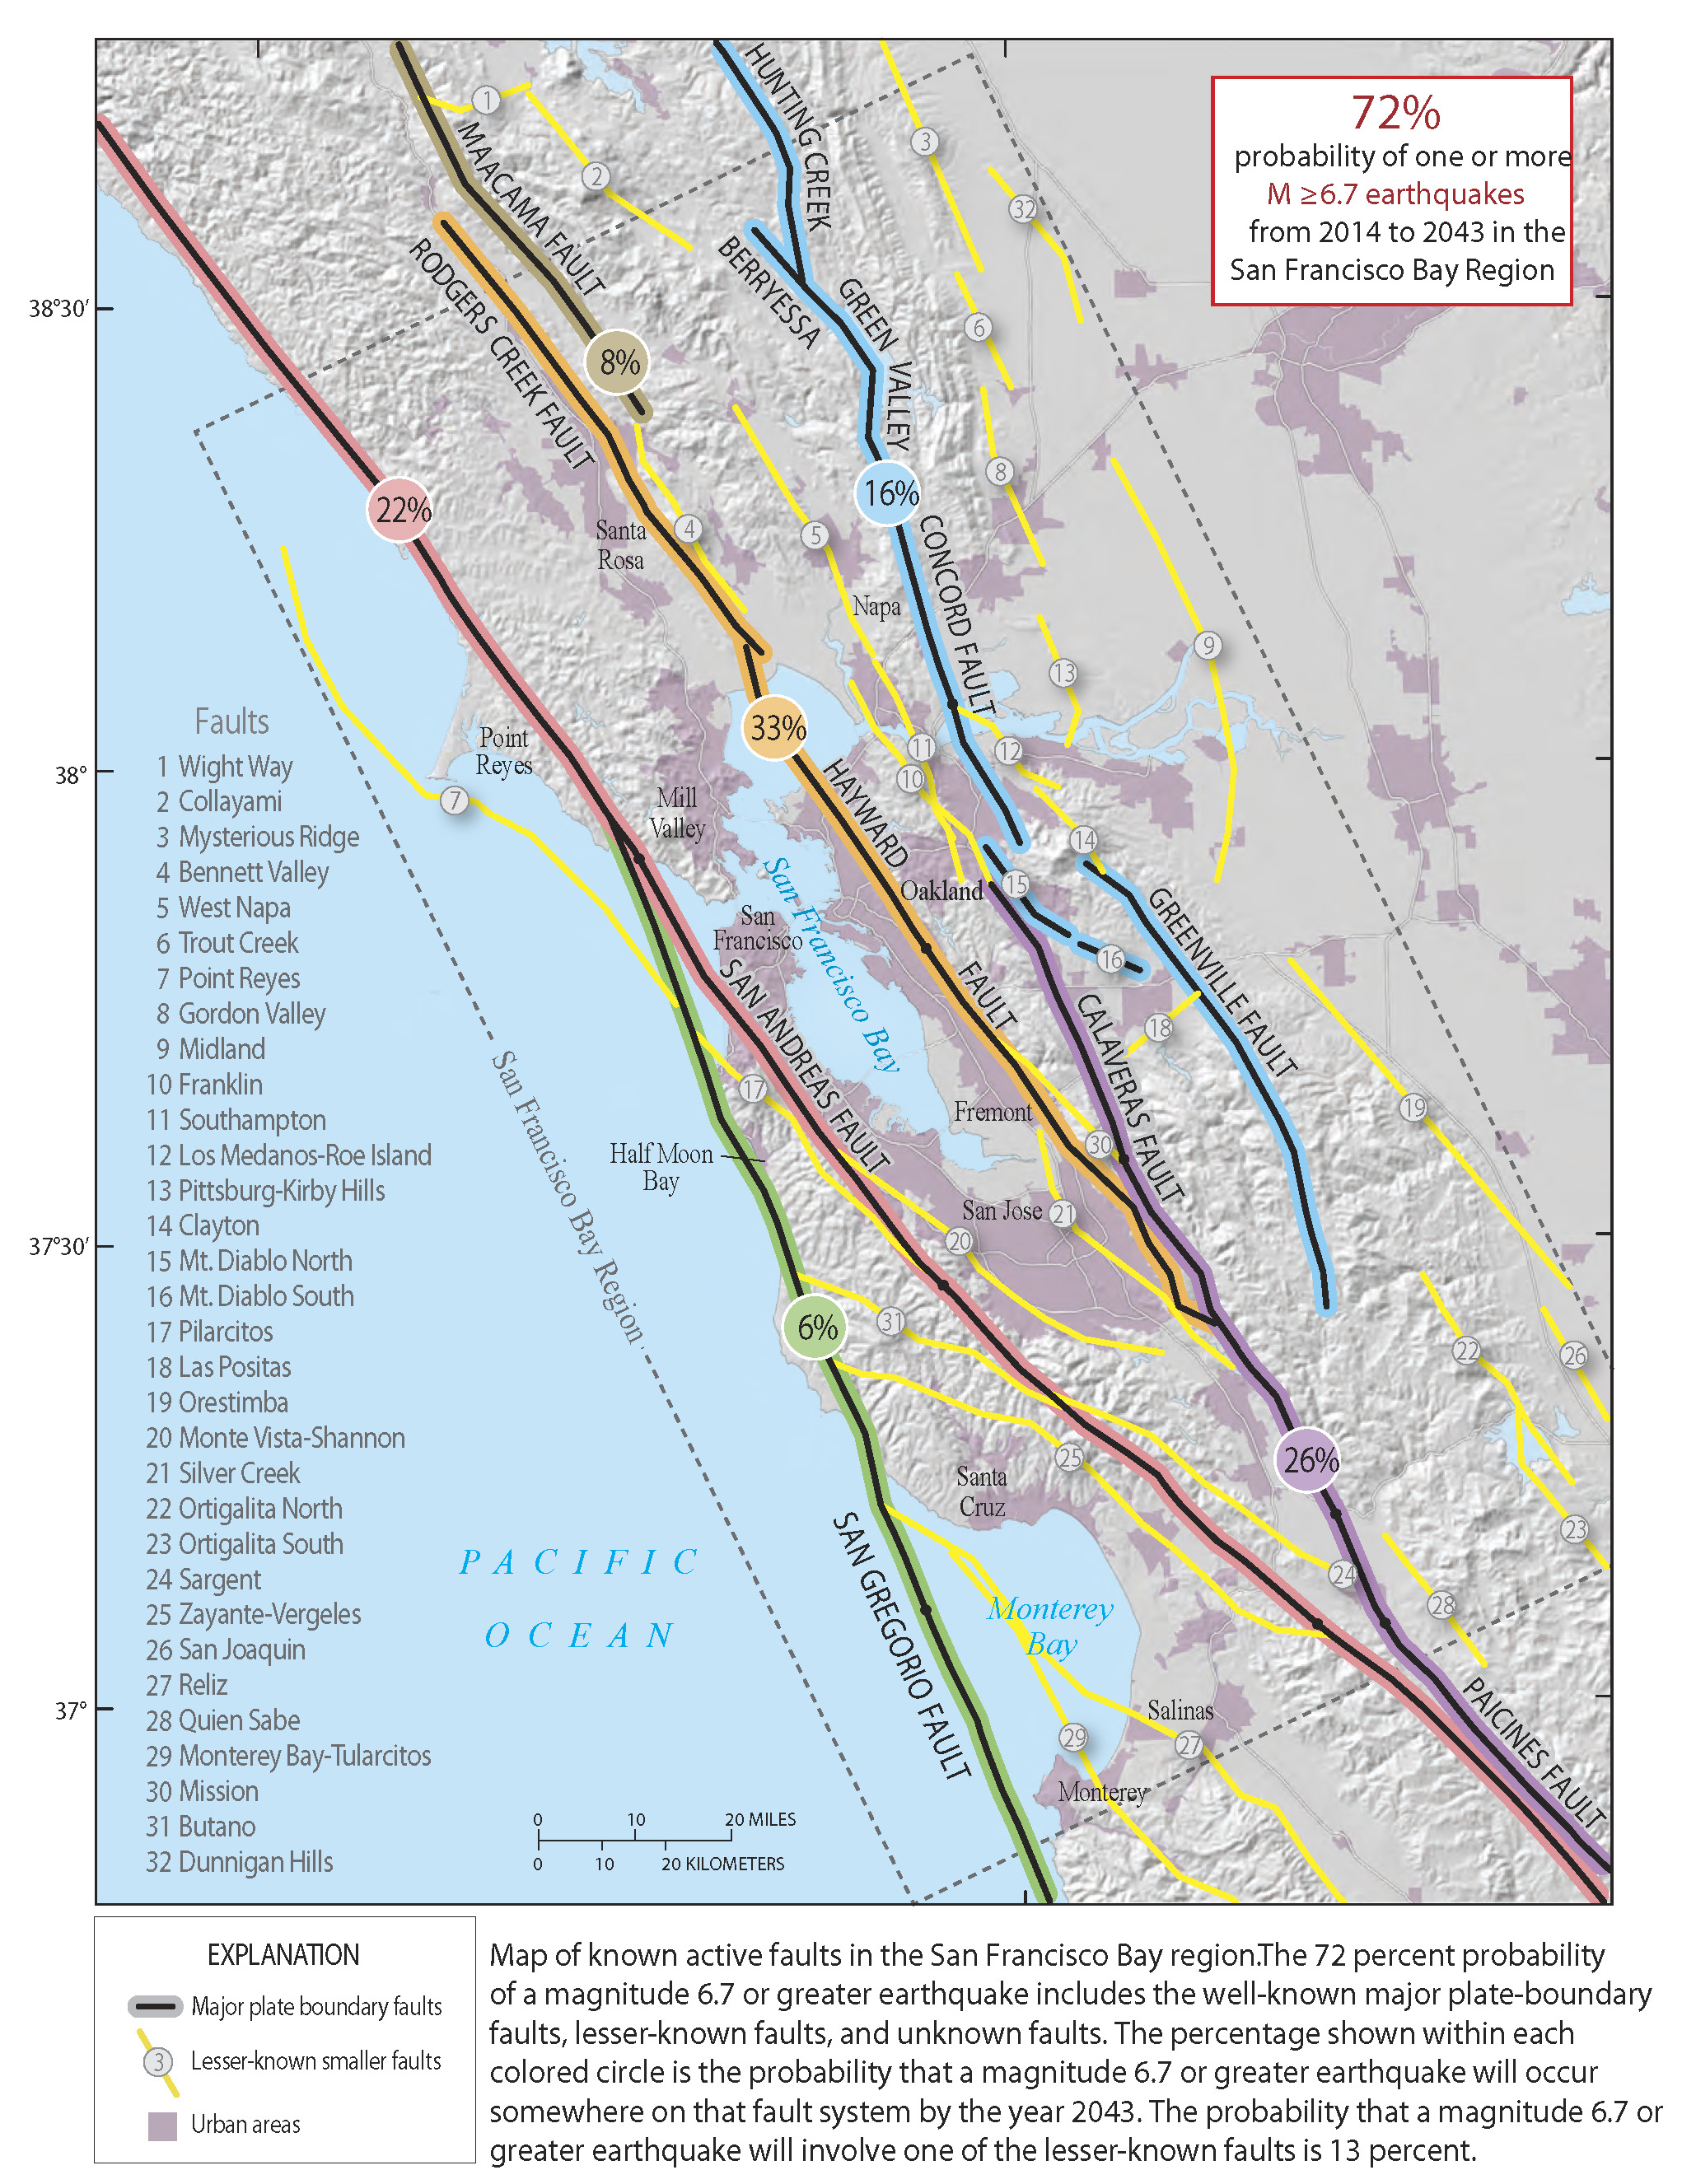
- In the upper left corner is a map from Aagaard et al. (2016) that shows the probability (chance of) an earthquake along various faults for the next 30 years or so. Note that the HF has the highest likelihood of generating an earthquake with magnitude M ≥ 6.7.
- In the lower left corner I include a larger scale map showing the details of the mapped faults.
- Here are some social media posts about this earthquake. RT does not imply endorsement. ;-)
Creepmeter & tiltmeter data show the #earthquake. Looks like there was a creep event at COZ (Oakland Zoo) south of the epicentral region (near CTM) prior to the EQ? Hard to see on the automatic plots; red rate change line is on the page and not my annotation. pic.twitter.com/T4FrrdSTlv
— Danielle Madugo (@DanielleVerdugo) January 4, 2018
Using @USGS data, this plot shows there was a ~ 0.1mm creep event at the Oakland Zoo (COZ) creepmeter ~ 5 hours prior to the Berkeley #earthquake this early morning! Both the COZ & CTM (the closest creepmeter to the epicenter) appear to register the temblor and creep events! pic.twitter.com/YJHXK6E3ht
— Danielle Madugo (@DanielleVerdugo) January 4, 2018
Updated version of Hayward Fault locking map from Manoo @shirzaei similar to his 2013 paper with today’s M4.4 as large green circle at edge of locked patch. My previous tweet was incorrect. Yellow and white is locked part of fault. Red is creeping. pic.twitter.com/jX1rRObmHr
— Eric Fielding (@EricFielding) January 4, 2018
LA Times article about the earthquake by @ronlin : Magnitude 4.5 earthquake rumbles across Bay Area but no damage reported https://t.co/Gv1gHDGXtL
— Tim Dawson (@timblor) January 4, 2018
Incredible #Berkeley #earthquake data being provided by #citizenscience from the @MyShakeApp. Thank you – download the app. pic.twitter.com/BuURhlg607
— Richard Allen (@RAllenQuakes) January 4, 2018
Seismograms showing today's M4.4 Berkeley area quake recorded at our Bay Area seismic stations. pic.twitter.com/rOKhYEQnML
— Berkeley Seismo Lab (@BerkeleySeismo) January 4, 2018
— temblor (@temblor) January 4, 2018
UPDATE: 2018.01.10
What Your Fitbit and Smartphone Saw During That 4.4 Quake https://t.co/GZhjAOhHMy pic.twitter.com/np2bqJfmiw
— KQED (@KQED) January 11, 2018
More about the background seismotectonics
- I place a map shows the configuration of faults in central (San Francisco) and northern (Point Delgada – Punta Gorda) CA (Wallace, 1990). Here is the caption for this map, that is on the lower left corner of my map. Below the citation is this map presented on its own.
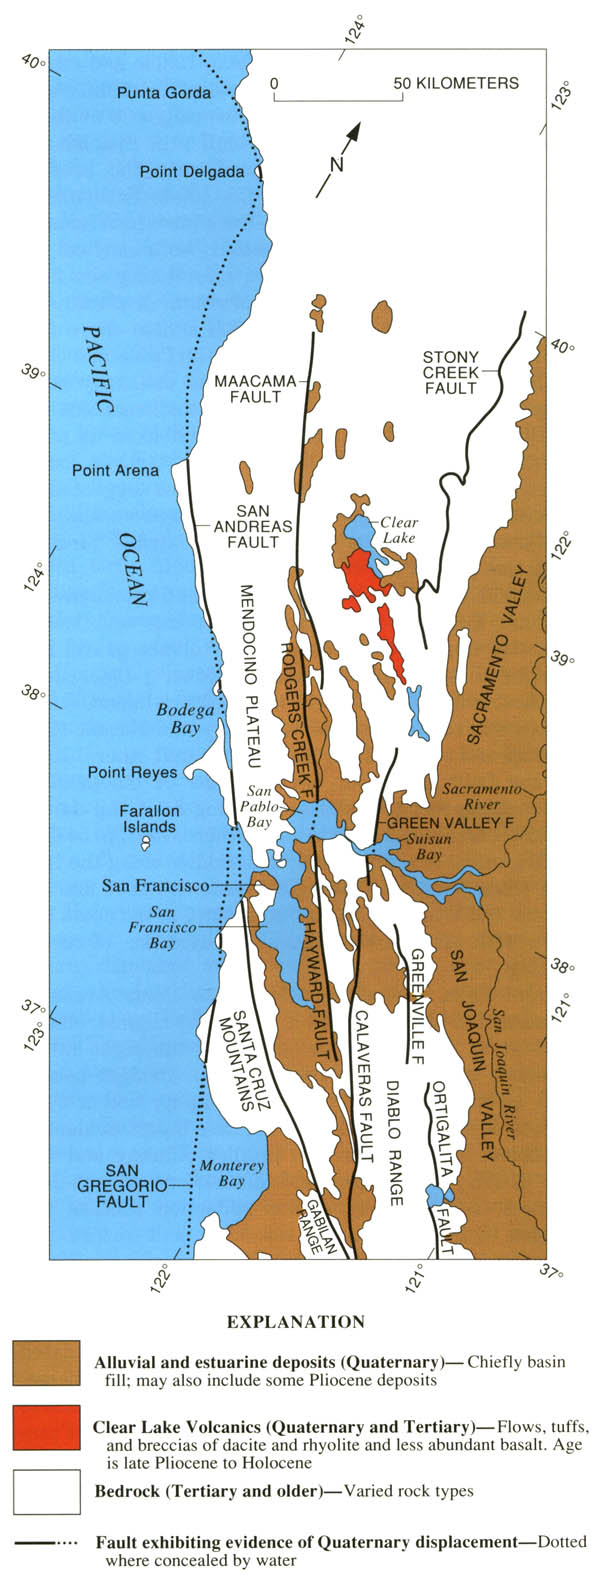
Geologic sketch map of the northern Coast Ranges, central California, showing faults with Quaternary activity and basin deposits in northern section of the San Andreas fault system. Fault patterns are generalized, and only major faults are shown. Several Quaternary basins are fault bounded and aligned parallel to strike-slip faults, a relation most apparent along the Hayward-Rodgers Creek-Maacama fault trend.
- Here is a map from McLaughlin et al. (2012) that shows the regional faulting. I include the figure caption as a blockquote below.
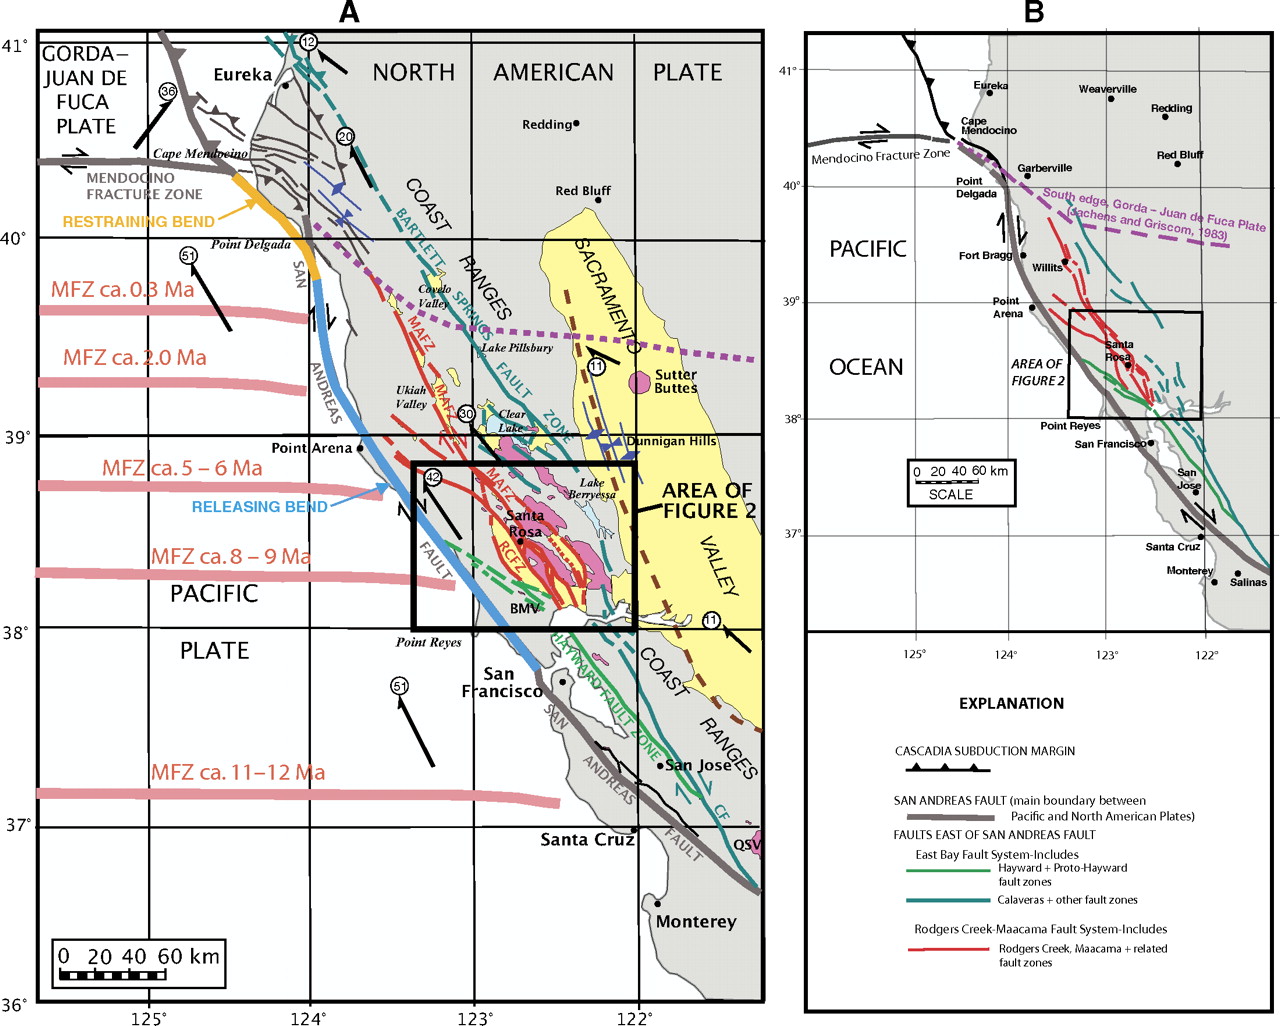
Maps showing the regional setting of the Rodgers Creek–Maacama fault system and the San Andreas fault in northern California. (A) The Maacama (MAFZ) and Rodgers Creek (RCFZ) fault zones and related faults (dark red) are compared to the San Andreas fault, former and present positions of the Mendocino Fracture Zone (MFZ; light red, offshore), and other structural features of northern California. Other faults east of the San Andreas fault that are part of the wide transform margin are collectively referred to as the East Bay fault system and include the Hayward and proto-Hayward fault zones (green) and the Calaveras (CF), Bartlett Springs, and several other faults (teal). Fold axes (dark blue) delineate features associated with compression along the northern and eastern sides of the Coast Ranges. Dashed brown line marks inferred location of the buried tip of an east-directed tectonic wedge system along the boundary between the Coast Ranges and Great Valley (Wentworth et al., 1984; Wentworth and Zoback, 1990). Dotted purple line shows the underthrust south edge of the Gorda–Juan de Fuca plate, based on gravity and aeromagnetic data (Jachens and Griscom, 1983). Late Cenozoic volcanic rocks are shown in pink; structural basins associated with strike-slip faulting and Sacramento Valley are shown in yellow. Motions of major fault blocks and plates relative to fi xed North America, from global positioning system and paleomagnetic studies (Argus and Gordon, 2001; Wells and Simpson, 2001; U.S. Geological Survey, 2010), shown with thick black arrows; circled numbers denote rate (in mm/yr). Restraining bend segment of the northern San Andreas fault is shown in orange; releasing bend segment is in light blue. Additional abbreviations: BMV—Burdell Mountain Volcanics; QSV—Quien Sabe Volcanics. (B) Simplifi ed map of color-coded faults in A, delineating the principal fault systems and zones referred to in this paper.
- Here is the figure showing the evolution of the SAF since its inception about 29 Ma. I include the USGS figure caption below as a blockquote.
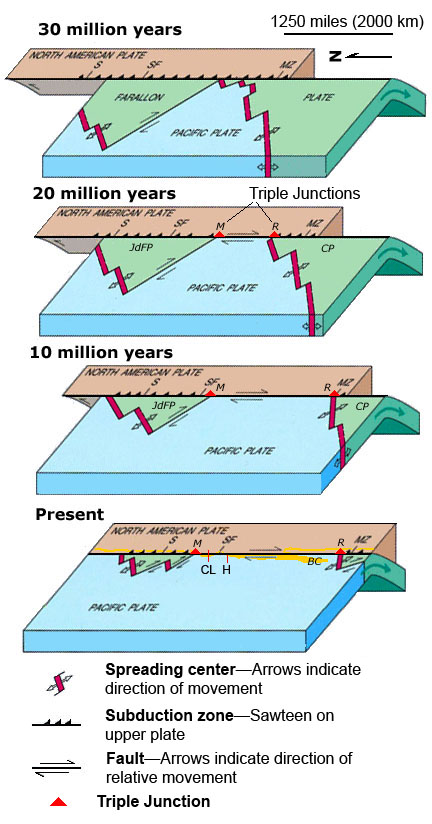
EVOLUTION OF THE SAN ANDREAS FAULT.
This series of block diagrams shows how the subduction zone along the west coast of North America transformed into the San Andreas Fault from 30 million years ago to the present. Starting at 30 million years ago, the westward- moving North American Plate began to override the spreading ridge between the Farallon Plate and the Pacific Plate. This action divided the Farallon Plate into two smaller plates, the northern Juan de Fuca Plate (JdFP) and the southern Cocos Plate (CP). By 20 million years ago, two triple junctions began to migrate north and south along the western margin of the West Coast. (Triple junctions are intersections between three tectonic plates; shown as red triangles in the diagrams.) The change in plate configuration as the North American Plate began to encounter the Pacific Plate resulted in the formation of the San Andreas Fault. The northern Mendicino Triple Junction (M) migrated through the San Francisco Bay region roughly 12 to 5 million years ago and is presently located off the coast of northern California, roughly midway between San Francisco (SF) and Seattle (S). The Mendicino Triple Junction represents the intersection of the North American, Pacific, and Juan de Fuca Plates. The southern Rivera Triple Junction (R) is presently located in the Pacific Ocean between Baja California (BC) and Manzanillo, Mexico (MZ). Evidence of the migration of the Mendicino Triple Junction northward through the San Francisco Bay region is preserved as a series of volcanic centers that grow progressively younger toward the north. Volcanic rocks in the Hollister region are roughly 12 million years old whereas the volcanic rocks in the Sonoma-Clear Lake region north of San Francisco Bay range from only few million to as little as 10,000 years old. Both of these volcanic areas and older volcanic rocks in the region are offset by the modern regional fault system. (Image modified after original illustration by Irwin, 1990 and Stoffer, 2006.)
- Here is a map that shows the shaking potential for earthquakes in CA. This comes from the state of California here.
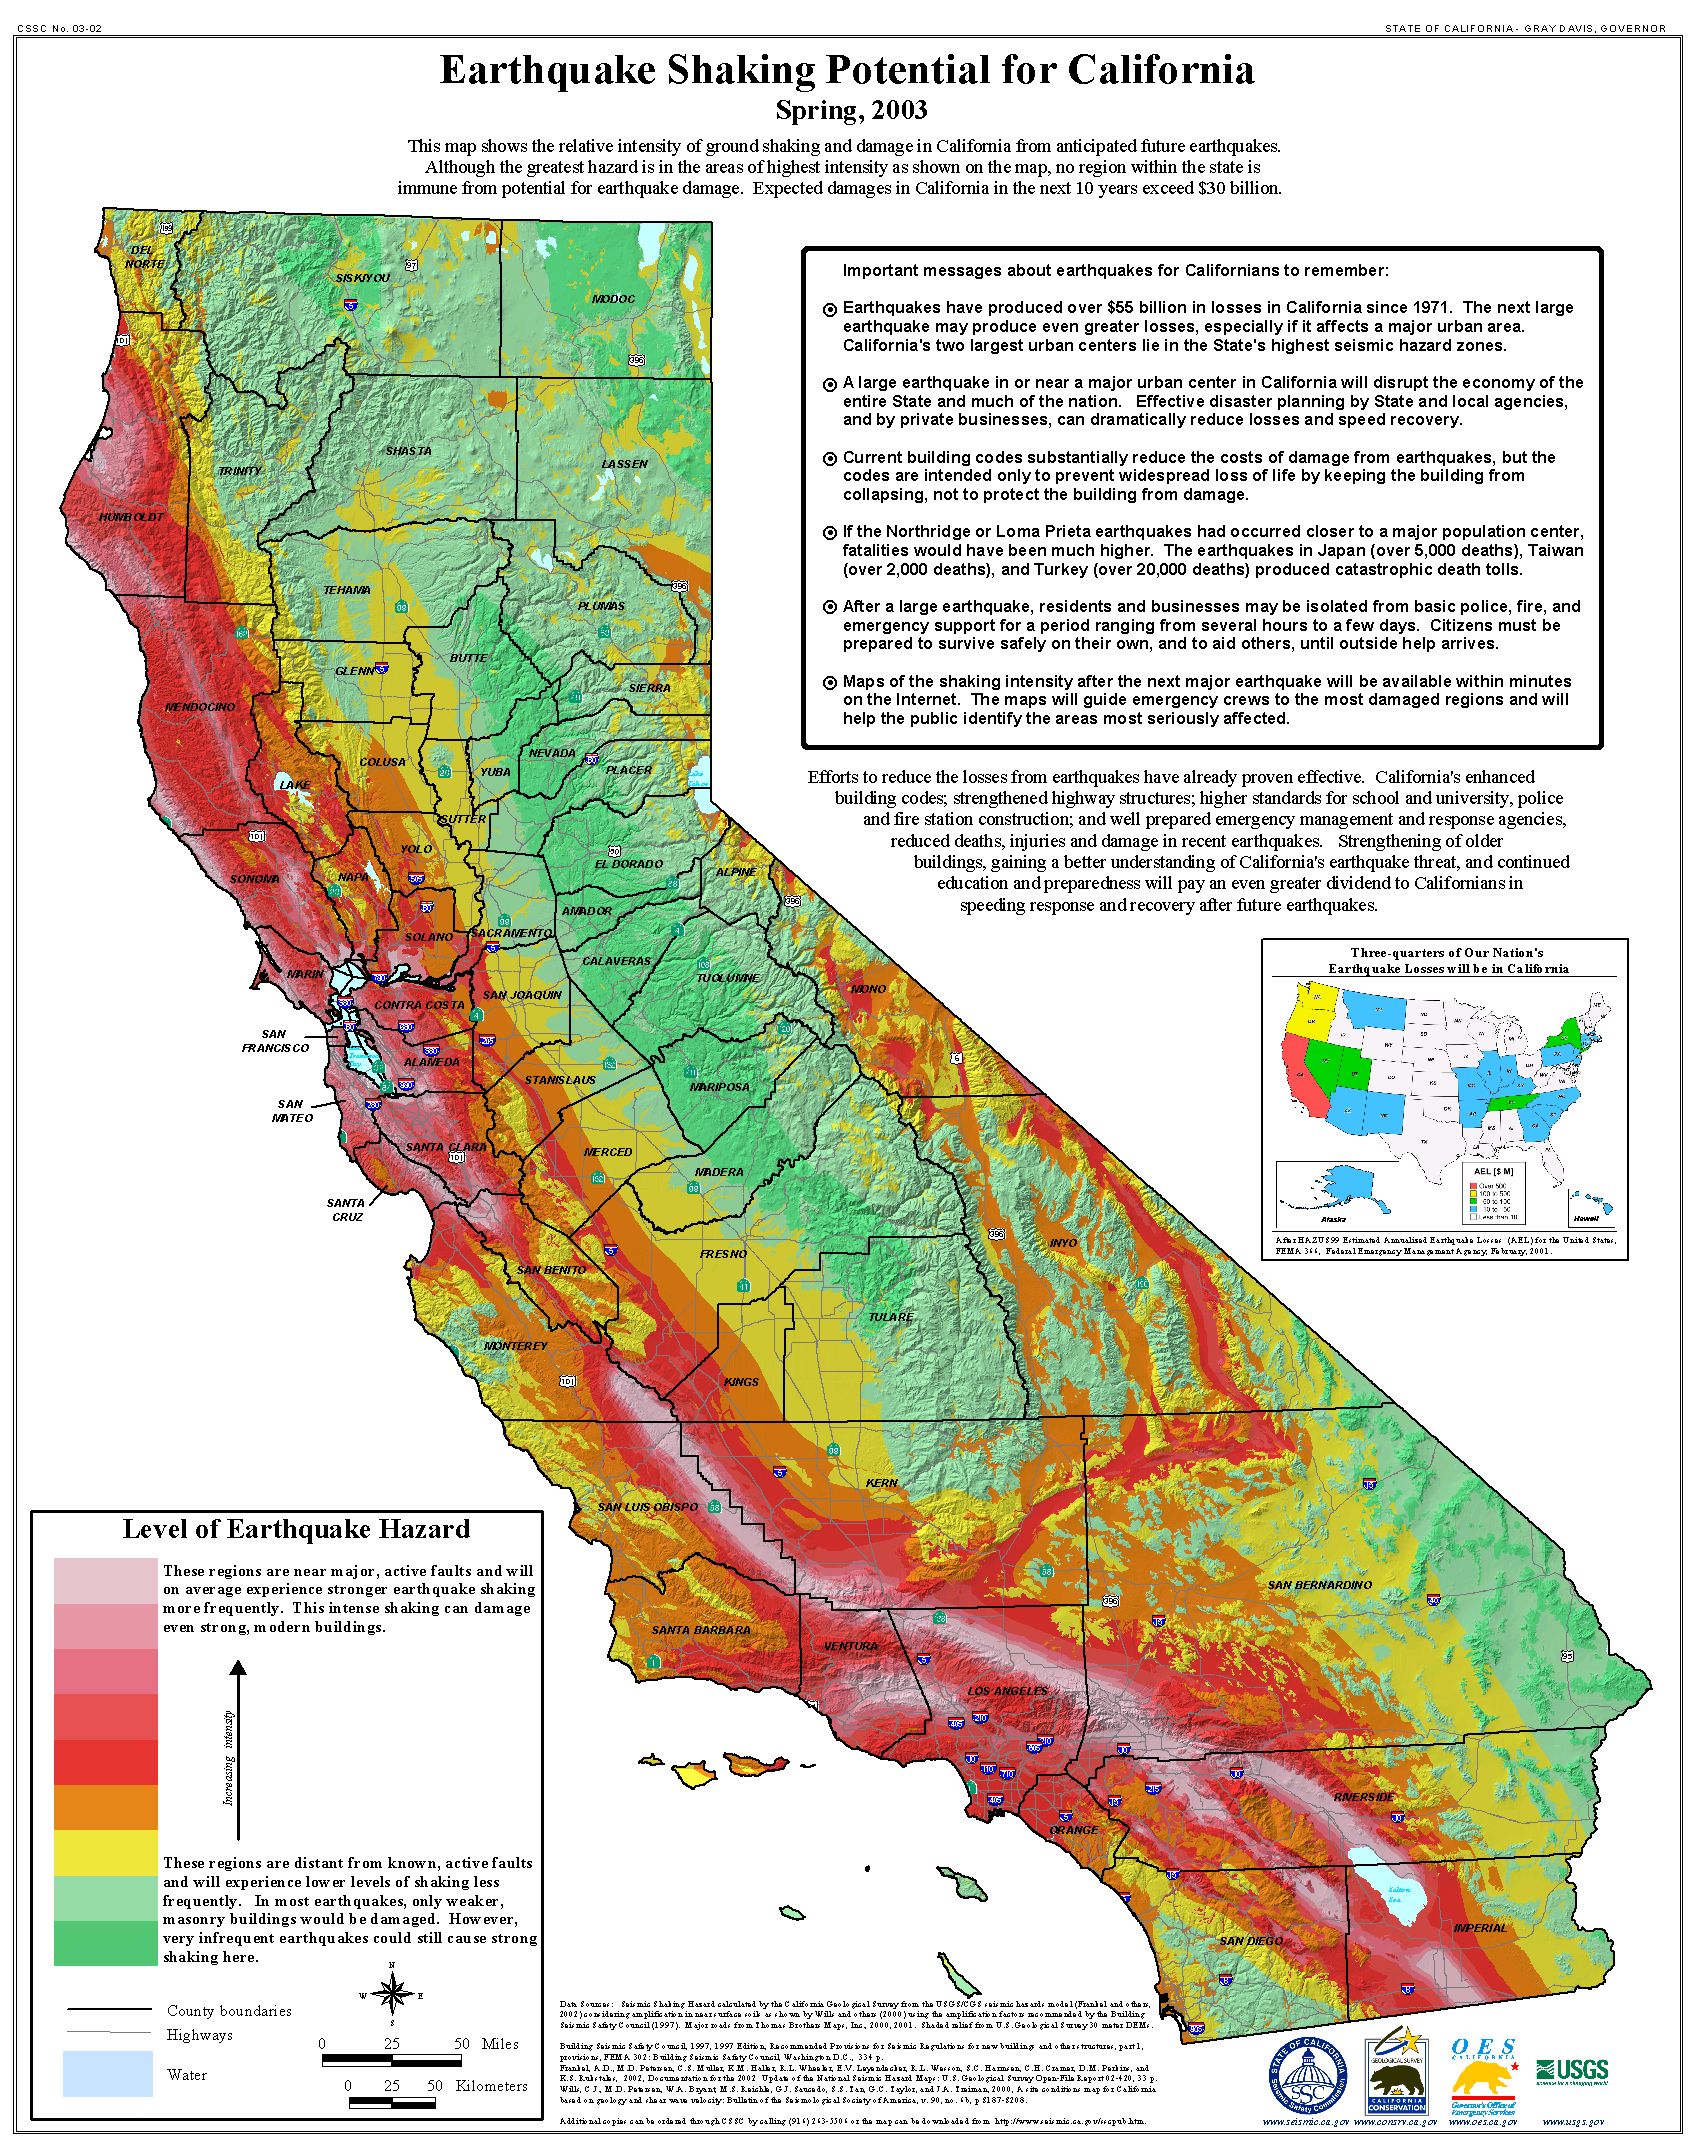
Earthquake shaking hazards are calculated by projecting earthquake rates based on earthquake history and fault slip rates, the same data used for calculating earthquake probabilities. New fault parameters have been developed for these calculations and are included in the report of the Working Group on California Earthquake Probabilities. Calculations of earthquake shaking hazard for California are part of a cooperative project between USGS and CGS, and are part of the National Seismic Hazard Maps. CGS Map Sheet 48 (revised 2008) shows potential seismic shaking based on National Seismic Hazard Map calculations plus amplification of seismic shaking due to the near surface soils.
- Here is the earthquake probability map for the SF Bay area (Aagard et al., 2016).
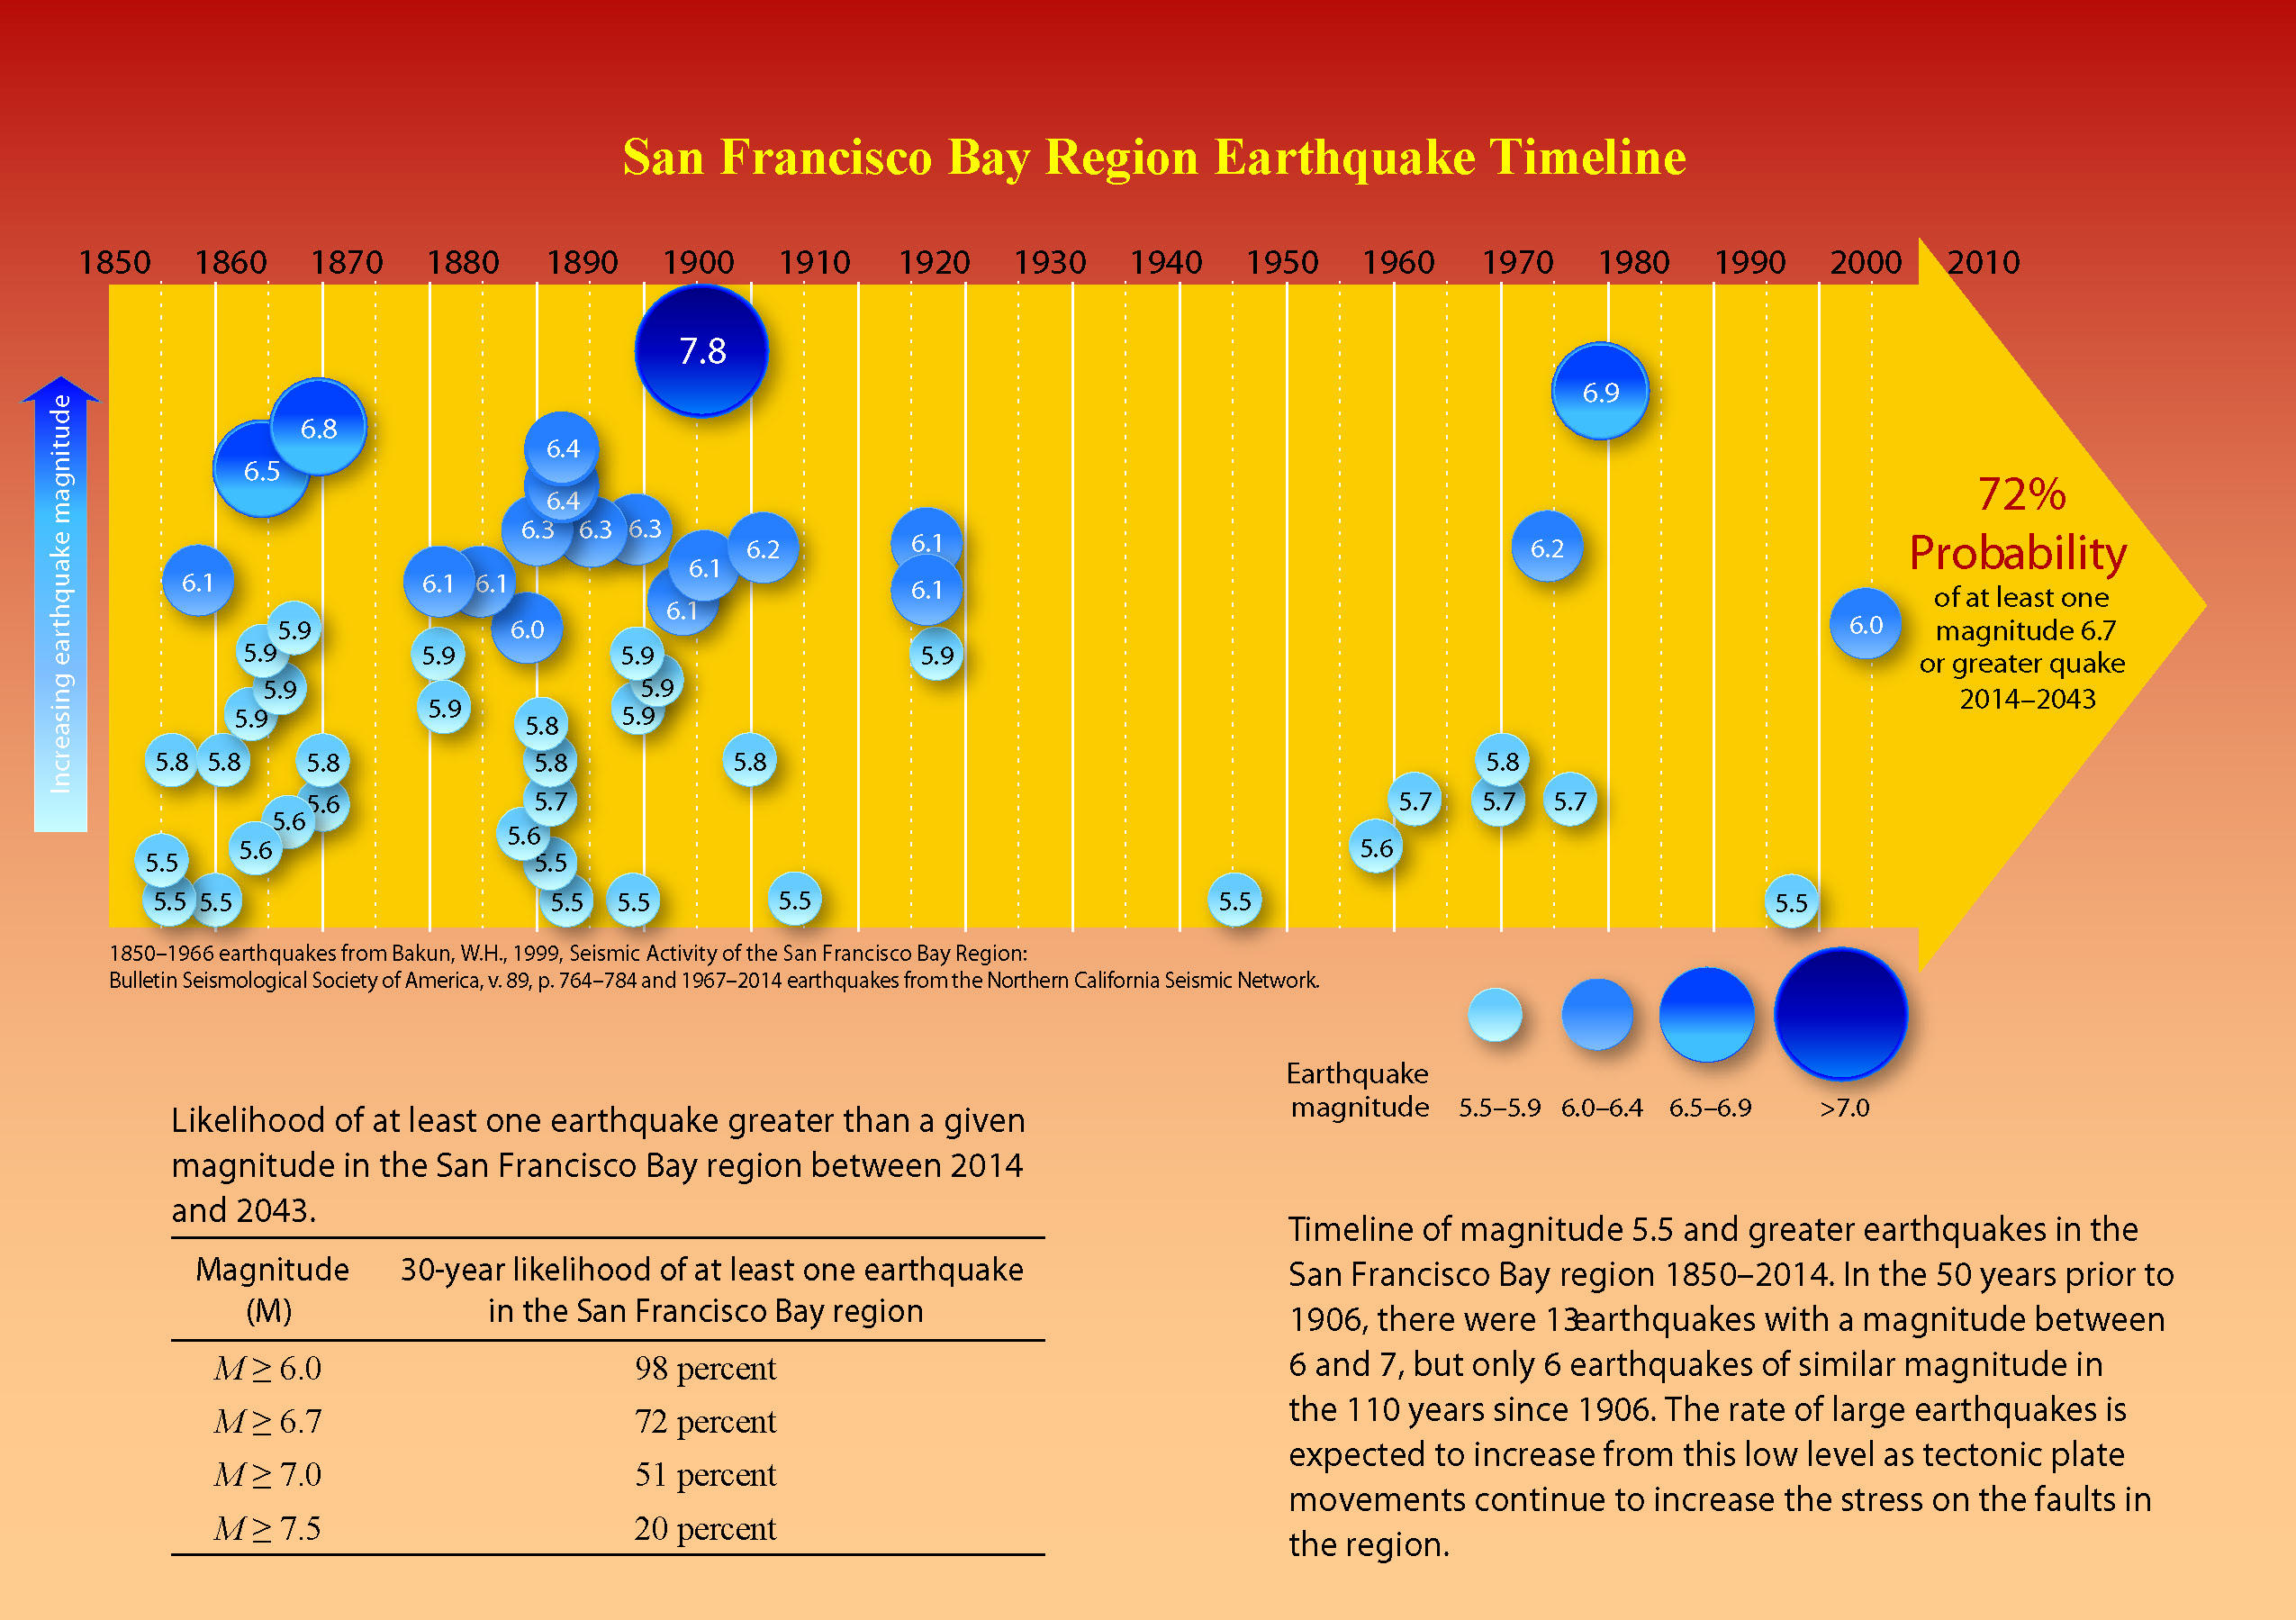
- This shows a timeline for historic earthquakes in this region.
- USGS tweet to informational page regarding the changes in earthquake magnitudes.
[FAQ] Why/When does the USGS update the magnitude of an earthquake? https://t.co/4I1in2iOdT pic.twitter.com/I0vc4jzkaB
— USGS (@USGS) January 4, 2018
- There are three types of earthquakes, strike-slip, compressional (reverse or thrust, depending upon the dip of the fault), and extensional (normal). Here is are some animations of these three types of earthquake faults. Many of the earthquakes people are familiar with in the Mendocino triple junction region are either compressional or strike slip. The following three animations are from IRIS.
- Strike Slip:
- Compressional:
- Extensional:
- This figure shows what a transform plate boundary fault is. Looking down from outer space, the crust on either side of the fault moves side-by-side. When one is standing on the ground, on one side of the fault, looking across the fault as it moves… If the crust on the other side of the fault moves to the right, the fault is a “right lateral” strike slip fault. The Mendocino and San Andreas faults are right-lateral (dextral) strike-slip faults. I believe this is from Pearson Higher Ed.
![]()
- For more on the graphical representation of moment tensors and focal mechnisms, check this IRIS video out:
- Here is a fantastic infographic from Frisch et al. (2011). This figure shows some examples of earthquakes in different plate tectonic settings, and what their fault plane solutions are. There is a cross section showing these focal mechanisms for a thrust or reverse earthquake. The upper right corner includes my favorite figure of all time. This shows the first motion (up or down) for each of the four quadrants. This figure also shows how the amplitude of the seismic waves are greatest (generally) in the middle of the quadrant and decrease to zero at the nodal planes (the boundary of each quadrant).

- 2017.12.14 M 4.3 Laytonville
- 2016.11.06 M 4.1 Laytonville, CA
- 2016.11.03 M 3.8 Laytonville, CA
- 2016.08.10 M 5.1 Lake Pillsbury, CA
- 2015.08.30 M 3.6 Mendocino County, CA
- 2015.07.27 M 3.5 Point Arena, CA
- 2018.01.04 M 4.4 Berkeley
- 2016.02.23 M 4.9 Bakersfield
- 2015.12.30 M 4.4 San Bernardino, CA
- 2015.05.03 M 3.8 Los Angeles, CA
- 2015.04.13 M 3.3 Los Angeles, CA
- 2014.04.01 M 5.1 La Habra p-3
- 2014.03.29 M 5.1 La Habra p-2
- 2014.03.28 M 5.1 La Habra p-1
- 2016.08.04 M 4.5 Honey Lake, CA
San Andreas fault
General Overview
Earthquake Reports
Northern CA
Central CA
Southern CA
Eastern CA
- Aagaard, B.T., Blair, J.L., Boatwright, J., Garcia, S.H., Harris, R.A., Michael, A.J., Schwartz, D.P., DiLeo, J.S., Jacques, K., and Donlin, C., 2016. Earthquake Outlook for the San Francisco Bay Region 2014–2043 in USGS Fact Sheet 2016–3020 Revised August 2016 (ver. 1.1) ISSN 2327-6916 (print) ISSN 2327-6932 (online) http://dx.doi.org/10.3133/fs20163020
- Geist, E.L. and Andrews D.J., 2000. Slip rates on San Francisco Bay area faults from anelastic deformation of the continental lithosphere, Journal of Geophysical Research, v. 105, no. B11, p. 25,543-25,552.
- Irwin, W.P., 1990. Quaternary deformation, in Wallace, R.E. (ed.), 1990, The San Andreas Fault system, California: U.S. Geological Survey Professional Paper 1515, online at: http://pubs.usgs.gov/pp/1990/1515/
- Stoffer, P.W., 2006, Where’s the San Andreas Fault? A guidebook to tracing the fault on public lands in the San Francisco Bay region: U.S. Geological Survey General Interest Publication 16, 123 p., online at http://pubs.usgs.gov/gip/2006/16/
- Wallace, Robert E., ed., 1990, The San Andreas fault system, California: U.S. Geological Survey Professional Paper 1515, 283 p. [https://pubs.er.usgs.gov/publication/pp1515].