Here I summarize the seismicity for Cascadia in 2017. I limit this summary to earthquakes with magnitude greater than or equal to M 2.5. I prepared reports for 6 of the 7 earthquakes presented (using moment tensors) on the main poster below. The largest magnitude earthquake was the M 5.7 on 2017.09.22.
- Here are the annual summaries:
- Here are the Cascadia summaries:
Below is my CSZ summary poster for this earthquake year
I present larger scale maps for the northern and southern portions of the CSZ on the left side of this interpretive poster.
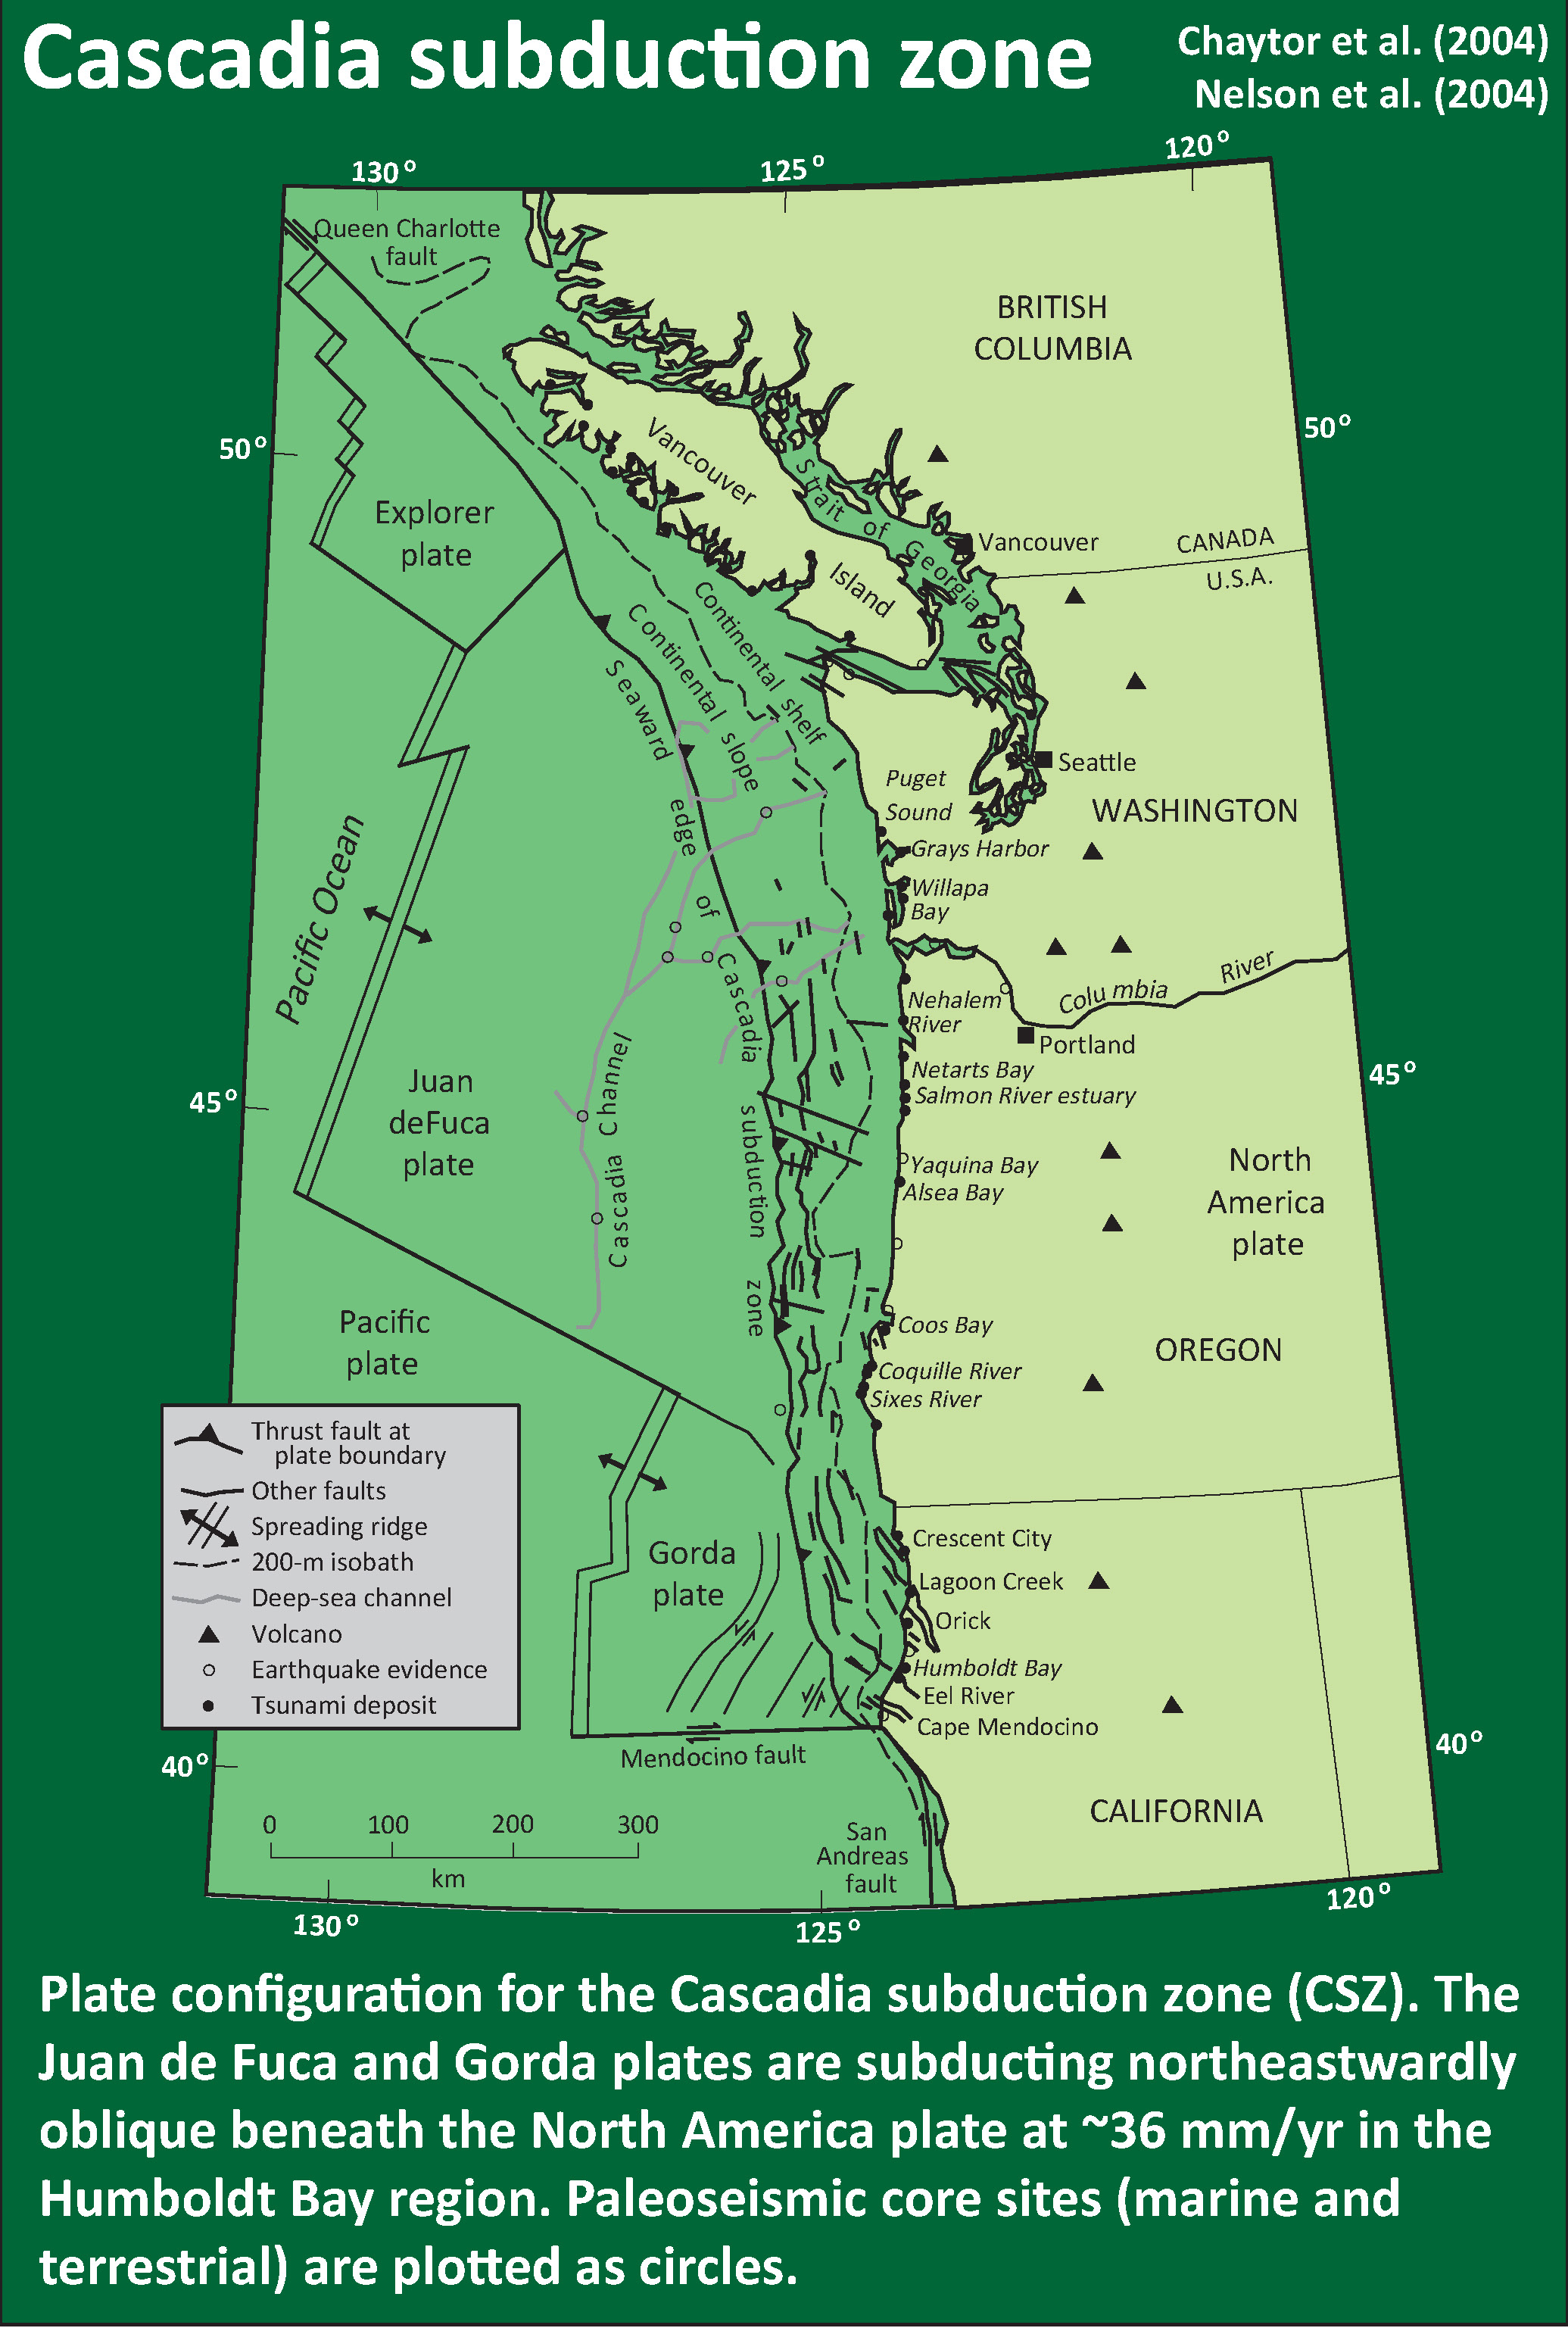
- In the upper right corner is a map of the Cascadia subduction zone (CSZ) and regional tectonic plate boundary faults. This is modified from several sources (Chaytor et al., 2004; Nelson et al., 2004).
- To the left of the CSZ map, I include generalized fault map of northern California from Wallace (1990).
- In the lower right corner I include a diagram from Wallace (1990) that shows the evolution o fhte North America-Pacific plate boundary since the past 29 million years (Ma).
- To the right of this large scale map, I include the Earthquake Shaking Potential map from the state of California. This is a probabilistic seismic hazard map, basically a map that shows the likelihood that there will be shaking of a given amount over a period of time. More can be found from the California Geological Survey here. I place a blue star in the approximate location of today’s earthquake.
I include some inset figures in the poster.

- Here is the same map, but with USGS seismicity from 1917-2017 with magnitudes M ≥ 2.5. Note how the seismicity along the northern CSZ does not correspond well to the mapped structures. It is as if the Queen Charlotte fault is busting through from the north, as the plate boundary organizes itself.

Cascadia subduction zone: General Overview
- Cascadia’s 315th Anniversary 2015.01.26
- Cascadia’s 316th Anniversary 2016.01.26
- 1992.04.25 M 7.1 Cape Mendocino 25 year remembrance
- 1992.04.25 M 7.1 Cape Mendocino 25 Year Remembrance Event Page
- Earthquake Information about the CSZ 2015.10.08
2017 Cascadia subduction zone Earthquake Report pages
- 2017.01.07 M 5.7 Explorer plate
- 2017.03.06 M 4.0 Cape Mendocino
- 2017.06.11 M 3.5 Gorda or NAP?
- 2017.07.28 M 5.1 Gorda plate (Cascadia)
- 2017.09.22 M 5.7 Mendocino fault
- 2017.12.14 M 4.3 Laytonville
Earthquake Background Materials
- There are three types of earthquakes, strike-slip, compressional (reverse or thrust, depending upon the dip of the fault), and extensional (normal). Here is are some animations of these three types of earthquake faults. Many of the earthquakes people are familiar with in the Mendocino triple junction region are either compressional or strike slip. The following three animations are from IRIS.
Strike Slip:
Compressional:
Extensional:
- Here is a primer that helps people learn how to interpret focal mechanisms and moment tensors. Moment tensors are calculated differently from focal mechanisms, but the interpretation of their graphical solution is similar. This is from the USGS.
- For more on the graphical representation of moment tensors and focal mechnisms, check this IRIS video out:
- Here is a fantastic infographic from Frisch et al. (2011). This figure shows some examples of earthquakes in different plate tectonic settings, and what their fault plane solutions are. There is a cross section showing these focal mechanisms for a thrust or reverse earthquake. The upper right corner includes my favorite figure of all time. This shows the first motion (up or down) for each of the four quadrants. This figure also shows how the amplitude of the seismic waves are greatest (generally) in the middle of the quadrant and decrease to zero at the nodal planes (the boundary of each quadrant).

Cascadia subduction zone: Earthquake Reports
- Click on the earthquake “magnitude and location” label (e.g. “M 5.7 Explorer plate”) to go to the Earthquake Report website for any given earthquake. Click on the map to open a high resolution pdf version of the interpretive poster. More information about the poster is found on the Earthquake Report website.
2017.01.07 M 5.7 Explorer plate
- In the past 2 days there have been a few earthquakes in the Explorer plate region along the Pacific-North America plate boundary. On March 19 of this year there was a series of earthquakes in this same region (to the southeast of today’s earthquakes). Here is my report for the March 2016 earthquakes.
- The Cascadia subduction zone (CSZ) is an approximately 1,200-kilometer convergent plate boundary that extends from northern California to Vancouver Island, Canada (inset figure). The Explorer, Juan de Fuca, and Gorda plates are subducting eastwardly below the North American plate. Seismicity, crustal deformation, and geodesy provide evidence that the Cascadia subduction zone is locked and is capable of producing a great (magnitude greater than or equal to 8.5) earthquake (Heaton and Kanamori, 1984; McPherson, 1989; Clarke and Carver, 1992; Hyndman and Wang, 1995; Flück and others, 1997).
- The Queen Charlotte fault (QCF) is a dextral (right-lateral) transform plate boundary (strike-slip) fault that forms the Pacific-North America plate boundary north of Vancouver Island. There have been a series of earthquakes along this fault system in the last 100 years, including earthquakes in the 1920s, 1940s, and 2010s. At its southern terminus it meets the CSZ and Explorer ridge (a spreading ridge system that forms oceanic lithosphere of the Explorer plate) to form the Queen Charlotte triple junction (QCTJ labeled on the interpretive poster below). I also include a map below showing the earthquakes with magnitudes M ≥ 7.0 for this time period. The southernmost part of the QCF also has a subduction zone beneath the strike-slip fault. This part of the boundary had a subduction zone earthquake in 2012.
- Here is the same map, but with the seismicity from 1900-2017 plotted. These are USGS earthquakes with magnitudes M ≥ 5.0 for this time period. These are the same earthquakes plotted in the video below.
- Here is the map with the seismicity from 1900-2017 plotted. These are USGS earthquakes with magnitudes M ≥ 7.0 for this time period. I include the moment tensors from the 2012 and 2013 earthquakes (the only earthquakes for this time period that have USGS moment tensors). The 2012 earthquake generated a tsunami. I discuss the 2012 “Haida Gwai” earthquake here.

2017.03.06 M 4.0 Cape Mendocino
- We just had an interesting earthquake in the region of the Mendocino triple junction. Recent earthquakes in this region show different fault plane solutions, owing to complexity of this area.
- In 1983 there was an earthquake ~10 km to the west of today’s earthquake which had a right-lateral oblique compressional focal mechanism. In 2015, there was an earthquake ~15 km to the east of today’s earthquake that also had a right-lateral strike-slip moment tensor. If today’s earthquake was oblique, it would be left-lateral extensional. Today’s earthquake is quite interesting. I will need to think about it further.
2017.06.11 M 3.5 Gorda or NAP?
- Early this morning, I was awakened by a mild jolt. I thought, well, seems like a M 3+- nearby. I did not get out of bed. The main shaking lasted a couple of seconds, though it seemed that there was some additional shaking for several more seconds afterwards (secondary shaking? I live in the Manila Dunes, which overlie several kms of water saturated sediment.
2017.07.28 M 5.1 Gorda plate (Cascadia)
- We just had an earthquake in the Gorda plate. The USGS magnitude is 5.1. This earthquake happened a few kilometers southwest of the 2014 M 6.8 earthquake. Based upon the orientation of the faults in the region, today’s earthquake may have occurred on the same fault as the 2014 earthquake (but it is really difficult to tell and just as likely did not).
- The last earthquake report I prepared for a Gorda plate earthquake happened on 2016.09.25. Here is my report for that earthquake.

2017.09.22 M 5.7 Mendocino fault
- I was driving around Eureka today, running to the appliance center to get an appliance (heheh). I got a message from a long time held friend (who lives in Salinas, CA). They asked me if I was OK, given that there was an earthquake up here. I thought I had not felt it because I was driving around. However, after looking at the USGS website, I learned the earthquake happened earlier, while I was back working on my house. The main reason I did not feel it is because it was too far away.
- Today’s M 5.7 earthquake was along the western part of the Mendocino fault (MF), a right-lateral (dextral) transform plate boundary. This plate boundary connects the Gorda ridge and Juan de Fuca rise spreading centers with their counterparts in the Gulf of California, with the San Andreas strike-slip fault system. Transform plate boundaries are defined that they are strike-slip and that they connect spreading ridges. In this sense of the definition, the Mendocino fault and the San Andreas fault are part of the same system. Here is the USGS website for this earthquake.
- There was a good sized (M 6.5) MF earthquake late last year on 2016.12.08. I present my poster for that earthquake below. Here is my report for that earthquake. Here is the updated report.
- The San Andreas fault is a right-lateral strike-slip transform plate boundary between the Pacific and North America plates. The plate boundary is composed of faults that are parallel to sub-parallel to the SAF and extend from the west coast of CA to the Wasatch fault (WF) system in central Utah (the WF runs through Salt Lake City and is expressed by the mountain range on the east side of the basin that Salt Lake City is built within).
- The three main faults in the region north of San Francisco are the SAF, the MF, and the Bartlett Springs fault (BSF). I also place a graphical depiction of the USGS moment tensor for this earthquake. The SAF, MF, and BSF are all right lateral strike-slip fault systems. There are no active faults mapped in the region of Sunday’s epicenter, but I interpret this earthquake to have right-lateral slip. Without more seismicity or mapped faults to suggest otherwise, this is a reasonable interpretation.
- The Cascadia subduction zone is a convergent plate boundary where the Juan de Fuca and Gorda plates (JDFP and GP, respectively) subduct norteastwardly beneath the North America plate at rates ranging from 29- to 45-mm/yr. The Juan de Fuca and Gorda plates are formed at the Juan de Fuca Ridge and Gorda Rise spreading centers respectively. More about the CSZ can be found here.
- Here is the 2016.12.08 earthquake report poster from this report.
- Here is a video of the seismograph for this M 5.7 earthquake. The video was captured by Cindy Scammell, an undergraduate student at the Humboldt State University, Department of Geology. She is lovingly caring for her newborn. Here is a link to download the video. (3 MB mp4)
- Abbreviations
- BSF – Bartlett Springs fault
- CA – California
- CSZ – Cascadia subduction zone
- GP – Gorda plate
- JDFP – Juan de Fuca plate
- MF – Mendocino fault
- MMI – Modified Mercalli Intensity Scale
- SAF – San Andreas fault
- USGS – U.S. Geological Survey
- WF – Wasatch fault
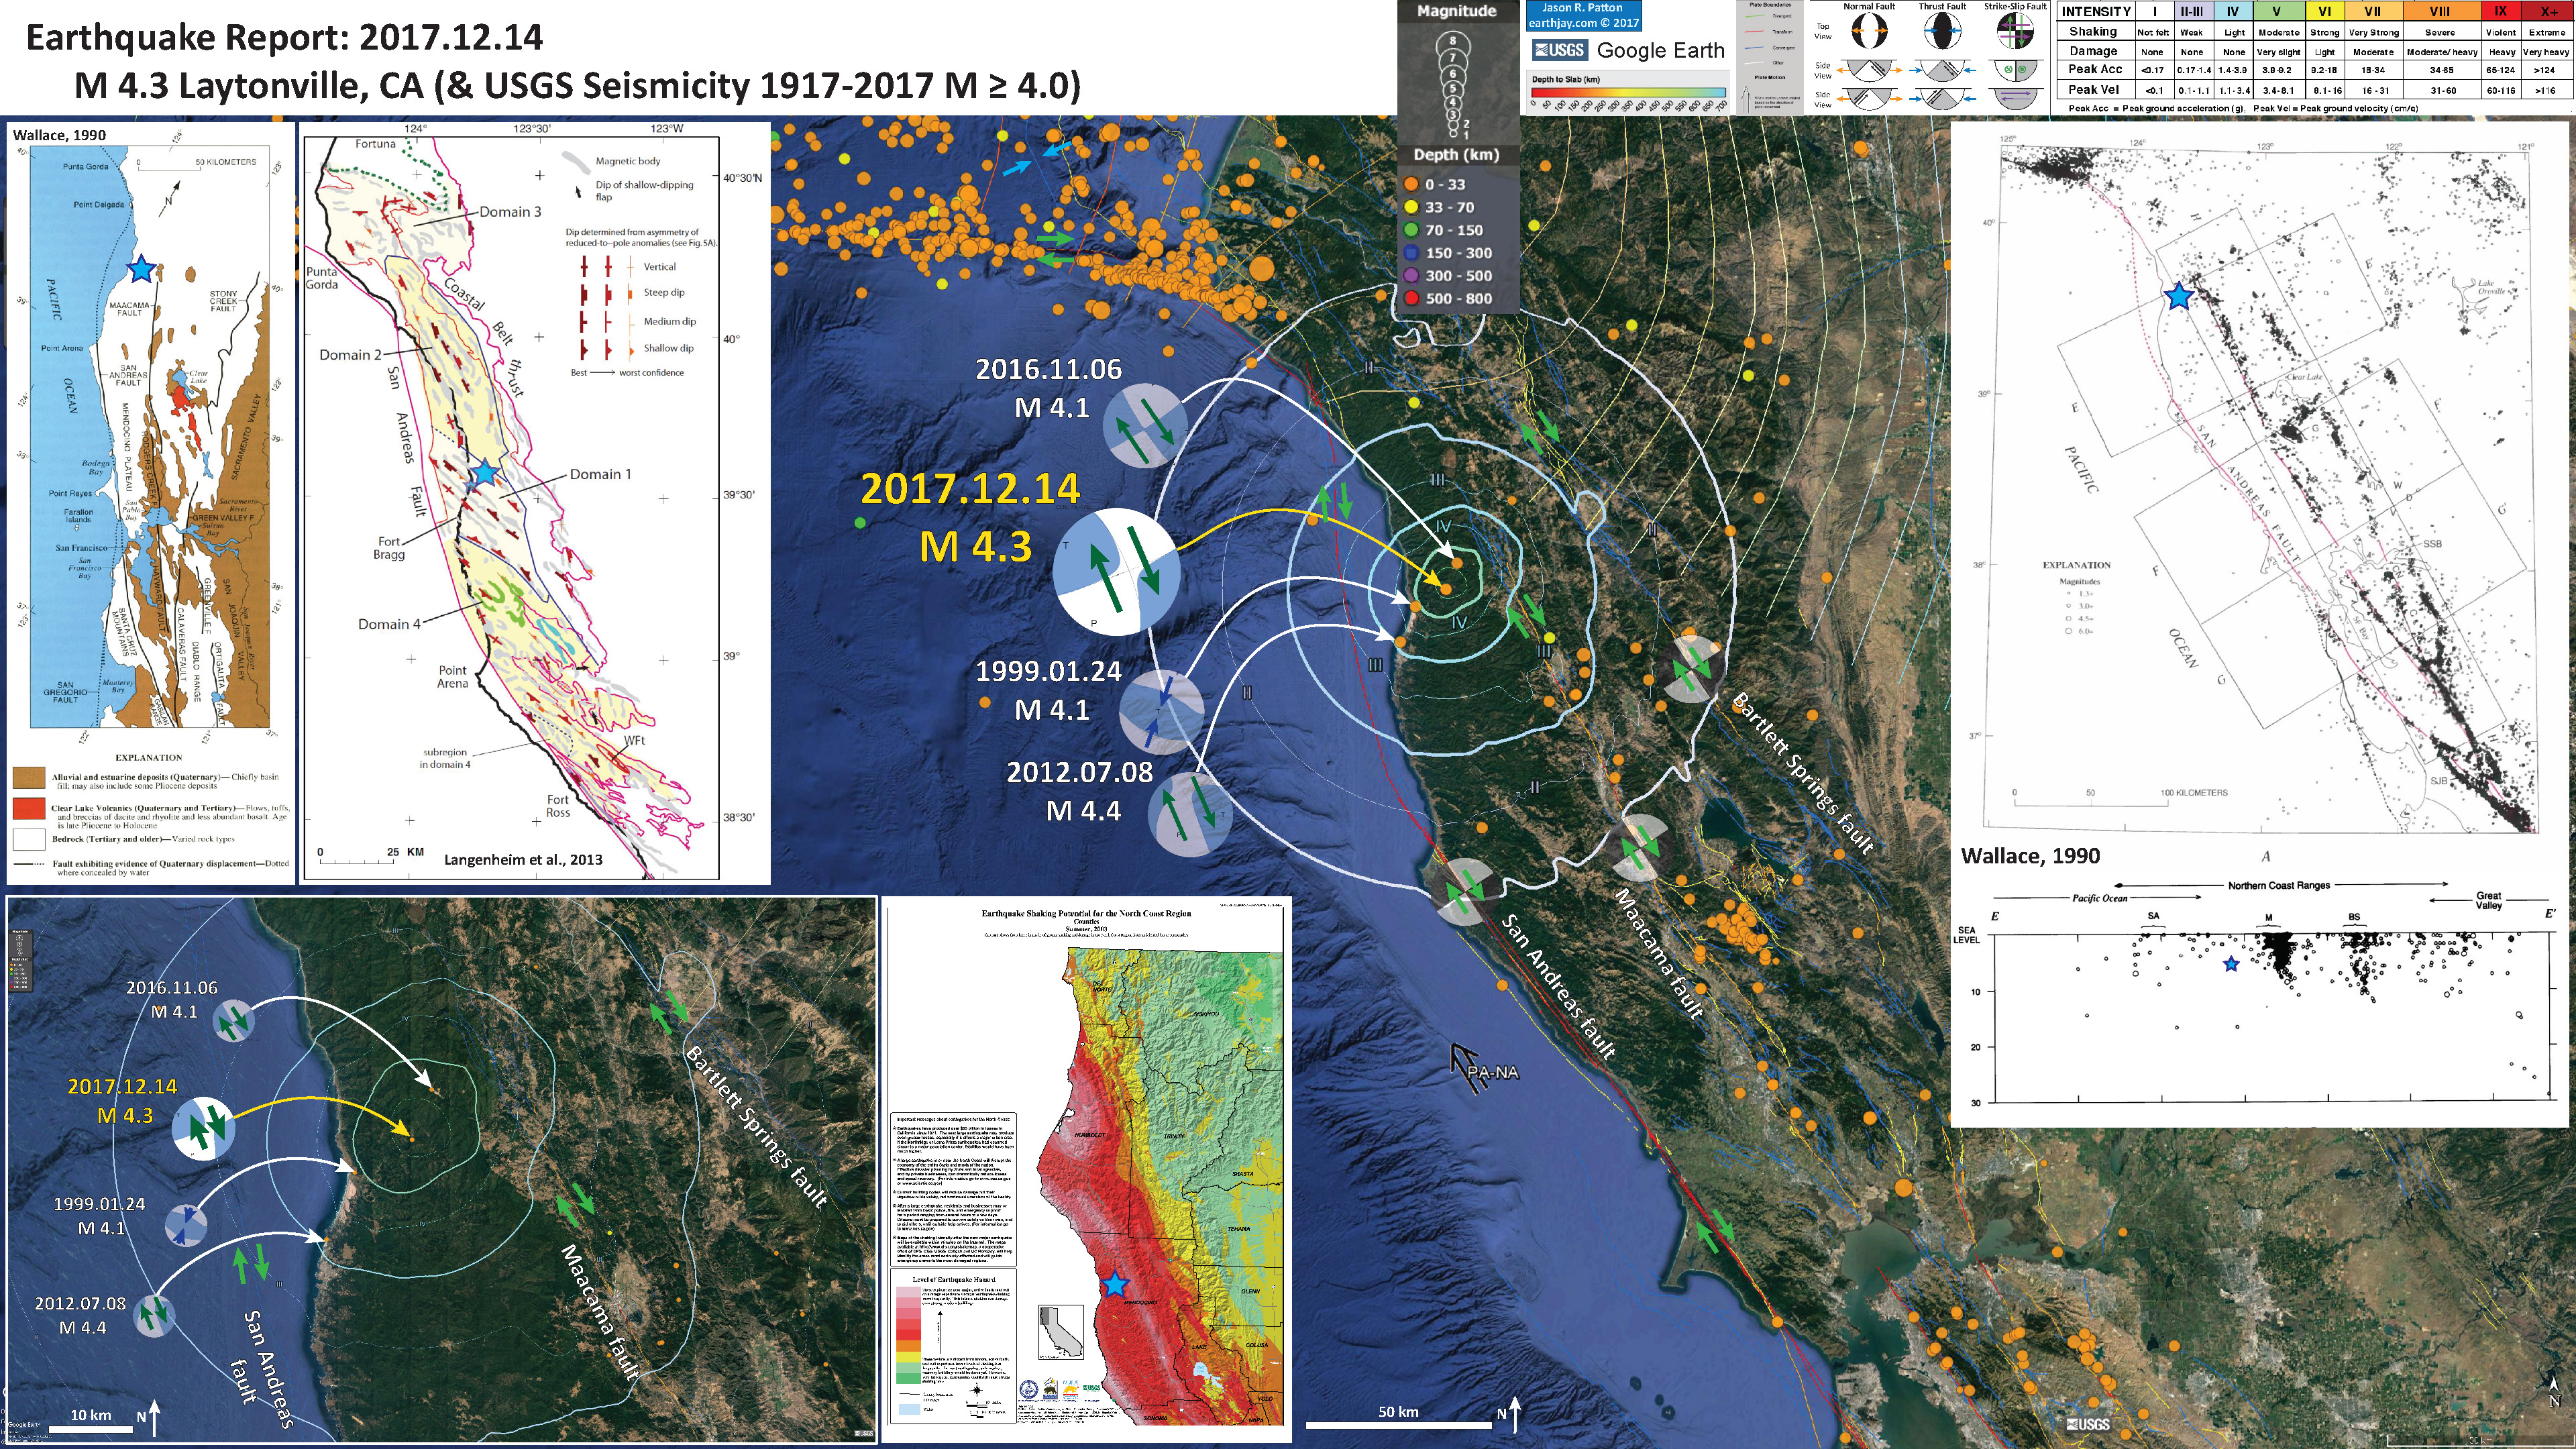
2017.12.14 M 4.3 Laytonville
- This morning there was a small earthquake in a region of northern California between two major faults that are part of the Pacific-North America plate boundary. The M 4.3 earthquake occurred between the San Andreas fault (SAF) to the west and the Maacma fault (MF) to the east. There are no mapped earthquake faults in this region.
- The San Andreas fault is a right-lateral strike-slip transform plate boundary between the Pacific and North America plates. The plate boundary is composed of faults that are parallel to sub-parallel to the SAF and extend from the west coast of CA to the Wasatch fault (WF) system in central Utah (the WF runs through Salt Lake City and is expressed by the mountain range on the east side of the basin that Salt Lake City is built within).
- About 75% of the relative plate motion is accommodated along the SAF and its synthetic sister faults in the northern CA region. The rest of the plate boundary motion is accommodated along the Eastern CA shear zone and Walker Lane, along with the Central Nevada Seismic Belt, and the Wasatch fault systems. In Northern CA, there is about 33-37 mm/yr strain accumulated on the SAF plate boundary system. About 18-25 mm/yr is on the SAF, 8-11 mm/yr on the MF, and 5-7 mm/yr on the Bartlett Springs fault system (Geist and Andrews, 2000).
- The three main faults in the region north of San Francisco are the SAF, the MF, and the Bartlett Springs fault (BSF). I also place a graphical depiction of the USGS moment tensor for this earthquake. The SAF, MF, and BSF are all right lateral strike-slip fault systems. There are no active faults mapped in the region of Sunday’s epicenter, but I interpret this earthquake to have right-lateral slip. Without more seismicity or mapped faults to suggest otherwise, this is a reasonable interpretation.
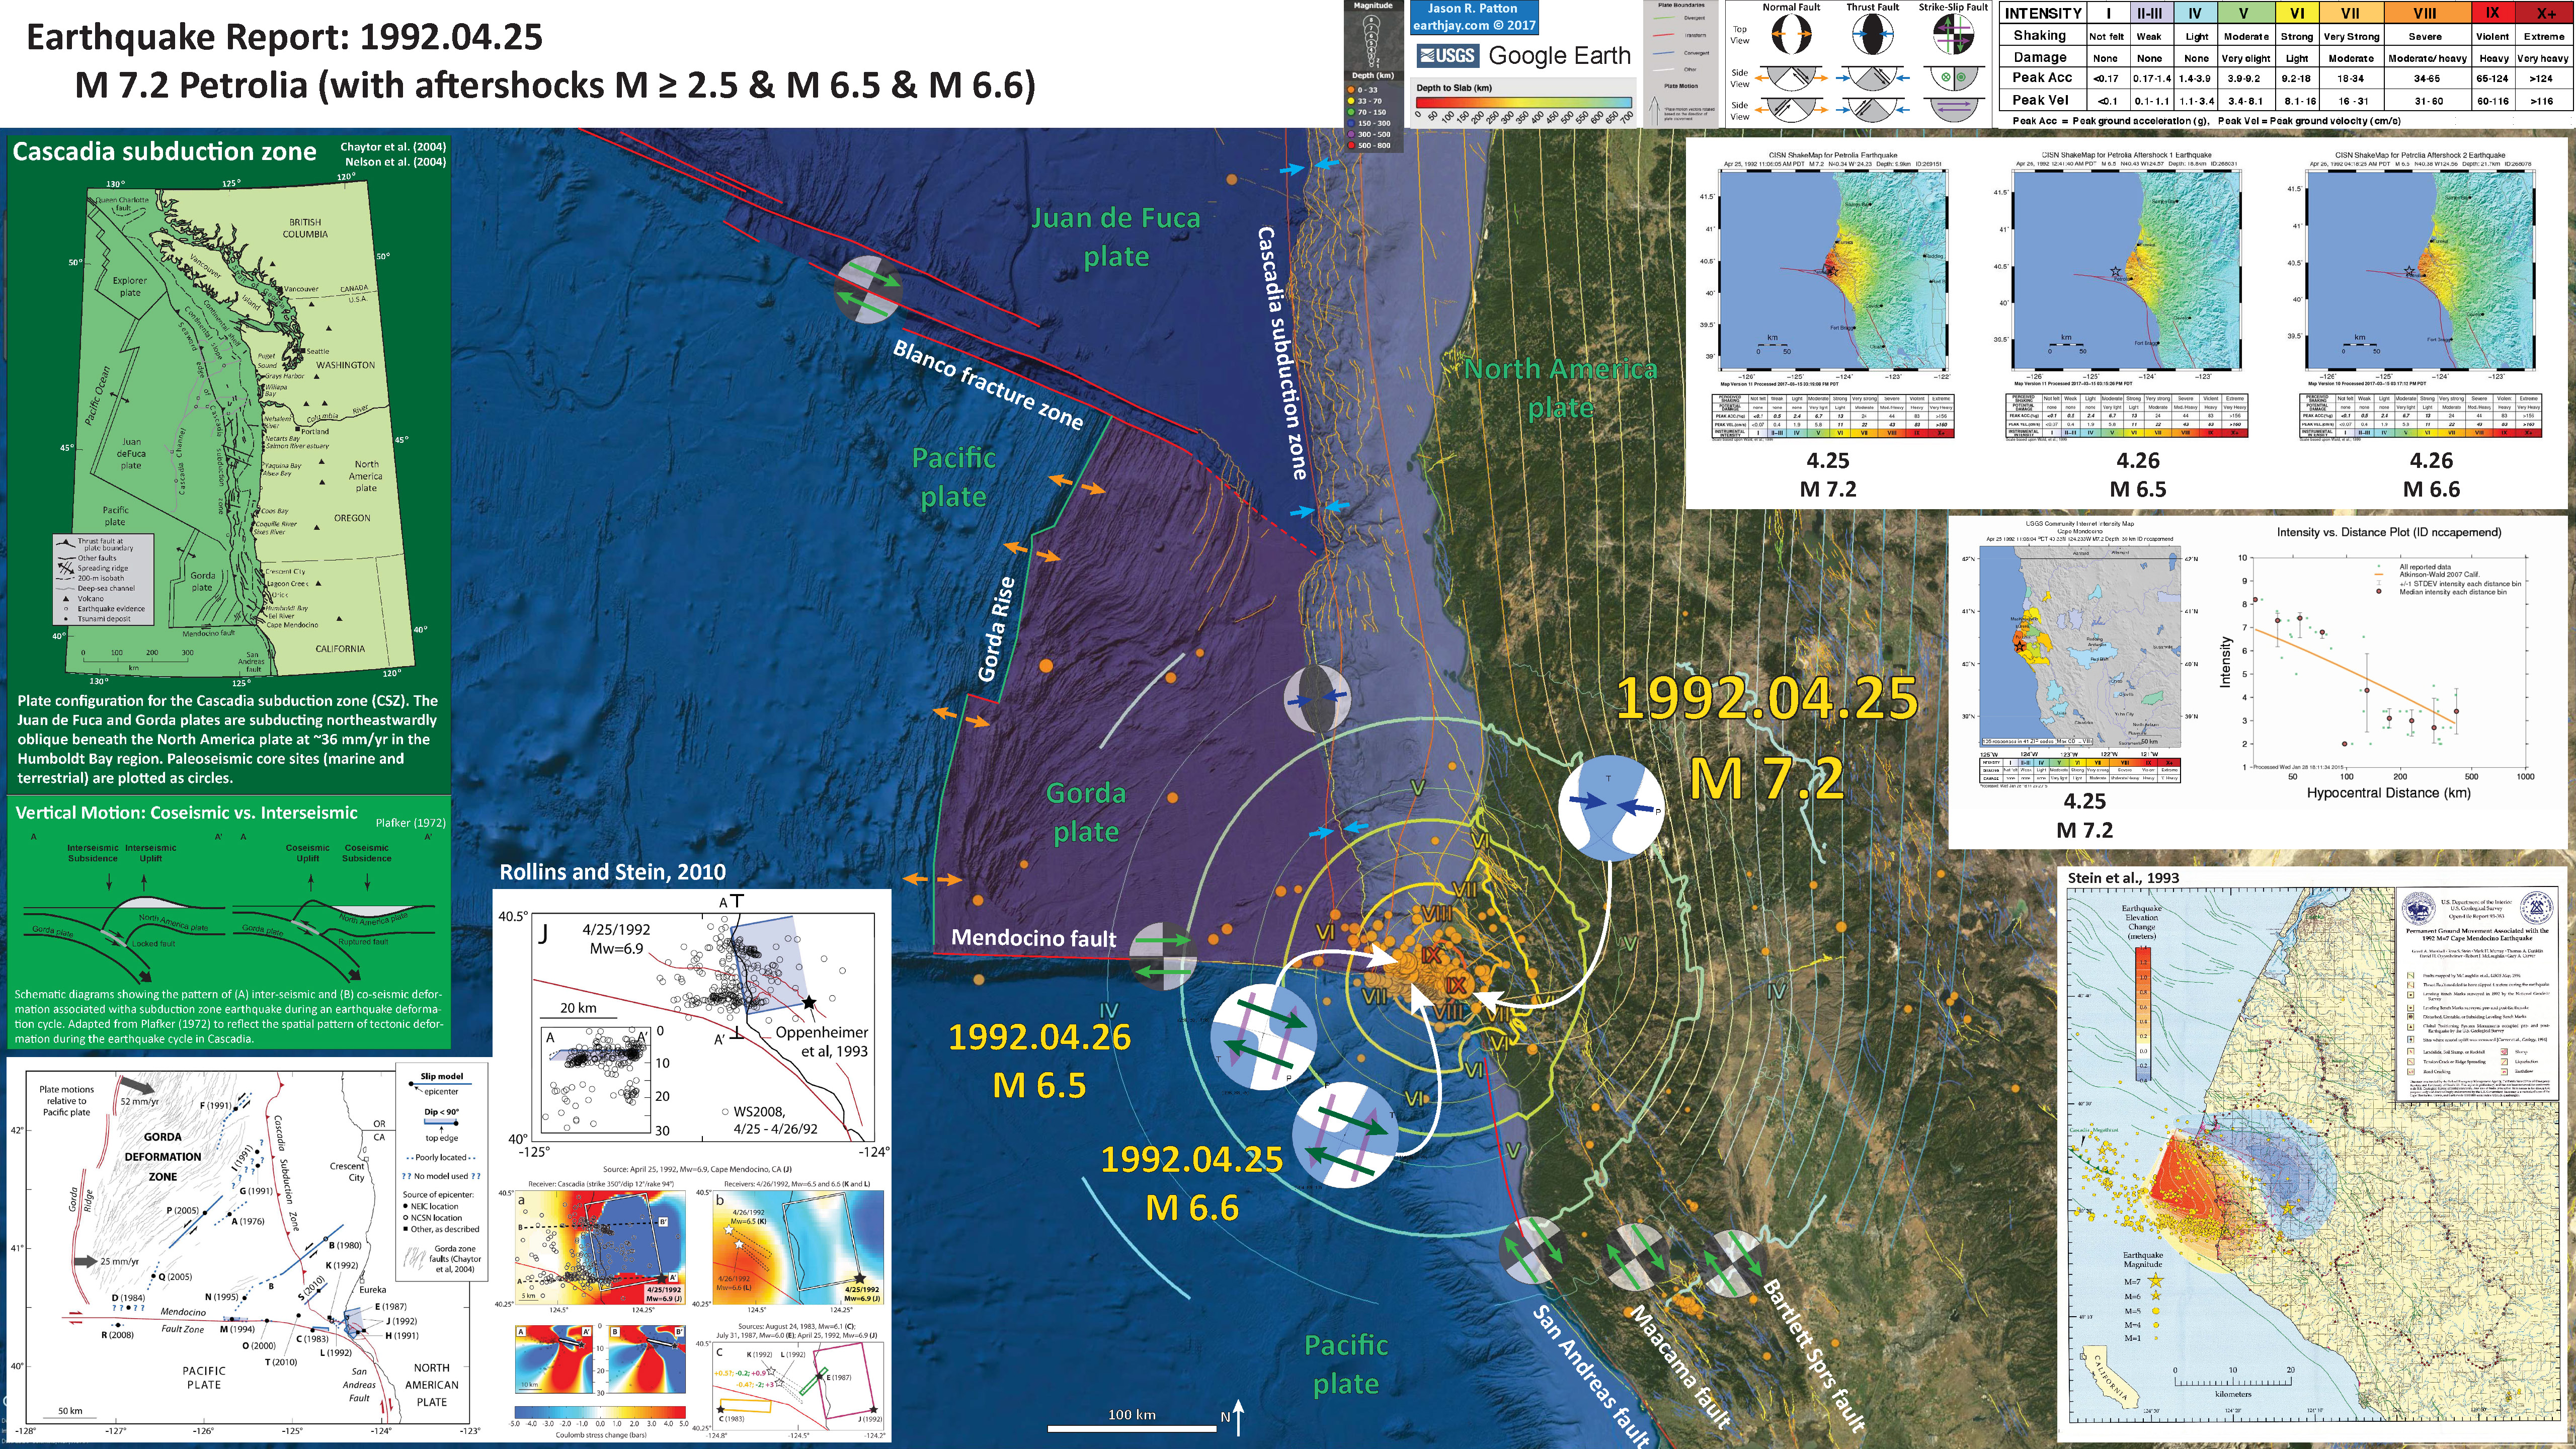
1992.04.25 M 7.1 Cape Mendocino 25 year remembrance
- The 25 April 1992 M 7.1 earthquake was a wake up call for many, like all large magnitude earthquakes are.
- Here is my personal story.
- I was driving my girlfriend’s car (Jen Guevara) with her and some housemates up to attend a festival at Redwood Park in Arcata. She lived in the old blue house at the base of the bridge abutment on the southwest side of HWY 101 as it crosses Mad River. The house burned down a couple of years ago, but these memories remain. We were driving along St. Louis and about to turn east to cross the 101 towards LK Wood. The car moved left and right. I pulled over as I thought we might have just gotten a flat tire. I got out, inspected the wheels, and there was no flat. We returned to our journey. When we arrived at the park, everyone was talking about how the redwood trees were flopping around like wet spaghetti during the earthquake. I then looked back in my memory and realized that, at the lumber mill that I had parked by when I got the imaginary flat tire, there were tall stacks of milled lumber flopping around. I had dismissed it that they were blowing in the wind. Silly me.
- Later that night, I was at a reggae concert at the Old Creamery Building in Arcata. At some point, the lights flickered off and on. I figured that someone had accidentally brushed up against the light switch on the wall. BUT, this was the first of two large aftershocks.
- Even later that night, actually the following morning, I was laying in bed with Jen. The house typically shook when large semi trucks crossed the 101 bridge. However, this time, the shaking had a much longer duration. This was the second of the two major aftershocks. I finally recognized this earthquake as an earthquake and not something else. To my credit, I was dancing during the first major aftershock.
- Here is a link to the embedded video below, showing the week-long seismicity in April 1992.
- Hemphill-Haley, E., 1995. Diatom evidence for earthquake-induced subsidence and tsunami 300 yr ago in southern coastal Washington in GSA Bulletin, v. 107, p. 367-378.
- Nelson, A.R., Shennan, I., and Long, A.J., 1996. Identifying coseismic subsidence in tidal-wetland stratigraphic sequences at the Cascadia subduction zone of western North America in Journal of Geophysical Research, v. 101, p. 6115-6135.
- Atwater, B.F. and Hemphill-Haley, E., 1997. Recurrence Intervals for Great Earthquakes of the Past 3,500 Years at Northeastern Willapa Bay, Washington in U.S. Geological Survey Professional Paper 1576, Washington D.C., 119 pp.
I have compiled some literature about the CSZ earthquake and tsunami. Here is a short list that might help us learn about what is contained within the core that I collected.
Cascadia subduction zone: Tectonic Background
- Here is a map of the Cascadia subduction zone, modified from Nelson et al. (2004). The Juan de Fuca and Gorda plates subduct norteastwardly beneath the North America plate at rates ranging from 29- to 45-mm/yr. Sites where evidence of past earthquakes (paleoseismology) are denoted by white dots. Where there is also evidence for past CSZ tsunami, there are black dots. These paleoseismology sites are labeled (e.g. Humboldt Bay). Some submarine paleoseismology core sites are also shown as grey dots. The two main spreading ridges are not labeled, but the northern one is the Juan de Fuca ridge (where oceanic crust is formed for the Juan de Fuca plate) and the southern one is the Gorda rise (where the oceanic crust is formed for the Gorda plate).
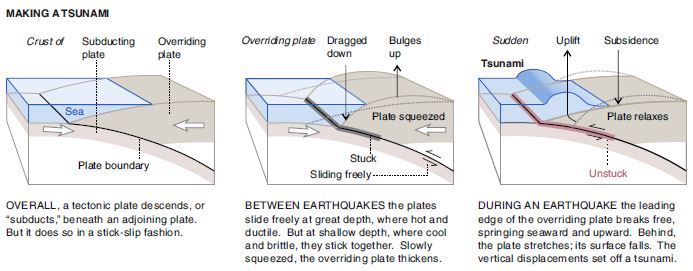
- Here is a version of the CSZ cross section alone (Plafker, 1972). This shows two parts of the earthquake cycle: the interseismic part (between earthquakes) and the coseismic part (during earthquakes). Regions that experience uplift during the interseismic period tend to experience subsidence during the coseismic period.

- This figure shows how a subduction zone deforms between (interseismic) and during (coseismic) earthquakes. We also can see how a subduction zone generates a tsunami. Atwater et al., 2005.
- Here is an animation produced by the folks at Cal Tech following the 2004 Sumatra-Andaman subduction zone earthquake. I have several posts about that earthquake here and here. One may learn more about this animation, as well as download this animation here.
Here are some maps of the earthquakes in this region from 1917-2017 with M ≥ 6.5.
- This is the map used in the animation below. Earthquake epicenters are plotted (some with USGS moment tensors) for this region from 1917-2017 with M ≥ 6.5. I labeled the plates and shaded their general location in different colors.
- I include some inset maps.
- In the upper right corner is a map of the Cascadia subduction zone (Chaytor et al., 2004; Nelson et al., 2004).
- In the upper left corner is a map from Rollins and Stein (2010). They plot epicenters and fault lines involved in earthquakes between 1976 and 2010.

- Here is a link to the embedded video below, showing these earthquakes.
- 1922.01.31 13:17 M 7.3
- 1923.01.22 09:04 M 6.9
- 1934-07-06 22:48 M 6.7
- 1941-02-09 09:44 M 6.8
- 1949-03-24 20:56 M 6.5
- 1954-11-25 11:16 M 6.8
- 1954-12-21 19:56 M 6.6
- 1980-11-08 10:27 M 7.2
- 1984-09-10 03:14 M 6.7
- 1984-09-10 03:14 M 6.6
- 1991-07-13 02:50 M 6.9
- 1991-08-17 22:17 M 7.0
- 1992-04-25 18:06 M 7.2
- 1992-04-26 07:41 M 6.5
- 1992-04-26 11:18 M 6.6
- 1994-09-01 15:15 M 7.0
- 1995-02-19 04:03 M 6.6
- 2005-06-15 02:50 M 7.2
- 2005-06-17 06:21 M 6.6
- 2010-01-10 00:27 M 6.5
- 2014-03-10 05:18 M 6.8
- 2016-12-08 14:49 M 6.5
Here are the USGS websites for all the earthquakes in this region from 1917-2017 with M ≥ 6.5.
- Here is a figure from Chaytor et al. (2004) that shows how they interpret the different faults based upon bathymetric data. Note the north-south striking faults in the northern part of the Gorda plate. However, they are normal faults, not strike slip. So, this makes it more difficult (again) to interpret today’s M 3.5 earthquake.
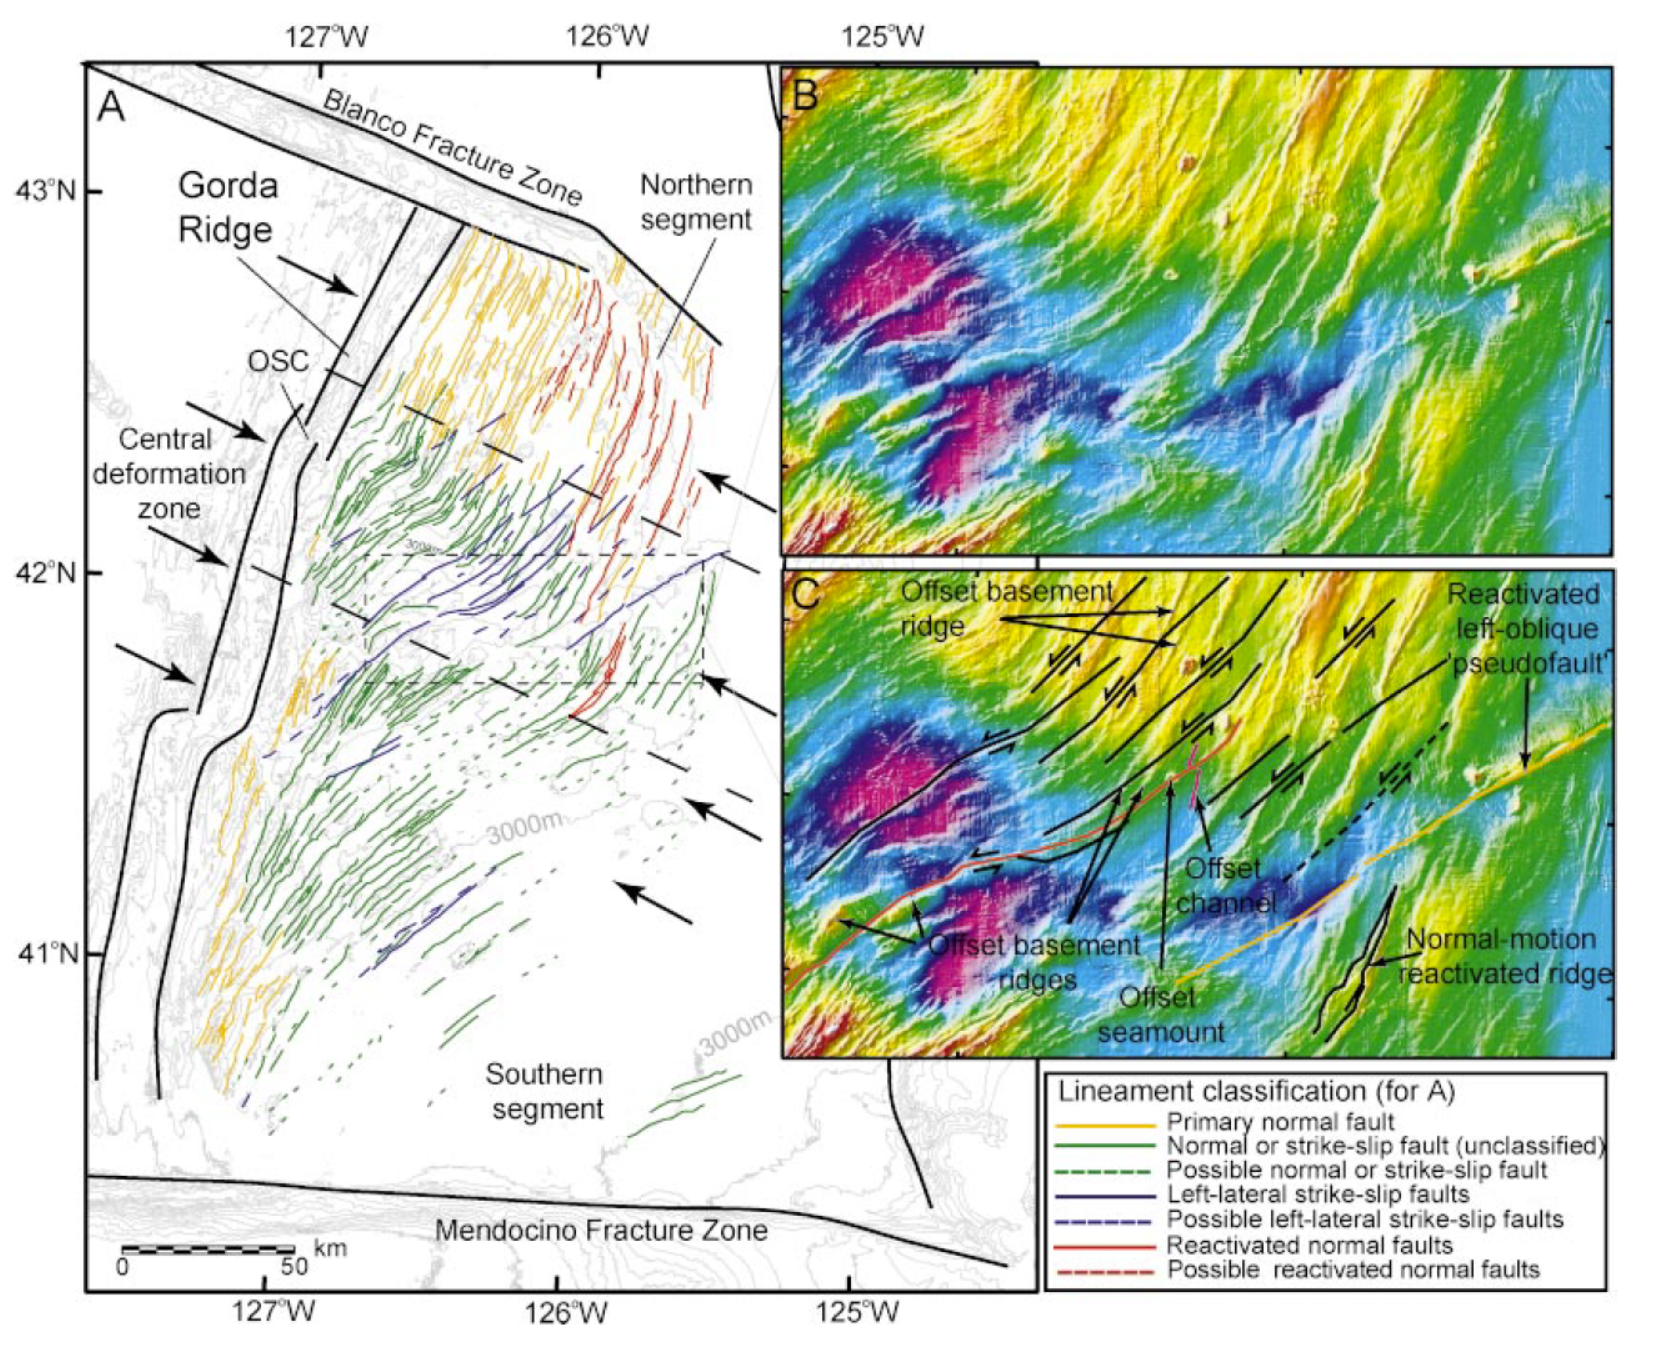
A: Mapped faults and fault-related ridges within Gorda plate based on basement structure and surface morphology, overlain on bathymetric contours (gray lines—250 m interval). Approximate boundaries of three structural segments are also shown. Black arrows indicated approximate location of possible northwest- trending large-scale folds. B, C:
Uninterpreted and interpreted enlargements of center of plate showing location of interpreted second-generation strike-slip faults and features that they appear to offset. OSC—overlapping spreading center.
- Here is another figure from Chaytor et al. (2004) that shows the different models for the Gorda plate faults.
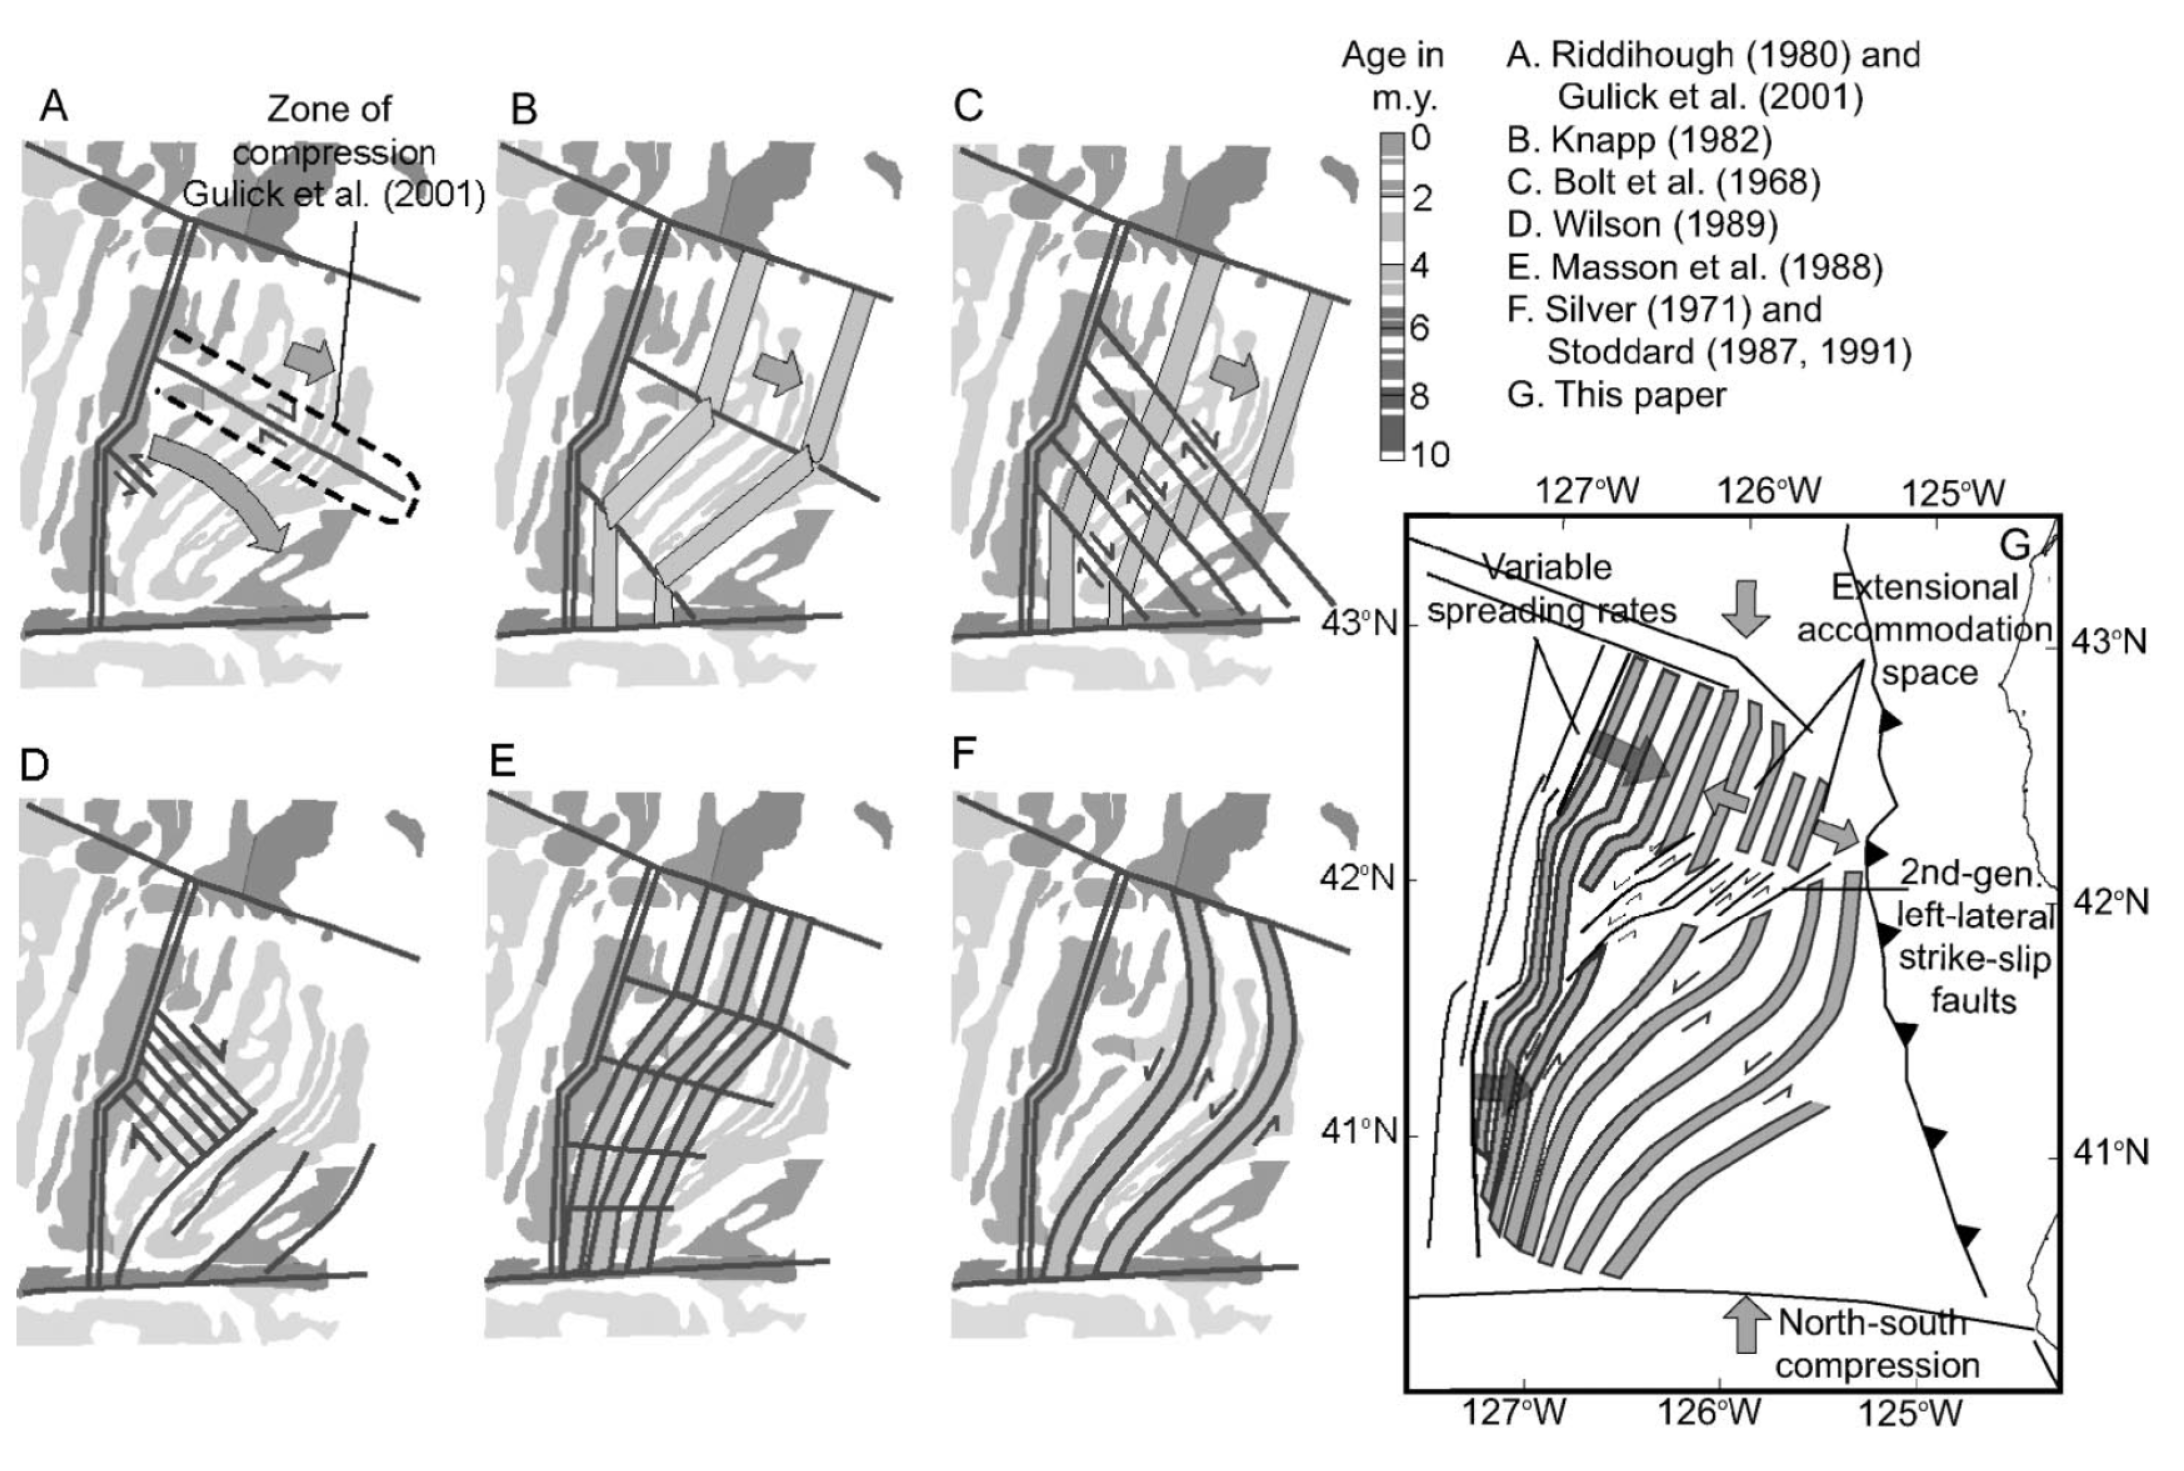
Models of brittle deformation for Gorda plate overlain on magnetic anomalies modified from Raff and Mason (1961). Models A–F were proposed prior to collection and analysis of full-plate multibeam data. Deformation model of Gulick et al. (2001) is included in model A. Model G represents modification of Stoddard’s (1987) flexural-slip model proposed in this paper.
Cascadia subduction zone Earthquake Reports
- 1700.09.26 M 9.0 Cascadia’s 315th Anniversary 2015.01.26
- 1700.09.26 M 9.0 Cascadia’s 316th Anniversary 2016.01.26
- 1992.04.25 M 7.1 Cape Mendocino 25 year remembrance
- 1992.04.25 M 7.1 Cape Mendocino 25 Year Remembrance Event Page
- Earthquake Information about the CSZ 2015.10.08
- 2017.07.28 M 5.1 Gorda plate
- 2016.09.25 M 5.0 Gorda plate
- 2016.09.25 M 5.0 Gorda plate
- 2016.01.30 M 5.0 Gorda plate
- 2015.12.29 M 4.9 Gorda plate
- 2015.11.18 M 3.2 Gorda plate
- 2014.03.13 M 5.2 Gorda Rise
- 2014.03.09 M 6.8 Gorda plate p-1
- 2014.03.23 M 6.8 Gorda plate p-2
- 2015.06.01 M 5.8 Blanco fracture zone p-1
- 2015.06.01 M 5.8 Blanco fracture zone p-2 (animations)
- 2017.09.22 M 5.7 Mendocino fault
- 2016.12.08 M 6.5 Mendocino fault, CA
- 2016.12.08 M 6.5 Mendocino fault, CA Update #1
- 2016.12.05 M 4.3 Petrolia CA
- 2016.10.27 M 4.1 Mendocino fault
- 2016.09.03 M 5.6 Mendocino
- 2016.01.02 M 4.5 Mendocino fault
- 2015.11.01 M 4.3 Mendocino fault
- 2015.01.28 M 5.7 Mendocino fault
- 2017.03.06 M 4.0 Cape Mendocino
- 2016.11.02 M 3.6 Oregon
- 2016.01.07 M 4.2 NAP(?)
- 2015.10.29 M 3.4 Bayside
- 2017.01.07 M 5.7 Explorer plate
- 2016.03.19 M 5.2 Explorer plate
- 2017.06.11 M 3.5 Gorda or NAP?
- 2016.07.21 M 4.7 Gorda or NAP? p-1
- 2016.07.21 M 4.7 Gorda or NAP? p-2
General Overview
Earthquake Reports
Gorda plate
Blanco fracture zone
Mendocino fault
Mendocino triple junction
North America plate
Explorer plate
Uncertain
San Andreas fault
- 2017.12.14 M 4.3 Laytonville
- 2016.11.06 M 4.1 Laytonville, CA
- 2016.11.03 M 3.8 Laytonville, CA
- 2016.08.10 M 5.1 Lake Pillsbury, CA
- 2015.08.30 M 3.6 Mendocino County, CA
- 2015.07.27 M 3.5 Point Arena, CA
- 2016.02.23 M 4.9 Bakersfield
- 2015.12.30 M 4.4 San Bernardino, CA
- 2015.05.03 M 3.8 Los Angeles, CA
- 2015.04.13 M 3.3 Los Angeles, CA
- 2014.04.01 M 5.1 La Habra p-3
- 2014.03.29 M 5.1 La Habra p-2
- 2014.03.28 M 5.1 La Habra p-1
- 2016.08.04 M 4.5 Honey Lake, CA
General Overview
Earthquake Reports
Northern CA
Southern CA
Eastern CA
Basin and Range
- 2017.09.02 M 5.3 Idaho
- 2016.12.28 M 5.7 swarm Nevada
- 2014.11.05 M 4.6 swarm Nevada
General Overview
Earthquake Reports
Idaho
Nevada
References
- Atwater, B.F., Musumi-Rokkaku, S., Satake, K., Tsuju, Y., Eueda, K., and Yamaguchi, D.K., 2005. The Orphan Tsunami of 1700—Japanese Clues to a Parent Earthquake in North America, USGS Professional Paper 1707, USGS, Reston, VA, 144 pp.
- Burgette, R. et al., 2009. Interseismic uplift rates for western Oregon and along-strike variation in locking on the Cascadia subduction zone in Journal of Geophysical Research, v. 114, B01408, doi:10.1029/2008JB005679
- Chaytor, J.D., Goldfinger, C., Dziak, R.P., and Fox, C.G., 2004. Active deformation of the Gorda plate: Constraining deformation models with new geophysical data: Geology v. 32, p. 353-356.
- Dengler, L.A., Moley, K.M., McPherson, R.C., Pasyanos, M., Dewey, J.W., and Murray, M., 1995. The September 1, 1994 Mendocino Fault Earthquake, California Geology, Marc/April 1995, p. 43-53.
- Frisch, W., Meschede, M., Blakey, R., 2011. Plate Tectonics, Springer-Verlag, London, 213 pp.
- Geist, E.L. and Andrews D.J., 2000. Slip rates on San Francisco Bay area faults from anelastic deformation of the continental lithosphere, Journal of Geophysical Research, v. 105, no. B11, p. 25,543-25,552.
- Goldfinger, C., Nelson, C.H., Morey, A., Johnson, J.E., Gutierrez-Pastor, J., Eriksson, A.T., Karabanov, E., Patton, J., Gràcia, E., Enkin, R., Dallimore, A., Dunhill, G., and Vallier, T., 2012. Turbidite Event History: Methods and Implications for Holocene Paleoseismicity of the Cascadia Subduction Zone, USGS Professional Paper # 1661F. U.S. Geological Survey, Reston, VA, 184 pp.
- Irwin, W.P., 1990. Quaternary deformation, in Wallace, R.E. (ed.), 1990, The San Andreas Fault system, California: U.S. Geological Survey Professional Paper 1515, online at: http://pubs.usgs.gov/pp/1990/1515/
- McCrory, P. A., Blair, J. L., Oppenheimer, D. H., and Walter, S. R., 2006. Depth to the Juan de Fuca slab beneath the Cascadia subduction margin; a 3-D model for sorting earthquakes U. S. Geological Survey
- McLaughlin, R.J., Sarna-Wojcicki, A.M., Wagner, D.L., Fleck, R.J., Langenheim, V.E., Jachens, R.C., Clahan, K., and Allen, J.R., 2012. Evolution of the Rodgers Creek–Maacama right-lateral fault system and associated basins east of the northward-migrating Mendocino Triple Junction, northern California in Geosphere, v. 8, no. 2., p. 342-373.
- Nelson, A.R., Asquith, A.C., and Grant, W.C., 2004. Great Earthquakes and Tsunamis of the Past 2000 Years at the Salmon River Estuary, Central Oregon Coast, USA: Bulletin of the Seismological Society of America, Vol. 94, No. 4, pp. 1276–1292
- Plafker, G., 1972. Alaskan earthquake of 1964 and Chilean earthquake of 1960: Implications for arc tectonics in Journal of Geophysical Research, v. 77, p. 901-925.
- Rollins, J.C. and Stein, R.S., 2010. Coulomb stress interactions among M ≥ 5.9 earthquakes in the Gorda deformation zone and on the Mendocino Fault Zone, Cascadia subduction zone, and northern San Andreas Fault: Journal of Geophysical Research, v. 115, B12306, doi:10.1029/2009JB007117, 2010.
- Stoffer, P.W., 2006, Where’s the San Andreas Fault? A guidebook to tracing the fault on public lands in the San Francisco Bay region: U.S. Geological Survey General Interest Publication 16, 123 p., online at http://pubs.usgs.gov/gip/2006/16/
- USGS Quaternary Fault Database: http://earthquake.usgs.gov/hazards/qfaults/
- Wallace, Robert E., ed., 1990, The San Andreas fault system, California: U.S. Geological Survey Professional Paper 1515, 283 p. [http://pubs.usgs.gov/pp/1988/1434/].
- Wang, K., Wells, R., Mazzotti, S., Hyndman, R. D., and Sagiya, T., 2003. A revised dislocation model of interseismic deformation of the Cascadia subduction zone Journal of Geophysical Research, B, Solid Earth and Planets v. 108, no. 1.