
There were a couple interesting earthquakes offshore of El Salvador “today.” These earthquakes occurred along the Middle America Trench, a low spot in the ocean formed by the subduction of the Cocos plate beneath the Caribbean plate (a convergent plate boundary). The subduction zone here typically generates earthquakes that are the result of horizontal compression (e.g. thrust or reverse earthquakes). Due to the slightly oblique plate convergence, along with preexisting structures (?), there is a large strike-slip fault system in the upper plate (the Caribbean plate) here. These are called forearc sliver faults. As these faults step left and right, they create basins. The forearc sliver faults are also co-located with the magmatic arc (the volcanoes formed because of the subducting oceanic lithosphere).
The earthquakes today are interesting because they have extensional moment tensors (a.k.a. “dilatational”). As oceanic crust subducts, it can deform (bend) and experience extension in parts of the crust when it deforms. Also, the slab (another word for the lithosphere or crust) can also experience extension from the crust being pulled down due to gravity (probably one of the major causes of plate motions), called “slab pull.”
These earthquakes may be experiencing extension for the above two reason. Alternatively, these earthquakes could be in the upper plate where the plate is experiencing along-strike (in the direction parallel to the subduction zone fault trench) extension as a result of the forearc sliver faults stretching parts of the upper plate. The orientation of these earthquakes does not preclude either of these interpretations. These earthquakes have default depths, so it is difficult to know if these are in the downgoing slab or if they are in the upper plate (Caribbean plate).
Based on the seismicity from the past century (mostly M ~6 earthquakes in this region), these earthquakes are probably not foreshocks for a larger earthquake. But, a hundred years is far from enough data to really understand ANY fault system. Seismology (and plate tectonics for that matter) is just too young a science to understand these things. Maybe after a couple thousand years we will have enough data to be able to make meaningful forecasts.
There was an earthquake on 2016.11.24 to the southeast of today’s sequence. Here is my report for that earthquake.
Here are the USGS web pages for the earthquakes.
- 2017-05-09 14:15 M 5.2 This earthquake may be related, but probably not.
- 2017-05-12 10:41 M 6.2 the mainshock
- 2017-05-12 10:51 M 5.4 aftershock
- 2017-05-12 15:22 M 4.7 aftershock
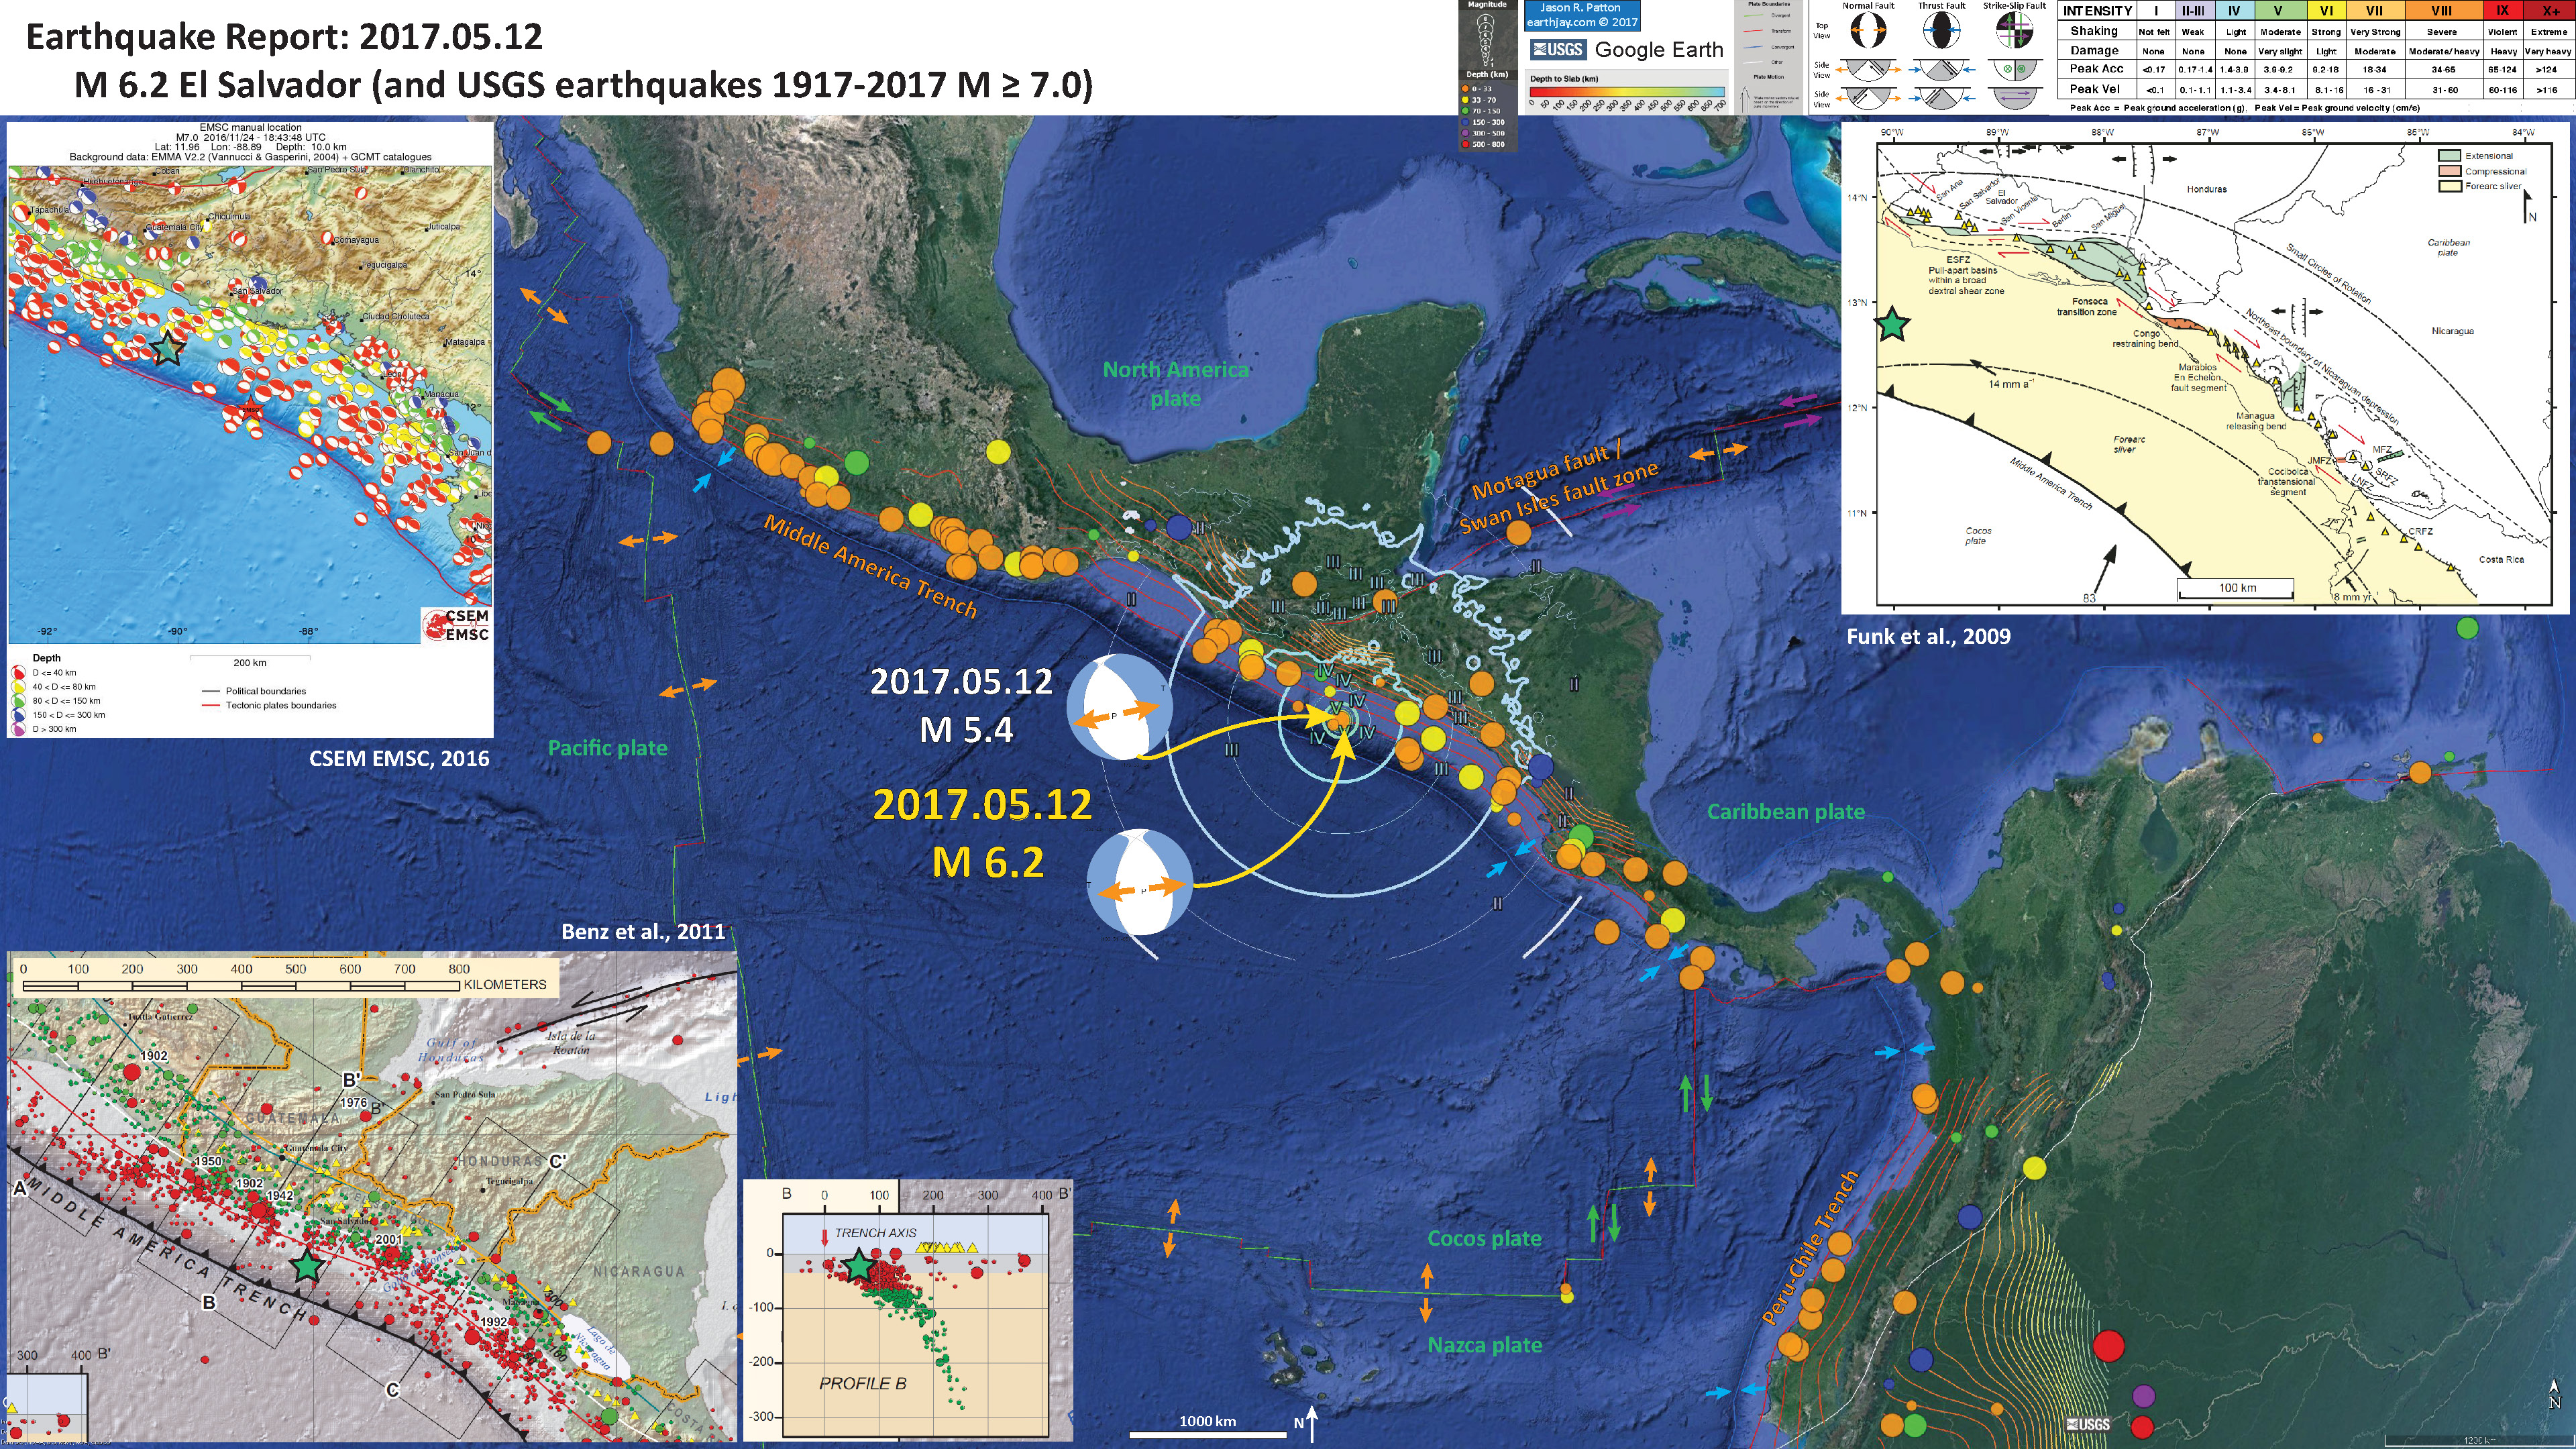
Below is my interpretive poster for this earthquake.
I plot the seismicity from the past month, with color representing depth and diameter representing magnitude (see legend). I include MMI contours for the M 6.2. I also include USGS seismicity for the past century. Here is the kml for these USGS earthquakes for magnitudes M ≥ 7.0 from 1917-2017 that I used to make this map.
- I placed a moment tensor / focal mechanism legend on the poster. There is more material from the USGS web sites about moment tensors and focal mechanisms (the beach ball symbols). Both moment tensors and focal mechanisms are solutions to seismologic data that reveal two possible interpretations for fault orientation and sense of motion. One must use other information, like the regional tectonics, to interpret which of the two possibilities is more likely.
- I also include the shaking intensity contours on the map. These use the Modified Mercalli Intensity Scale (MMI; see the legend on the map). This is based upon a computer model estimate of ground motions, different from the “Did You Feel It?” estimate of ground motions that is actually based on real observations. The MMI is a qualitative measure of shaking intensity. More on the MMI scale can be found here and here. This is based upon a computer model estimate of ground motions, different from the “Did You Feel It?” estimate of ground motions that is actually based on real observations.
- I include the slab contours plotted (Hayes et al., 2012), which are contours that represent the depth to the subduction zone fault. These are mostly based upon seismicity. The depths of the earthquakes have considerable error and do not all occur along the subduction zone faults, so these slab contours are simply the best estimate for the location of the fault. The hypocentral depth of the M 5.5 plots this close to the location of the fault as mapped by Hayes et al. (2012).
- In the lower left corner, I include a subset of figures from Benz et al. (2011). There is a map that shows USGS epicenters with dots colored by depth and magnitude represented by circle diameter. There is also a cross section for this region, just to the northwest of El Salvador. Cross section B-B’ shows the earthquake hypocenters along a profile displayed on the map. Note how the subduction zone dip steepens to the northeast. I place a green star in the general location of today’s M 6.2 earthquake.
- In the upper right corner is a tectonic summary figure from Funk et al. (2009). The authors suggest that there is a forearc sliver in this region. A forearc sliver is a large plate boundary scale strike-slip fault bounded block that is formed due to strain partitioning. When the relative plate motion at a subduction zone are not perpendicular to the megathrust fault, the motion that is perpendicular is accommodated by the megathrust fault. The plate motion that is not perpendicular to the subduction zone fault is accommodated by strike-slip faults parallel to the strike of the subduction zone fault. The authors place red arrows showing the relative motion along the plate bounding fault along the eastern boundary of this forearc sliver (these are called forearc sliver faults for obvious reasons). A classic example of a forearc sliver fault is the Sumatra fault along the Sunda subduction zone. Forearc sliver faults do not always bound a block like this and are not always parallel to the plate boundary. The Cascadia subduction zone has a series of forearc sliver faults offshore, but these are formed oblique to the plate boundary. For the case in cascadia, the plate margin parallel strain is accommodated by rotating blocks, not rigid blocks. As these blocks rotate in response to this shear couple, they rotate and form strike-slip faults between the blocks (forming “bookshelf” faults). Another plate where relative oblique motion creates rotating blocks is along the Aleutian subduction zone.
- In the upper left corner, I include a map from CSEM EMSC. This map was prepared for the 2016.11.24 El Salvador earthquake. They plot focal mechanisms for historic earthquakes in this region. One may observe that there are compression mechanisms associated with the megathrust and that there are strike-slip (shear) mechanisms associated with the strike-slip faults on land.
I include some inset figures in the poster.
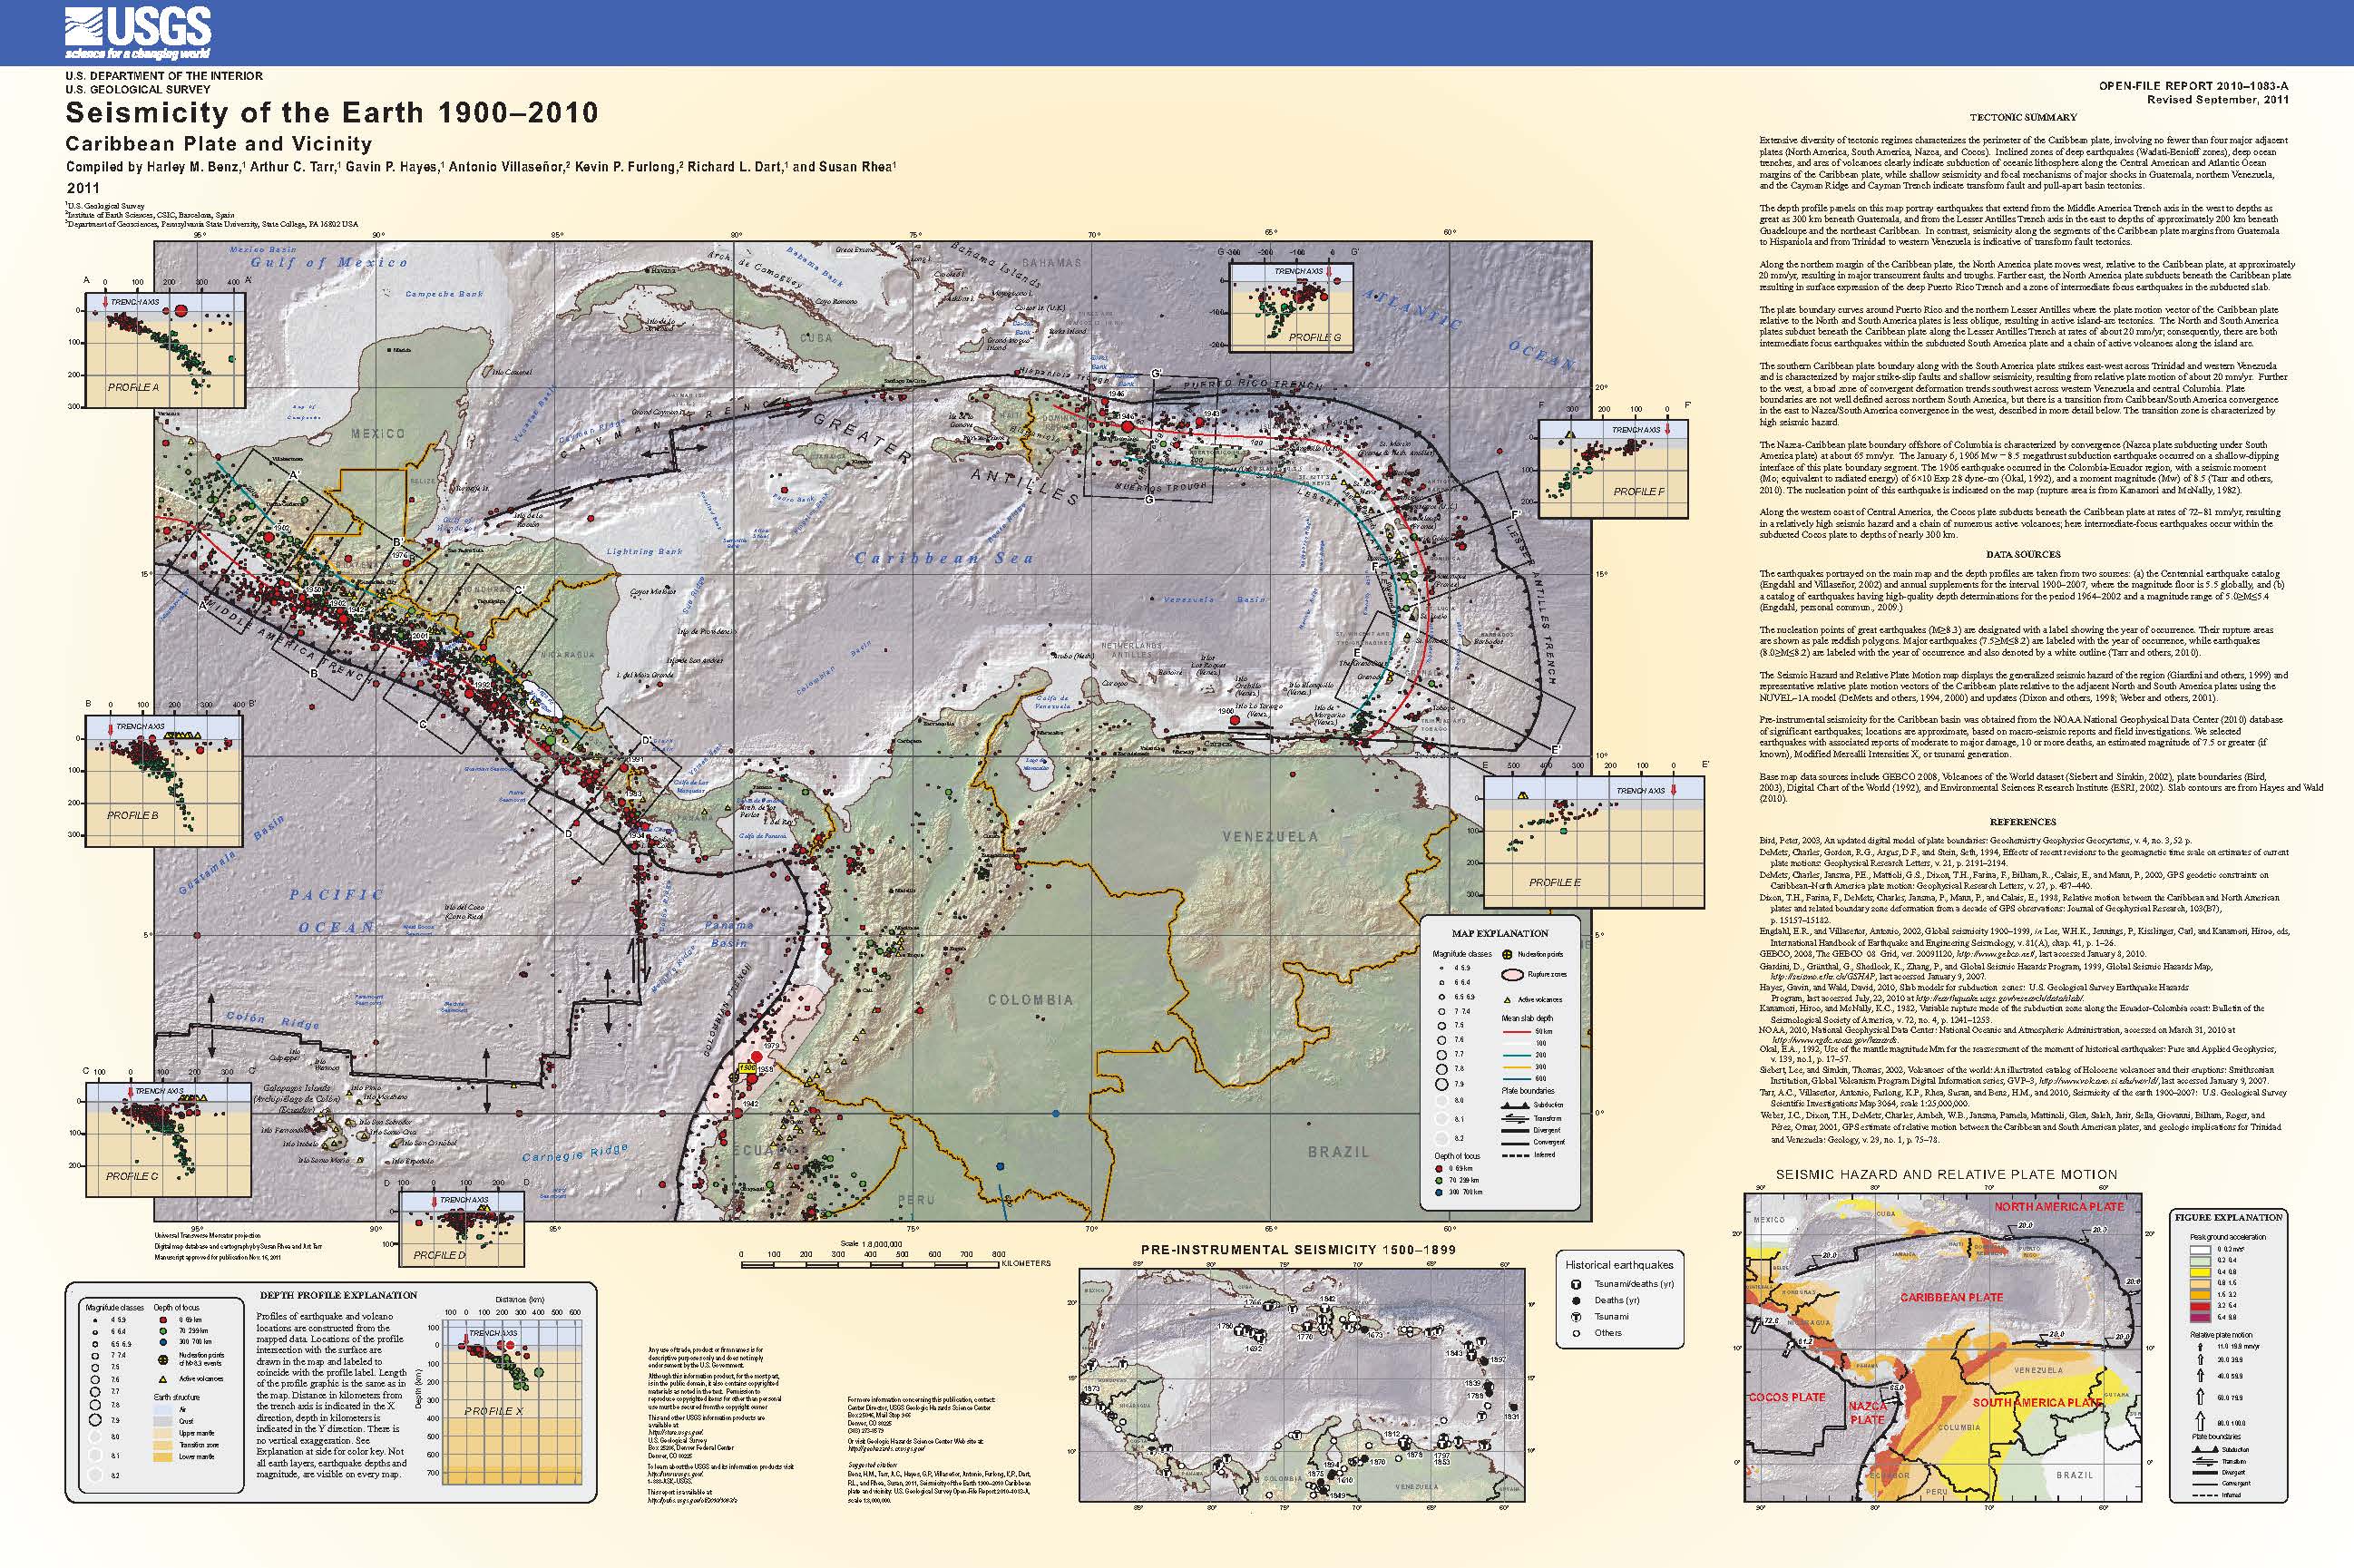
- Here is the “seismicity of the Earth” USGS series poster for this region. Click on the thumbnail below for the pdf version (13 MB pdf).
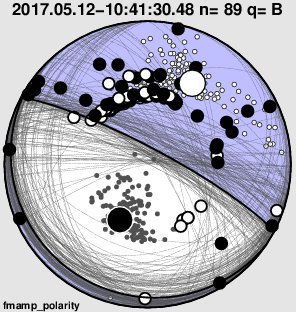
- Here is the focal mechanism from Anthony Lomax. This orientation and sense (compression) more aligns with what we might expect for earthquakes in this region, however, note that this is still a dilatational (extentional) mechanism.
- Here is the seismicity map and cross sections for the region to the southeast of El Salvador. The subduction zone in the El Salvador region is depicted by cross section B. Note that the subduction zone has a low angle dip in the shallow region of the fault, then steepens to 55 degrees to the east.
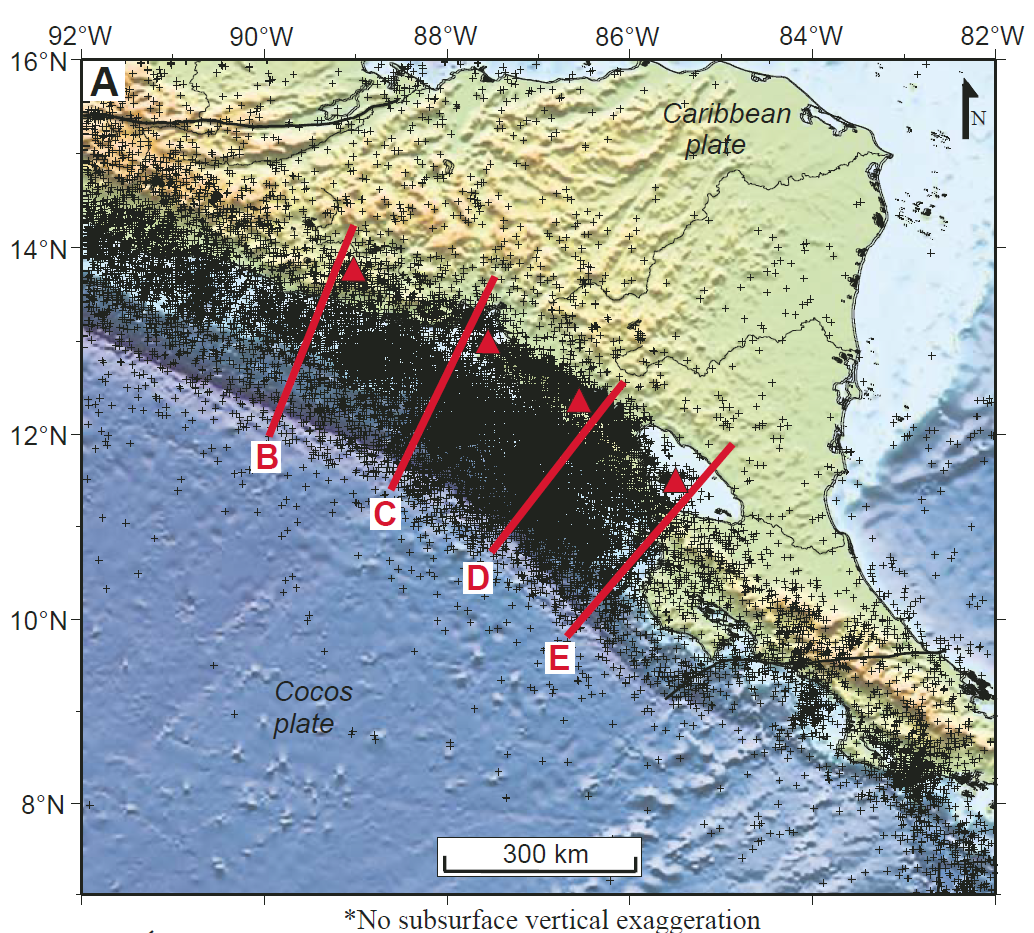

(A) Earthquake locations are from the National Earthquake Information Center (NEIC) and, in Nicaragua, were recorded by the local Nicaragua network from 1995 to 2003 operated by the Instituto Nicaraguense de Estudios Territoriales (INETER ). (B–E) Earthquake profiles are perpendicular to the Middle America Trench (MAT) and extend to the interior volcanic highlands of Central America. These profiles merge all earthquakes within a 50-km-wide swath along each transect. Seismic activity beneath the volcanic front in Nicaragua is more evident because of more data from local stations of the Nicaraguan seismic network. These shallow crustal earthquakes commonly occur within the upper 30 km of the crust and are concentrated within ~25 km of the active Central America volcanic front (CAVF).
- Here is the summary figure from Funk et al. (2009). This map shows the detailed fault mapping the authors prepared for their manuscript. Their observations include field mapping and seismic profiles. There are several parts of this forearc sliver fault system that show how the strike-slip system bends and steps. There are restraining bends (where the s-s fault generates compression) and releasing bends (where the s-s fault generates extension). These regions are colored red and green, respectively. In the Marabios En Exchelon segment of this map there are some plate margin obvlique extensional fault bounded basins. These appear to be formed by bookshelf style faulting.

Regional tectonic map of Central America emphasizing key structures described in this paper. The El Salvador fault zone (ESFZ) is characterized by a broad right-lateral shear zone accommodating transtensional motion that results in multiple pull-apart basins . A major transition zone occurs in the Gulf of Fonseca, where strike-slip fault zones along the Central American forearc sliver change strike from dominantly east-west strikes in El Salvador to northwesterly strikes in Nicaragua. A proposed restraining bend connects faults mapped in the Gulf of Fonseca with fault scarps deforming Cosiguina volcano and faults of the Central America volcanic front north of Lake Managua . Diffuse and poorly exposed faults parallel to the Central America volcanic front in northern Nicaraguan segment are inferred to represent a young fault boundary in which right-lateral shear is accommodated over a broad zone. This model proposes a young en echelon pattern of strike-slip and secondary faults based on secondary extensional features and fi ssure eruptions along the Marabios segment of the Central America volcanic front. Lake Managua and the Managua graben are interpreted to occur at a major releasing bend in the trend of the Nicaraguan depression and are marked by the curving surface trace of the Mateare fault interpreted from aeromagnetic data. Subsequent right-lateral strike-slip motion related to translation of the Central America forearc sliver may occur along these reactivated normal faults. The Lake Nicaragua segment of the Central America volcanic front is bounded by a normal fault (LNFZ—Lake Nicaragua fault zone) offsetting the Rivas anticline, the southeastward continuation of this normal fault into Costa Rica (CNFZ—Costa Rica fault zone), and a synthetic normal fault (SRFZ—San Ramon fault zone) that we discovered in our survey of Lake Nicaragua. Transverse faults (MFZ—Morrito fault zone, JMFZ—Jesus Maria fault zone) strike approximately east-west across the Central America volcanic front. North-south–trending rift zones are abundant in El Salvador but less common in Nicaragua and may also be controlled by regional east-west extension affecting the northwestern corner of the Caribbean plate.
- Here is a figure from a recently published summary of subduction zones from Goes et al. (2017). Note the various factors and forces to which a subducting slab is exposed.
![]()
Schematic diagram showing the main forces that affect how slabs interact with the transition zone. The slab sinks driven by its negative thermal buoyancy (white filled arrows). Sinking is resisted by viscous drag in the mantle (black arrows) and the frictional/viscous coupling between the subducting and upper plate (pink arrows). To be able to sink, the slab must bend at the trench. This bending is resisted by slab strength (curved green arrow). The amount the slab needs to bend depends on whether the trench is able to retreat, a process driven by the downward force of the slab and resisted (double green arrow) by upper-plate strength and mantle drag (black arrows) below the upper plate. At the transition from ringwoodite to the postspinel phases of bridgmanite and magnesiowüstite (rg – bm + mw), which marks the interface between the upper and lower mantle, the slab’s further sinking is hampered by increased viscous resistance (thick black arrows) as well as the deepening of the endothermic phase transition in the cold slab, which adds positive buoyancy (open white arrow) to the slab. By contrast, the shallowing of exothermic phase transition from olivine to wadsleyite (ol-wd) adds an additional driving force (downward open white arrow), unless it is kinetically delayed in the cold core of the slab (dashed green line), in which case it diminishes the driving force. Phase transitions in the crustal part of the slab (not shown) will additionally affect slab buoyancy. Buckling of the slab in response to the increased sinking resistance at the upper-lower mantle boundary is again resisted by slab strength.
- This is a summary figure showing subducting slabs and where they experience downdip extension vs downdip compression (Goes et al., 2017). Their cross section for the Cocos plate does not show any region of downdip extension. This slightly favors the upper plate forearc along-strike extensional interpretation for today’s earthquakes.
![]()
Summary of morphologies of transition-zone slabs as imaged by tomographic studies and their Benioff stress state. Arrows on the map indicate the approximate locations of the cross sections shown around the map, with their points in downdip direction. Blue shapes are schematic representations of slab morphologies (based on the extent of fast seismic anomalies that were tomographically resolvable from the references listed). Horizontal black lines indicate the base of the transition zone (~660 km depth). For flattened slabs, the approximate length of the flat section is given in white text inside the shapes. For penetrating slabs, the approximate depth to which the slabs are continuous is given in black text next to the slabs. Circles inside the slabs indicate whether the mechanisms of earthquakes at intermediate (100–350 km) and deep (350–700 km) are predominantly downdip extensional (black) or compressional (white). Stress states are from the compilations of Isacks and Molnar (1971), Alpert et al. (2010), Bailey et al. (2012), complemented by Gorbatov et al. (1997) for Kamchatka, Stein et al. (1982) for the Antilles, McCrory et al. (2012) for Cascadia, Papazachos et al. (2000) for the Hellenic zone, and Forsyth (1975) for Scotia. The subduction zones considered are (from left to right and top to bottom): RYU—Ryukyu, IZU—Izu, HON—Honshu, KUR—Kuriles, KAM—Kamchatka, ALE—Aleutians, ALA—Alaska, CAL—Calabria, HEL—Hellenic, IND—India, MAR—Marianas, CAS—Cascadia, FAR—Farallon, SUM—Sumatra, JAV—Java, COC—Cocos, ANT—Antilles, TON—Tonga, KER—Kermadec, CHI—Chile, PER—Peru, SCO—Scotia. Numbers next to the red subduction zone codes refer to the tomographic studies used to define the slab shapes: 1—Van der Hilst et al., 1991; Fukao et al., 1992; 2—Bijwaard et al., 1998; Hafkenscheid et al., 2001; Hafkenscheid et al., 2006; 3—Fukao et al., 2001; Fukao et al., 2009; Fukao and Obayashi, 2013; 4—Bunge and Grand, 2000; Grand, 2002; 5—Karason and Van der Hilst, 2000; Replumaz et al., 2004; Li et al., 2008; 6—Miller et al., 2005; Miller et al., 2006; 7—Gorbatov et al., 2000; 8—Hall and Spakman, 2015; 9—Van der Hilst, 1989; Grand et al., 1997; Ren et al., 2007; 10—Van der Lee and Nolet, 1997; Schmid et al., 2002; 11—Sigloch et al., 2008; Sigloch, 2011; 12—Simmons et al., 2012; 13—Gorbatov and Fukao, 2005; 14—Van der Hilst, 1995; Schellart and Spakman, 2012; 15—Spakman et al., 1993; Wortel and Spakman, 2000; Piromallo and Morelli, 2003.
- Here is a figure from Dewey et al. (2004) that shows a cross section of earthquake hypocenters with symbols representing their mechanism type. There was an earthquake sequence in 2001 that had an extensional mechanism. This supports the interpretation that today’s M 6.2 sequence is in the downgoing slab.
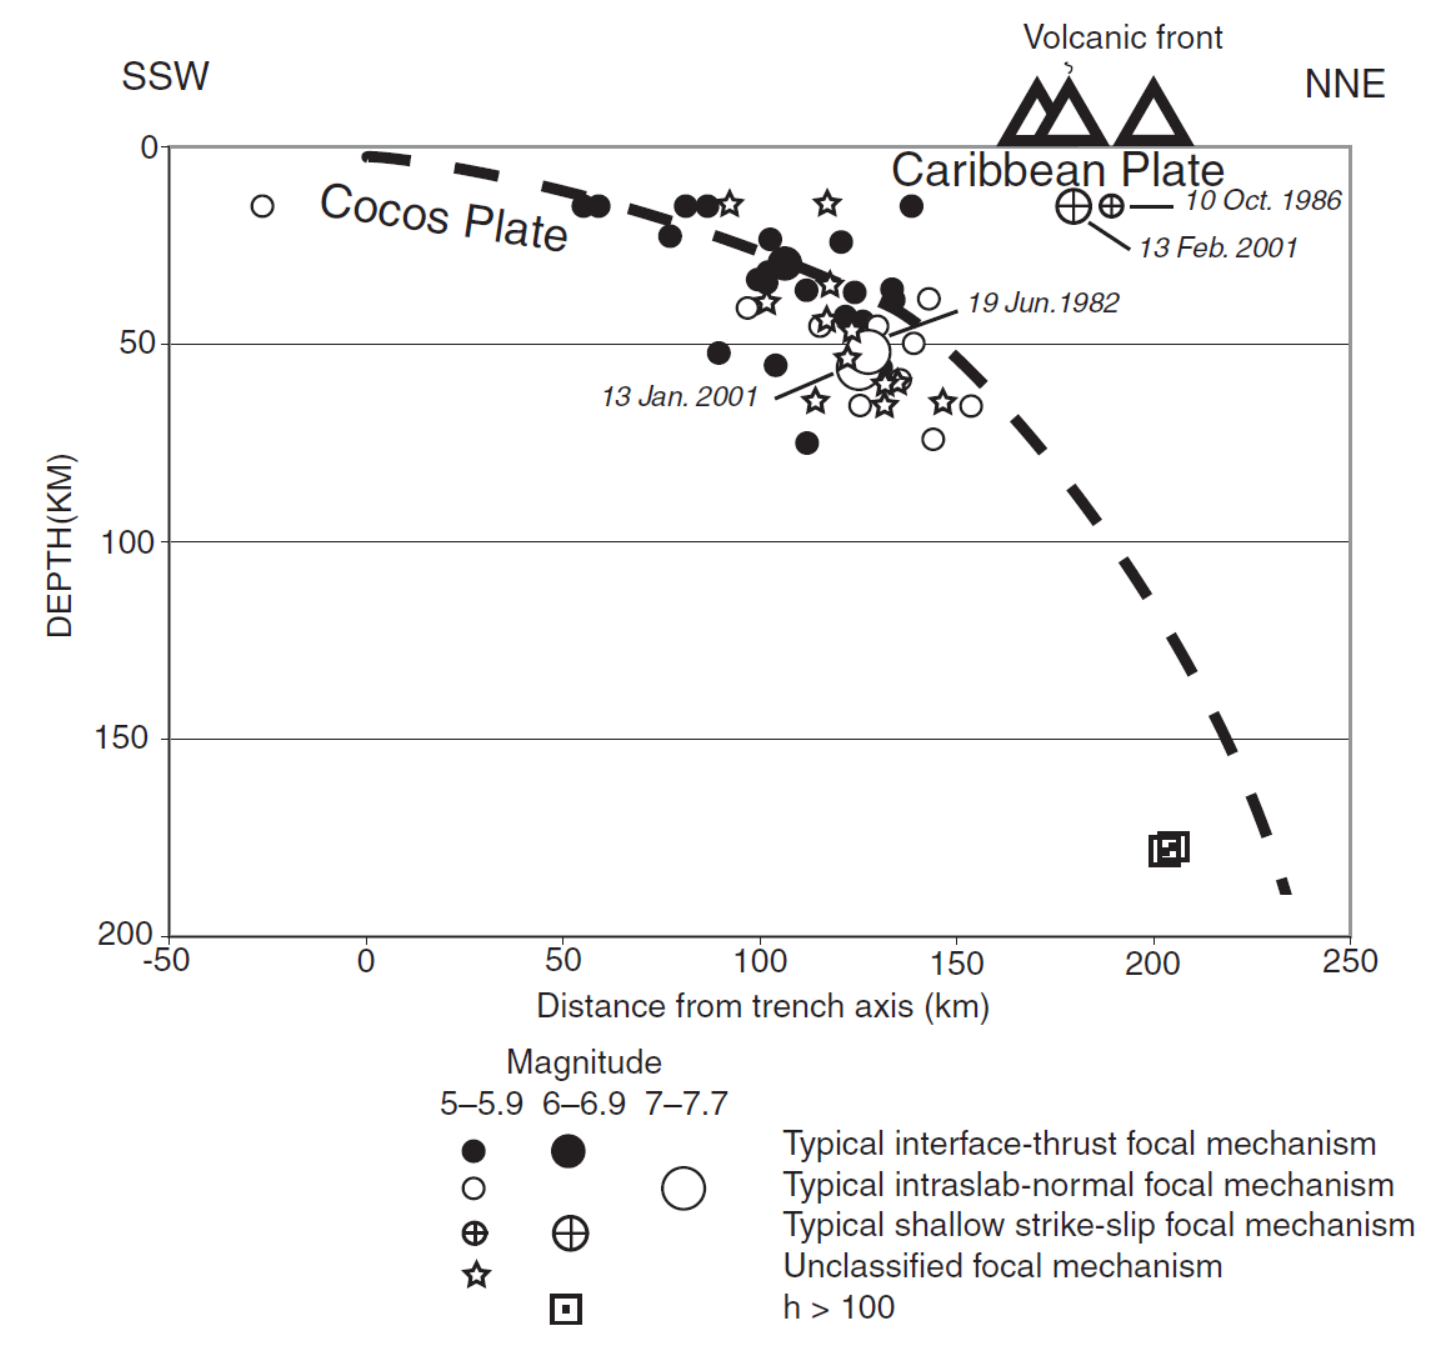
Cross section of earthquake hypocenters, 1978–April 2001, classified by focal mechanism as determined by the Harvard CMT methodology (Dziewonski et al., 1981). Events are those that lie within the box labeled “Fig. 5” on Figure 4. Hypocenters of the most destructive El Salvadoran earthquakes since 1978 are labeled by their dates. Shallow-focus earthquakes for which the hypocentroid cannot be accurately determined by Harvard CMT methodology are assigned default depths of 15 km.
- 2017.05.12 M 6.2 El Salvador
- 2017.03.29 M 5.7 Gulf of California
- 2016.11.24 M 7.0 El Salvador
- 2016.04.29 M 6.6 East Pacific Rise / MAT
- 2016.01.21 M 6.6 Mexico
- 2015.09.13 M 6.6 Gulf California
- 2015.09.13 M 6.6 Gulf California Update #1
- 2013.10.20 M 6.4 Gulf California
Central America Earthquakes
General Overview
Earthquake Reports
References
- Benz, H.M., Tarr, A.C., Hayes, G.P., Villaseñor, Antonio, Furlong, K.P., Dart, R.L., and Rhea, Susan, 2011. Seismicity of the Earth 1900–2010 Caribbean plate and vicinity: U.S. Geological Survey Open-File Report 2010–1083-A, scale 1:8,000,000.
- Dewey, J.W., White, R.A., and Hernández, D.A., 2004. Seismicity and tectonics of El Salvador in Rose, W.I., Bommer, J.J., López, D.L., Carr, M.J., and Major, J.J., eds., Natural hazards in El Salvador: Boulder, Colorado, Geological Society of America Special Paper 375, p. 363–378.
- Funk, J., Mann, P., McIntosh, K., and Stephens, J., 2009. Cenozoic tectonics of the Nicaraguan depression, Nicaragua, and Median Trough, El Salvador, based on seismic-reflection profiling and remote-sensing data in GSA Bulletin, v. 121, no. 11/12, p. 1491-1521.
- Goes, S., Agrusta, R., van Hunen, J., Garel, F., 2017. Subduction-transition zone interaction: A review in Geosphere, v. 13, no. 3, doi:10.1130/GES01476.1
- Hayes, G. P., D. J. Wald, and R. L. Johnson, 2012. Slab1.0: A three-dimensional model of global subduction zone geometries, J. Geophys. Res., 117, B01302, doi:10.1029/2011JB008524.
- Martínez-Díaz, J.A., Álvarez-Gómez, J.A., Benito, B., and Hernández, D., 2004. Triggering of destructive earthquakes in El Salvador in GSA Bulletin, v. 32., no. 1, p. 65-68.