There were two interesting earthquakes near the northern tip of the Island of Sumatra whilst I was off on a field trip with some HSU geology students. So, I think it prudent to review these earthquakes now.
These earthquakes happened along the convergent plate boundary that is formed by the oblique subduction of the India-Australia plate beneath the Sunda plate (part of Eurasia). The India-Australia plate has numerous north-south striking fracture zones that are reactivated as normal faults when they reach the subduction trench (where the subducting plate flexes, causing bending and extension in the upper part of the plate). These fracture zones are initially strike-slip (or transform) faults.
In 2004 there was a Great megathrust earthquake (M =9.0)that triggered a catastrophic and deadly trans-oceanic tsunami. Three months later, in 2005, there was a triggered Great earthquake (M = 8.6), which also caused a tsunami, but a much smaller one for various reasons. The 2004 M 9.2 earthquake provided some ground breaking (sorry for the pun) advancements in our knowledge of the earth. One new observation is that this earthquake ruptured into the mantle, previously thought to behave in a ductile manner, so not capable of brittle failure during an earthquake. Earthquake reports for some of the earthquakes discussed on this page are listed at the bottom of the page.
In 2012, there was a series of Great earthquakes to the west of these 2004 & 2005 subduction zone earthquakes in a region that experienced increased strain following the 2004/2005 earthquakes. These two earthquakes initially appeared to have ocurred on one of these fracture zone faults. However, upon further investigations (including various analyses and aftershock analysis), these two earthquakes were actually along faults ~orthogonal to the fracture zones. They were also very very deep, also probably occurring in the mantle! But, the crust is really thick here (possibly the thickest oceanic crust in the world, associated with the ninetyeast ridge. The 90E ridge is thickened because the I-A plate floated over a hotspot, causing it to be thicker). The larger of the two had a magnitude of M = 8.6, which is currently the largest strike-slip earthquake ever recorded on modern seismometers. Later, on 2016.03.02, there was another strike-slip fault in the I-A plate. Assistant Professor Wei Shengi (Earth Observatory of Singapore) derived some slip models for this earthquake and chose a slip model based on an East-West fault, making it a right lateral strike-slip earthquake (EOS, 2016).
- 2017.03.17 02:51 UTC M 6.0
- 2017.03.17 13:13 UTC M 5.5
Here are the USGS websites for these two earthquakes.
There was an earthquake with a magnitude of M 6.0 that is just west of the tip of the megathrust fault, so is clearly in the India plate west of the subduction zone. This earthquake occurred on a strike-slip fault and is oriented similar to the 2012 and 2016 earthquakes. Like the 2016 earthquake, I am not sure which nodal plane is the fault plane and which is the auxiliary fault plane.
About 10 hours later, there was an M 5.5 earthquake that has a hypocentral depth of 41.2 km. This depth is fully consistent with the depth of the subduction zone megathrust fault here (Hayes et al., 2012). The moment tensor is consistent with a thrust fault and the fault plane is probably the northeast shallowly dipping nodal plane.
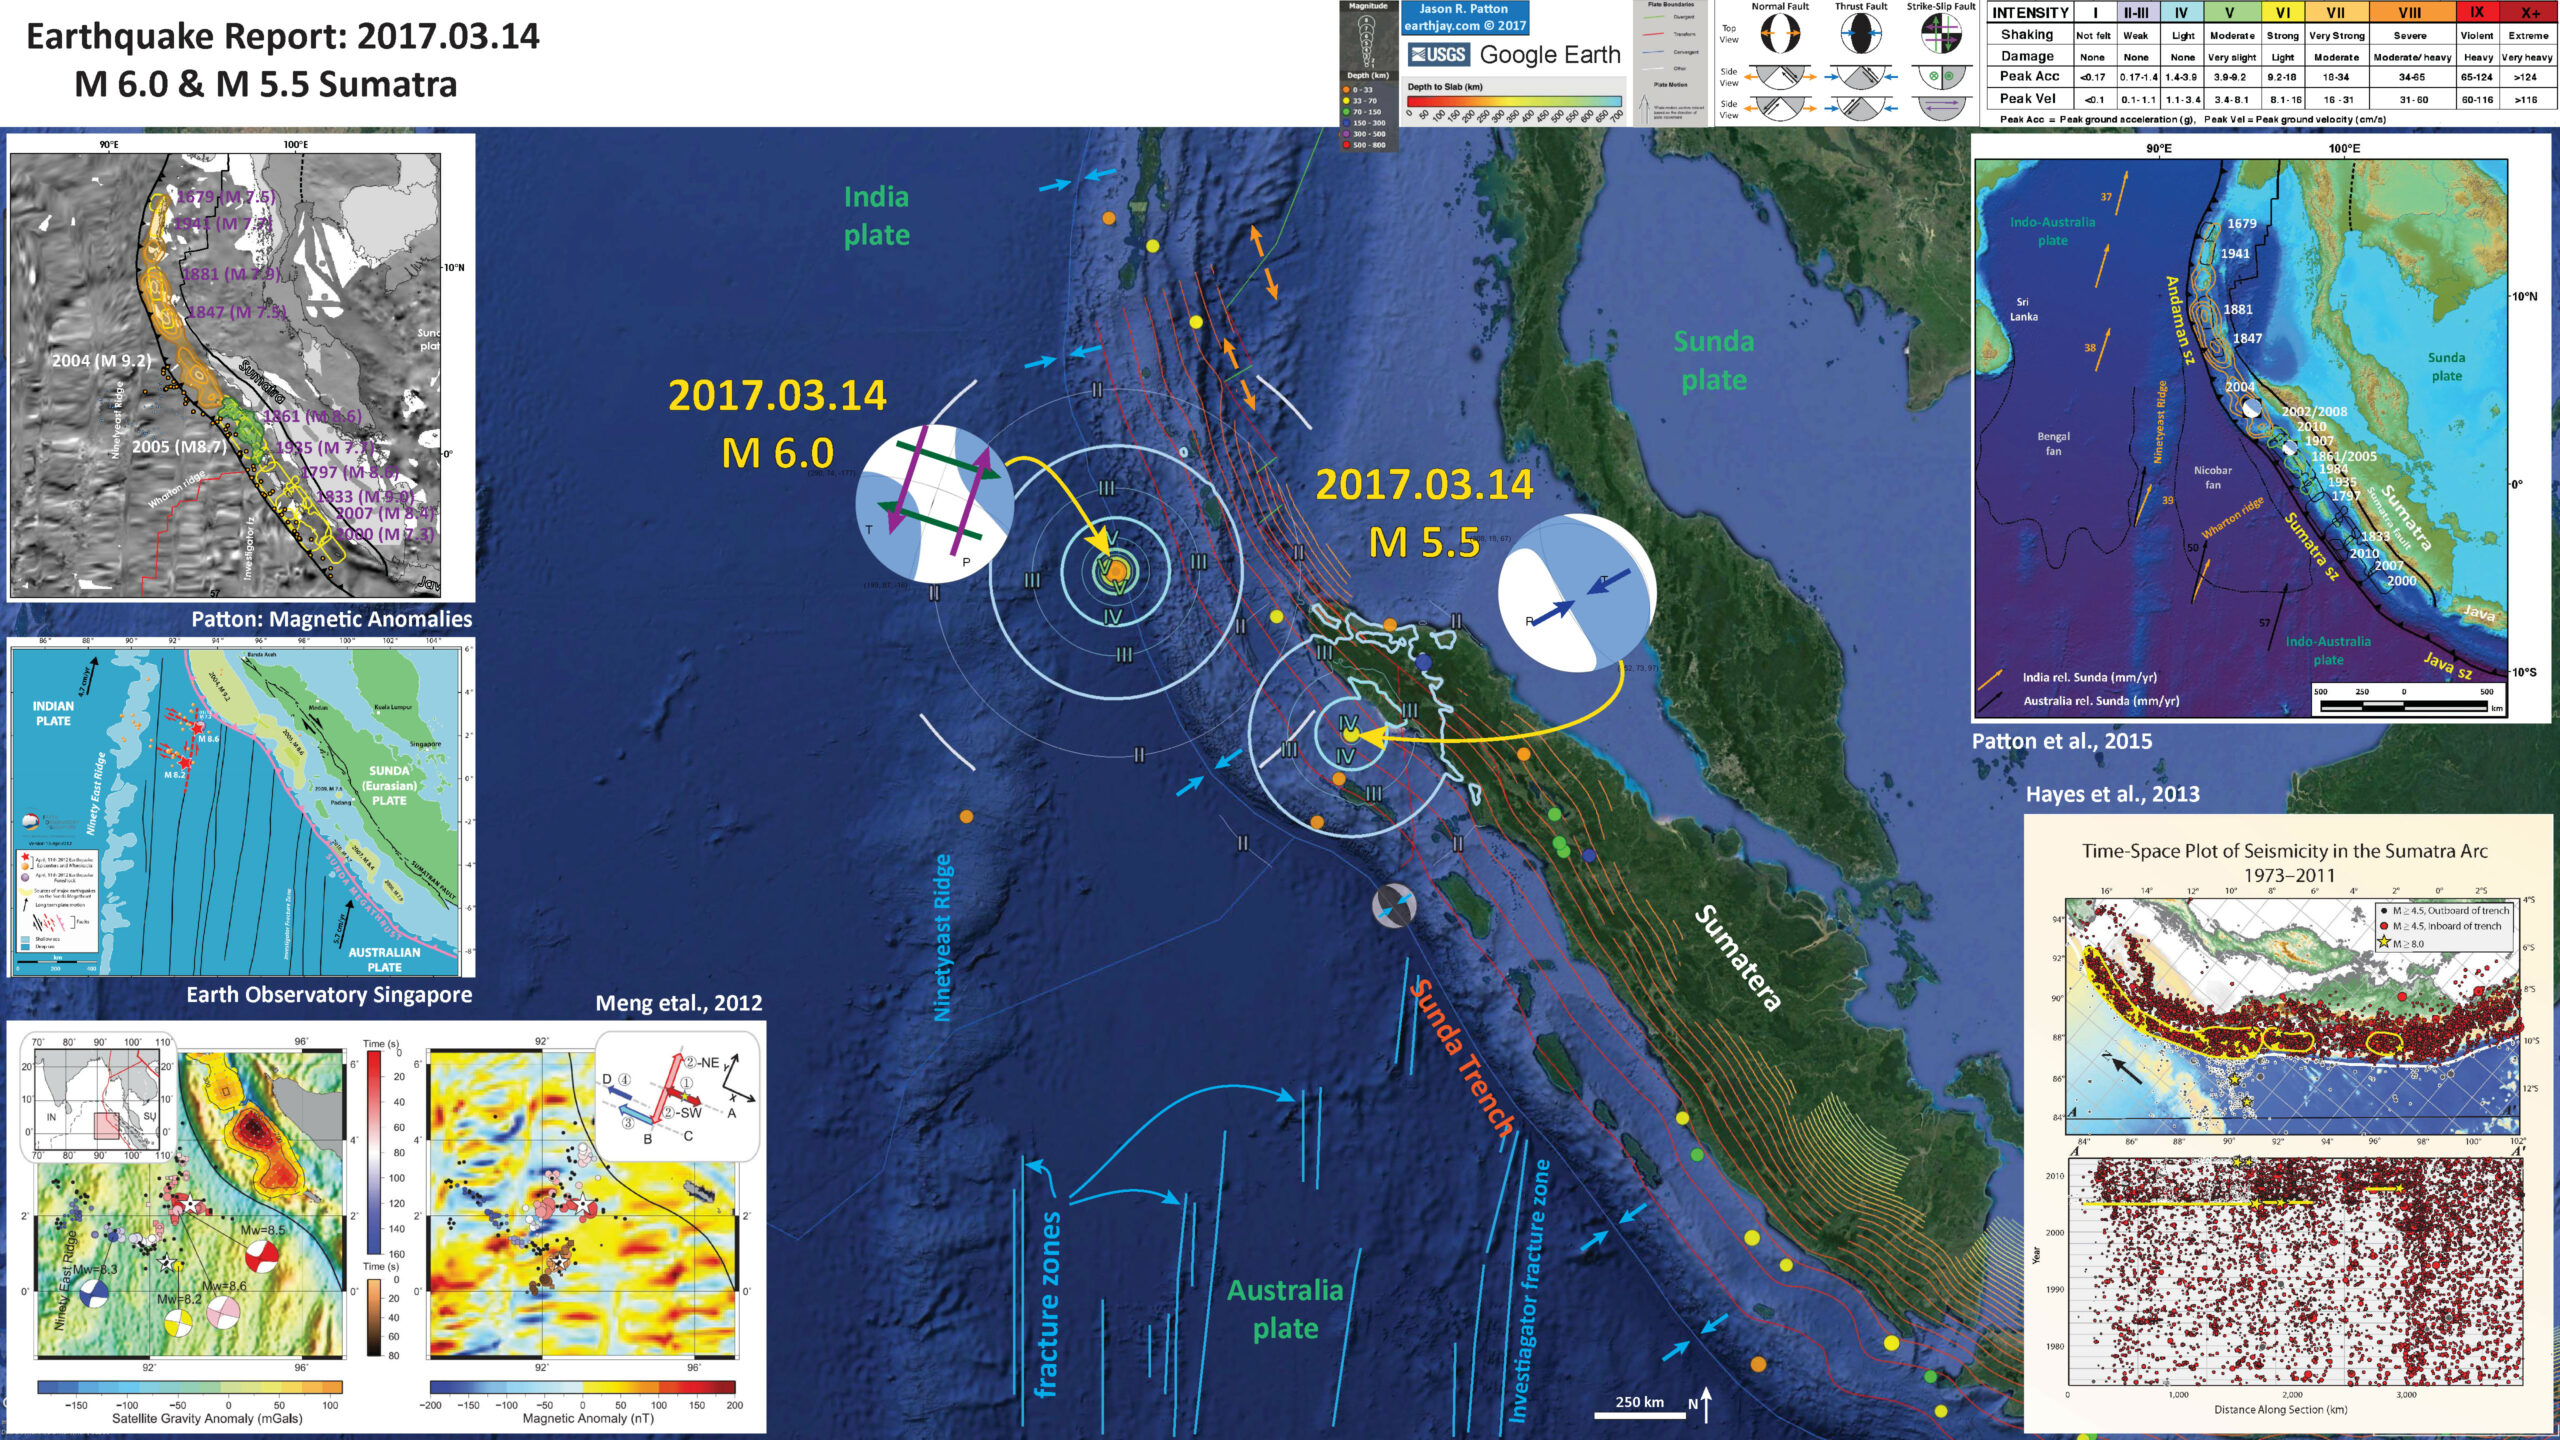
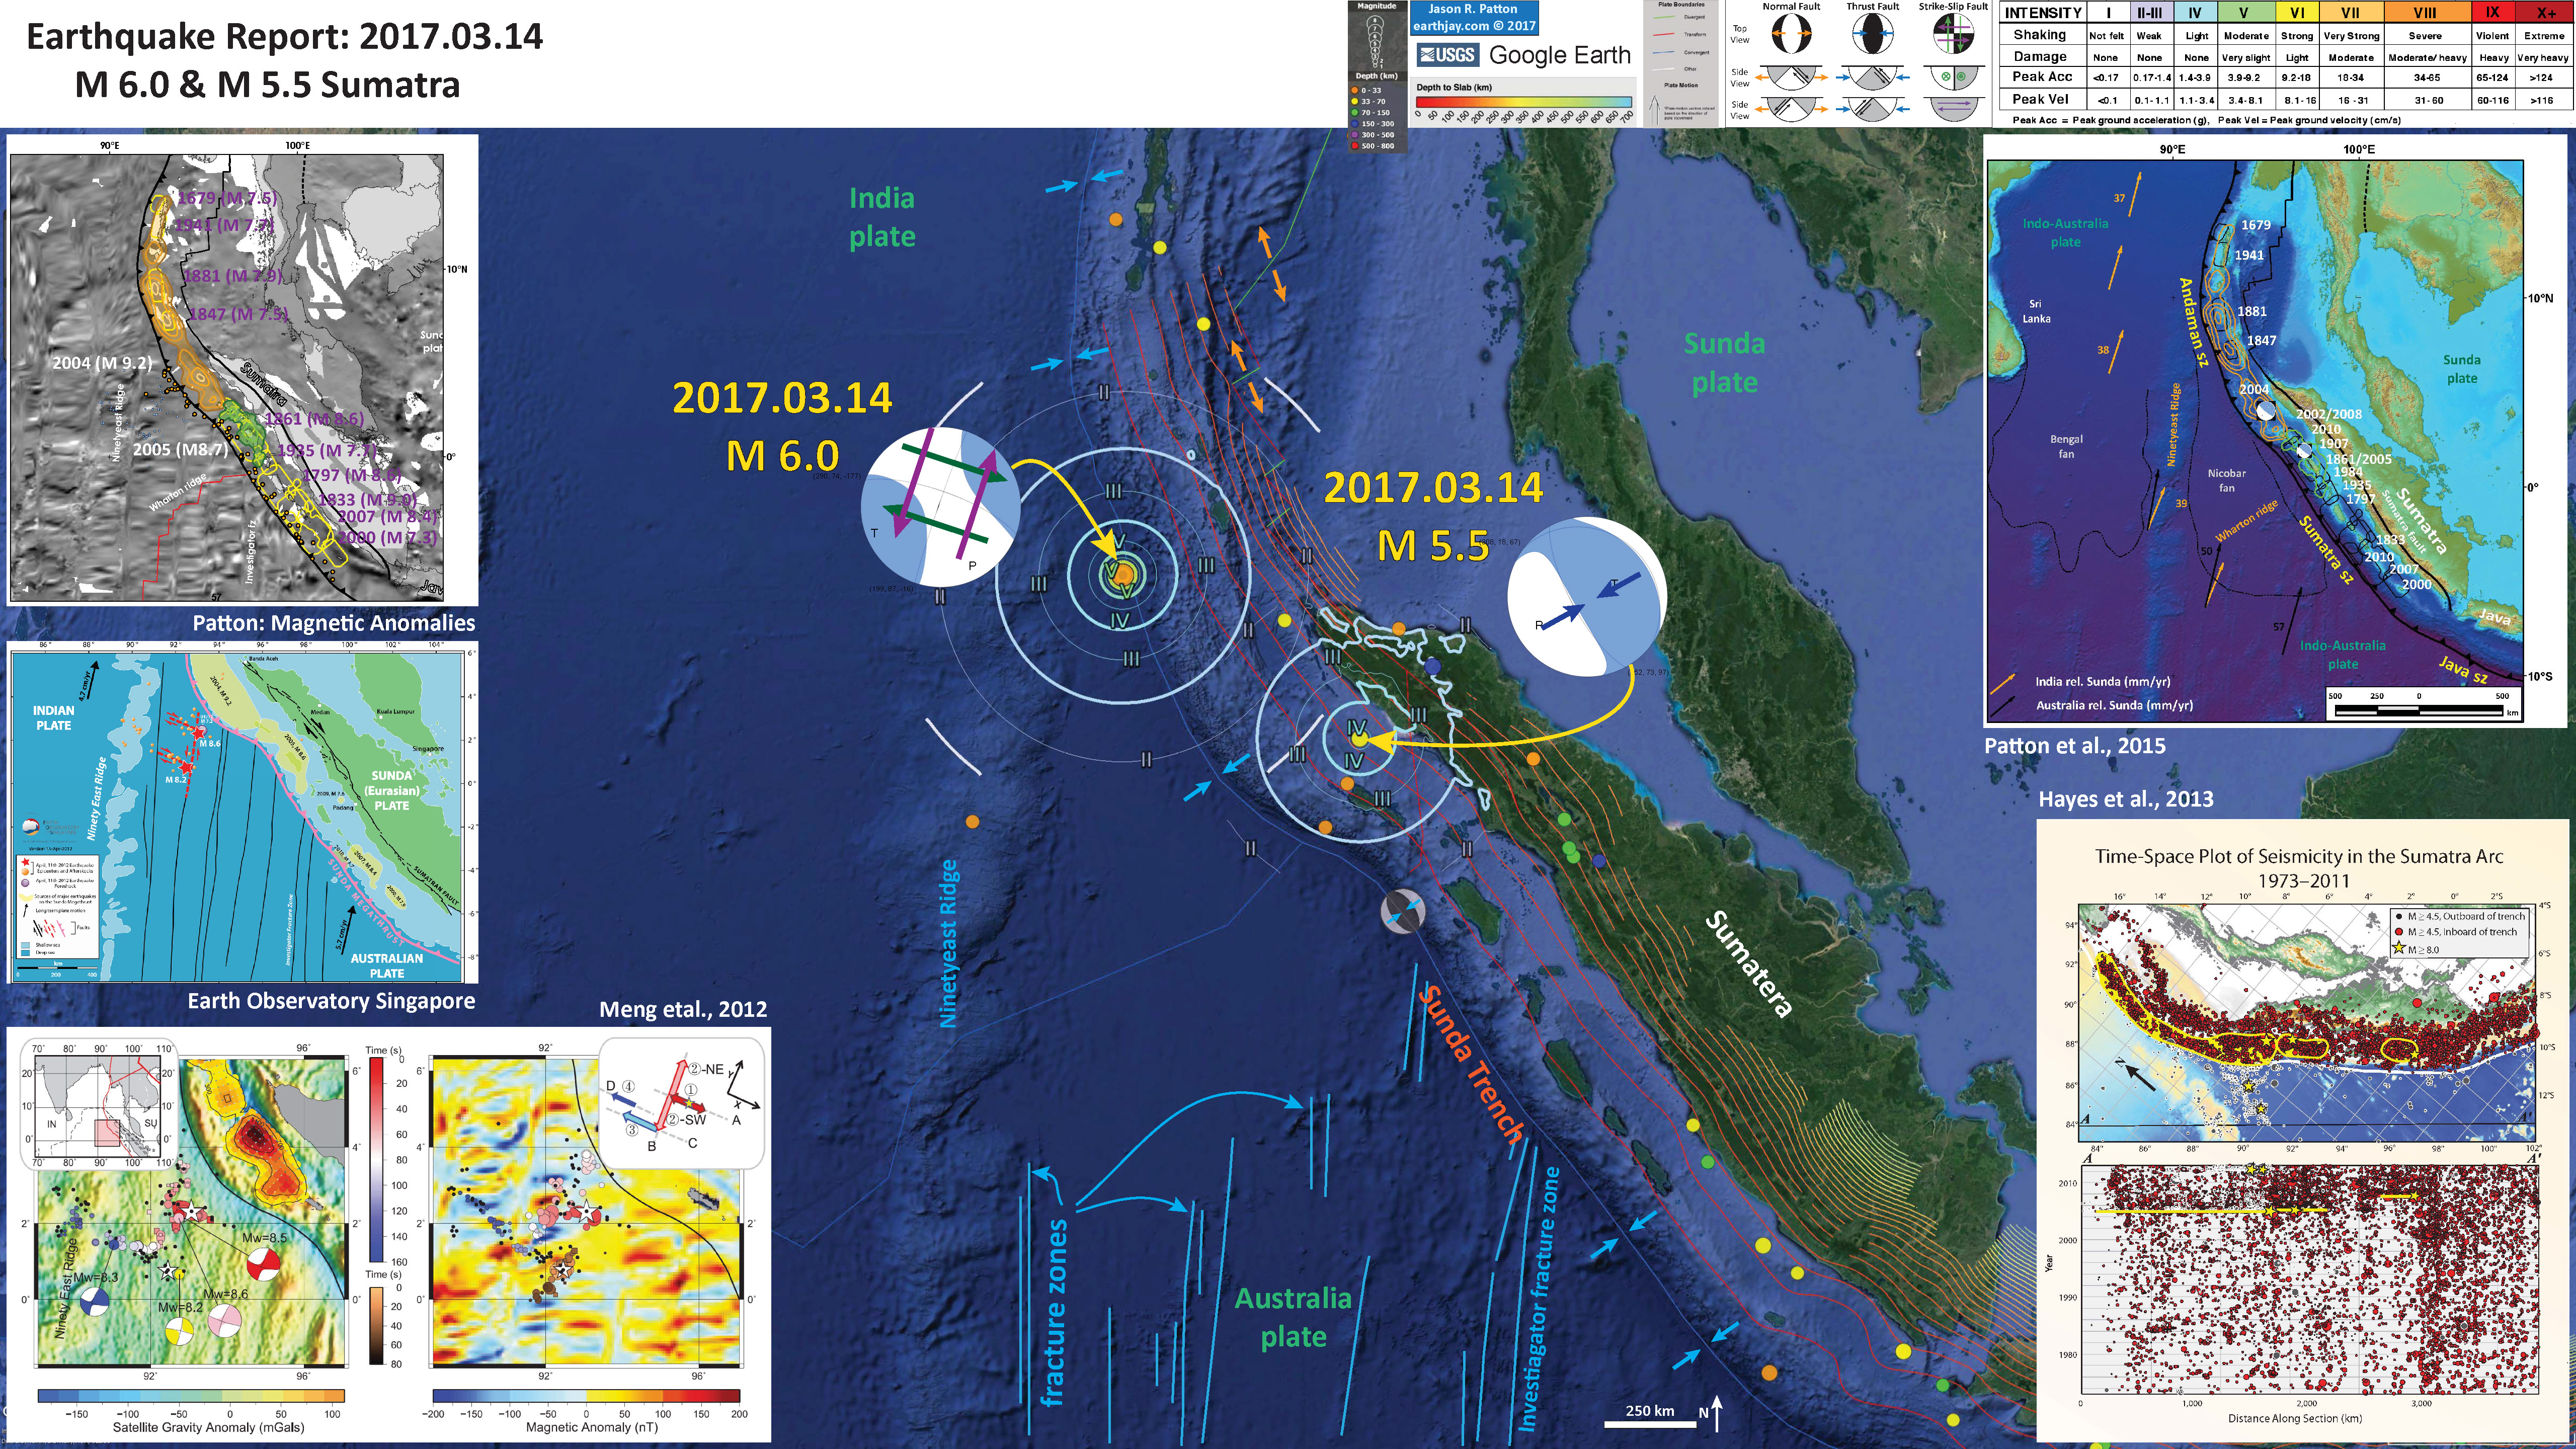
Below is my interpretive poster for this earthquake.
I plot the seismicity from the past month, with color representing depth and diameter representing magnitude (see legend). I include the USGS moment tensors from these earthquakes.
- I placed a moment tensor / focal mechanism legend on the poster. There is more material from the USGS web sites about moment tensors and focal mechanisms (the beach ball symbols). Both moment tensors and focal mechanisms are solutions to seismologic data that reveal two possible interpretations for fault orientation and sense of motion. One must use other information, like the regional tectonics, to interpret which of the two possibilities is more likely. The moment tensor for the M 6.0 compares well with other Wharton Basin earthquakes from the past (e.g. 2012 & 2016). The triggered M 5.5 earthquake was instead possibly a subduction zone earthquake.
- I also include the shaking intensity contours on the map. These use the Modified Mercalli Intensity Scale (MMI; see the legend on the map). This is based upon a computer model estimate of ground motions, different from the “Did You Feel It?” estimate of ground motions that is actually based on real observations. The MMI is a qualitative measure of shaking intensity. More on the MMI scale can be found here and here. This is based upon a computer model estimate of ground motions, different from the “Did You Feel It?” estimate of ground motions that is actually based on real observations.
- I include the slab contours plotted (Hayes et al., 2012), which are contours that represent the depth to the subduction zone fault. These are mostly based upon seismicity. The depths of the earthquakes have considerable error and do not all occur along the subduction zone faults, so these slab contours are simply the best estimate for the location of the fault. The hypocentral depth of the M 5.5 plots this close to the location of the fault as mapped by Hayes et al. (2012).
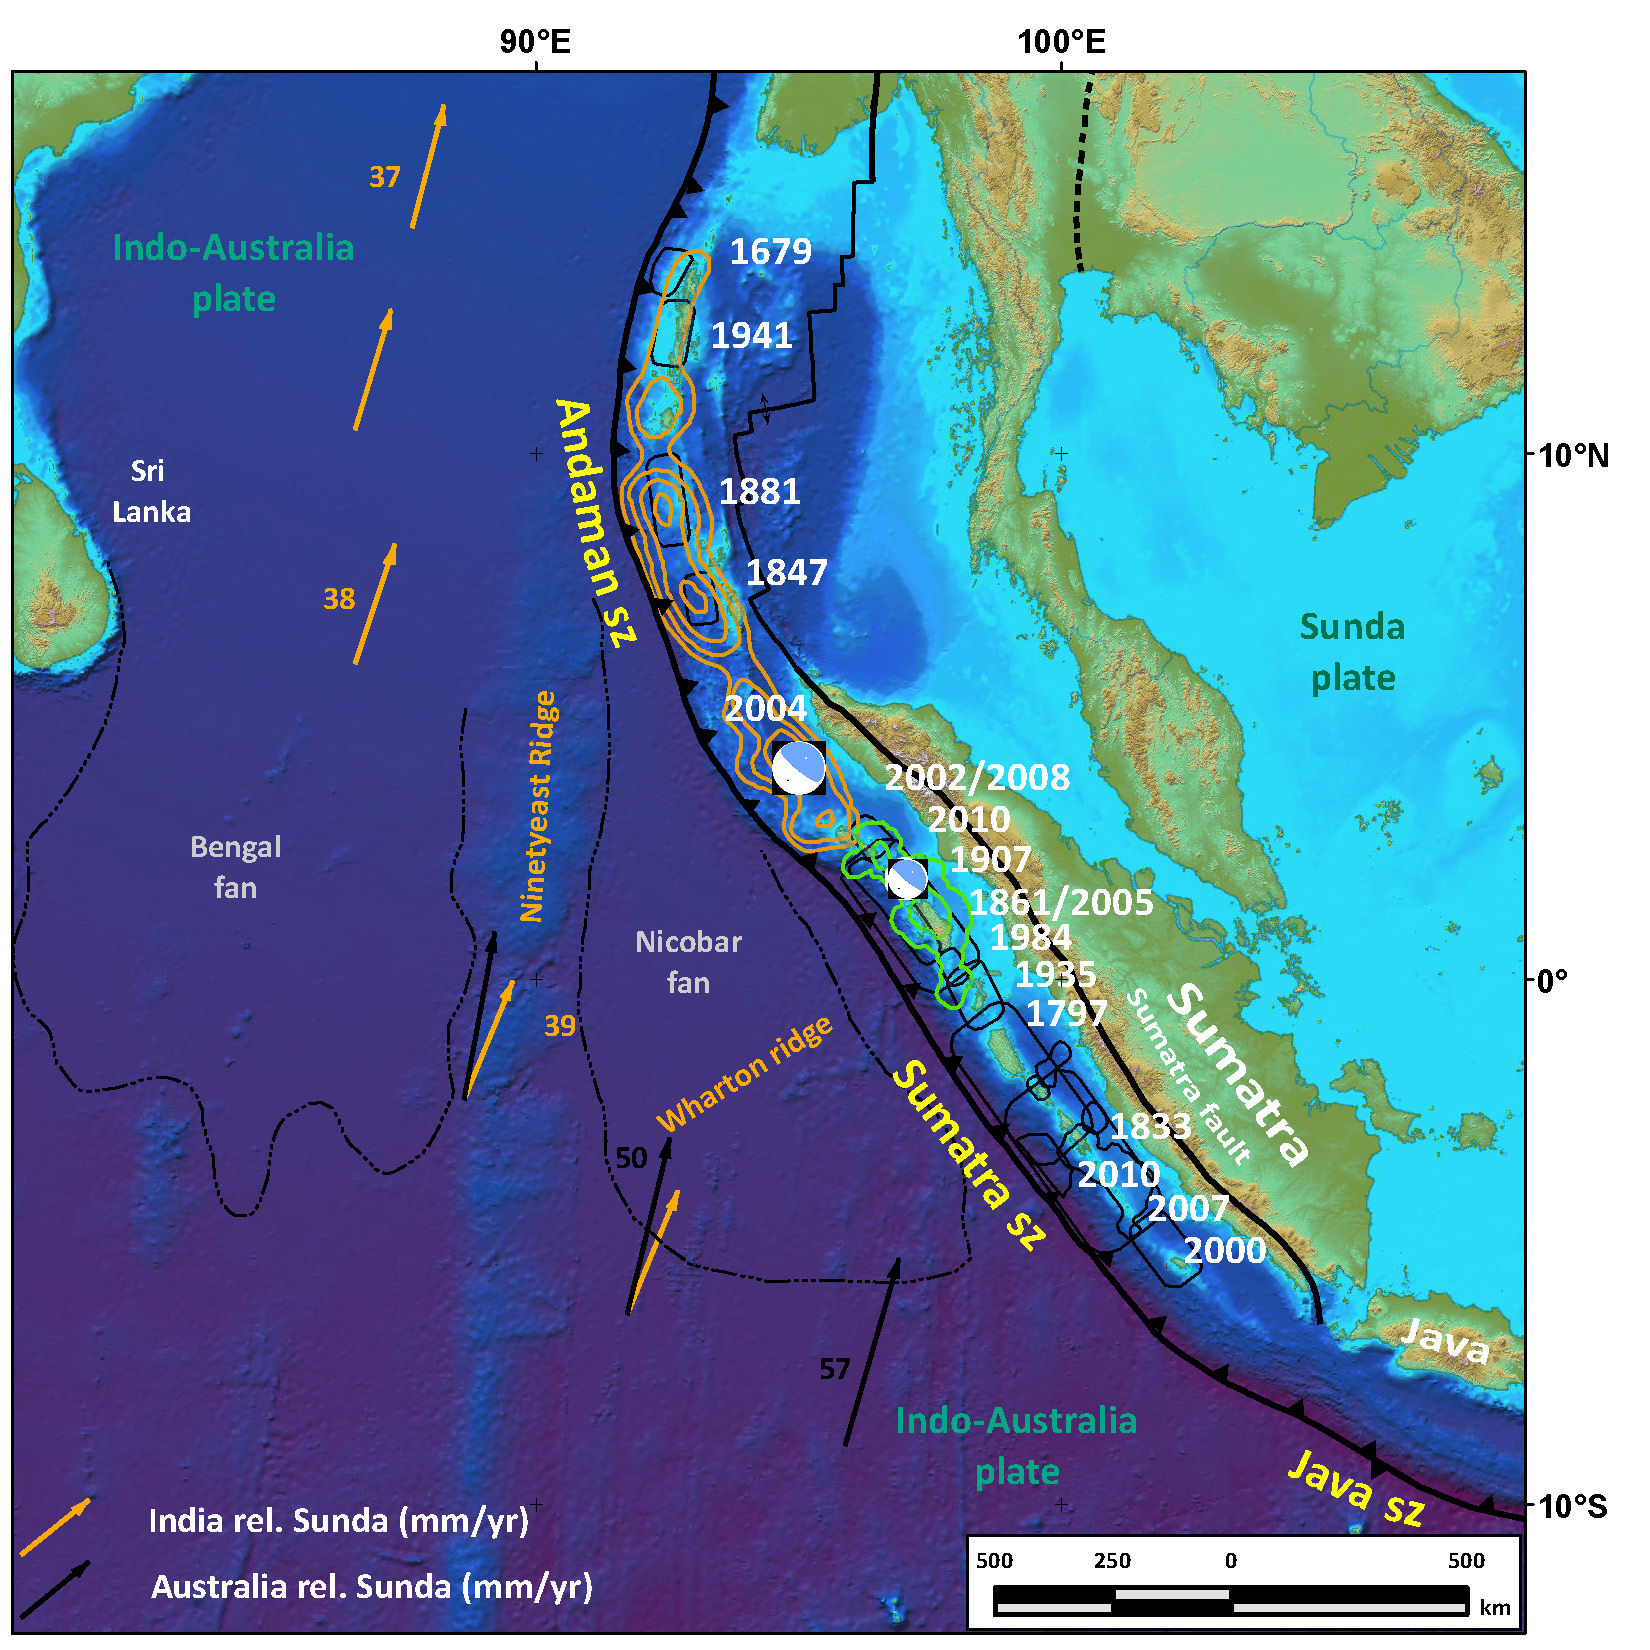
- In the upper right corner I include a map showing the plate tectonics of the region as well as earthquake rupture regions for historic subduction zone earthquakes. Bathymetry and topography data come from the Smith and Sandwell (1997) Space Shuttle Radar Topography (SRTM) data set. The India-Australia plate subducts northeastward beneath the Sunda plate (part of Eurasia; sz–subduction zone). Orange vectors plot India plate movement relative to Sunda, and black vectors plot Australia relative to Sunda (global positioning system velocity based on Nuvel-1A; Bock et al., 2003; Subarya et al., 2006). Historic ruptures (Bilham, 2005; Malik et al., 2011) are plotted in grey, calendar years are in white. The 2004 and 2005 slip contours are shown orange and green, respectively (Chlieh et al., 2007, fig. 11 therein; Chlieh et al., 2008, figure 20 therein). Bengal and Nicobar fans cover structures of the India-Australia plate in the northern part of the map; are dashed black lines delimit their southern boundaries (Stow et al., 1990). The 2004 and 2005 earthquake focal mechanisms are plotted.
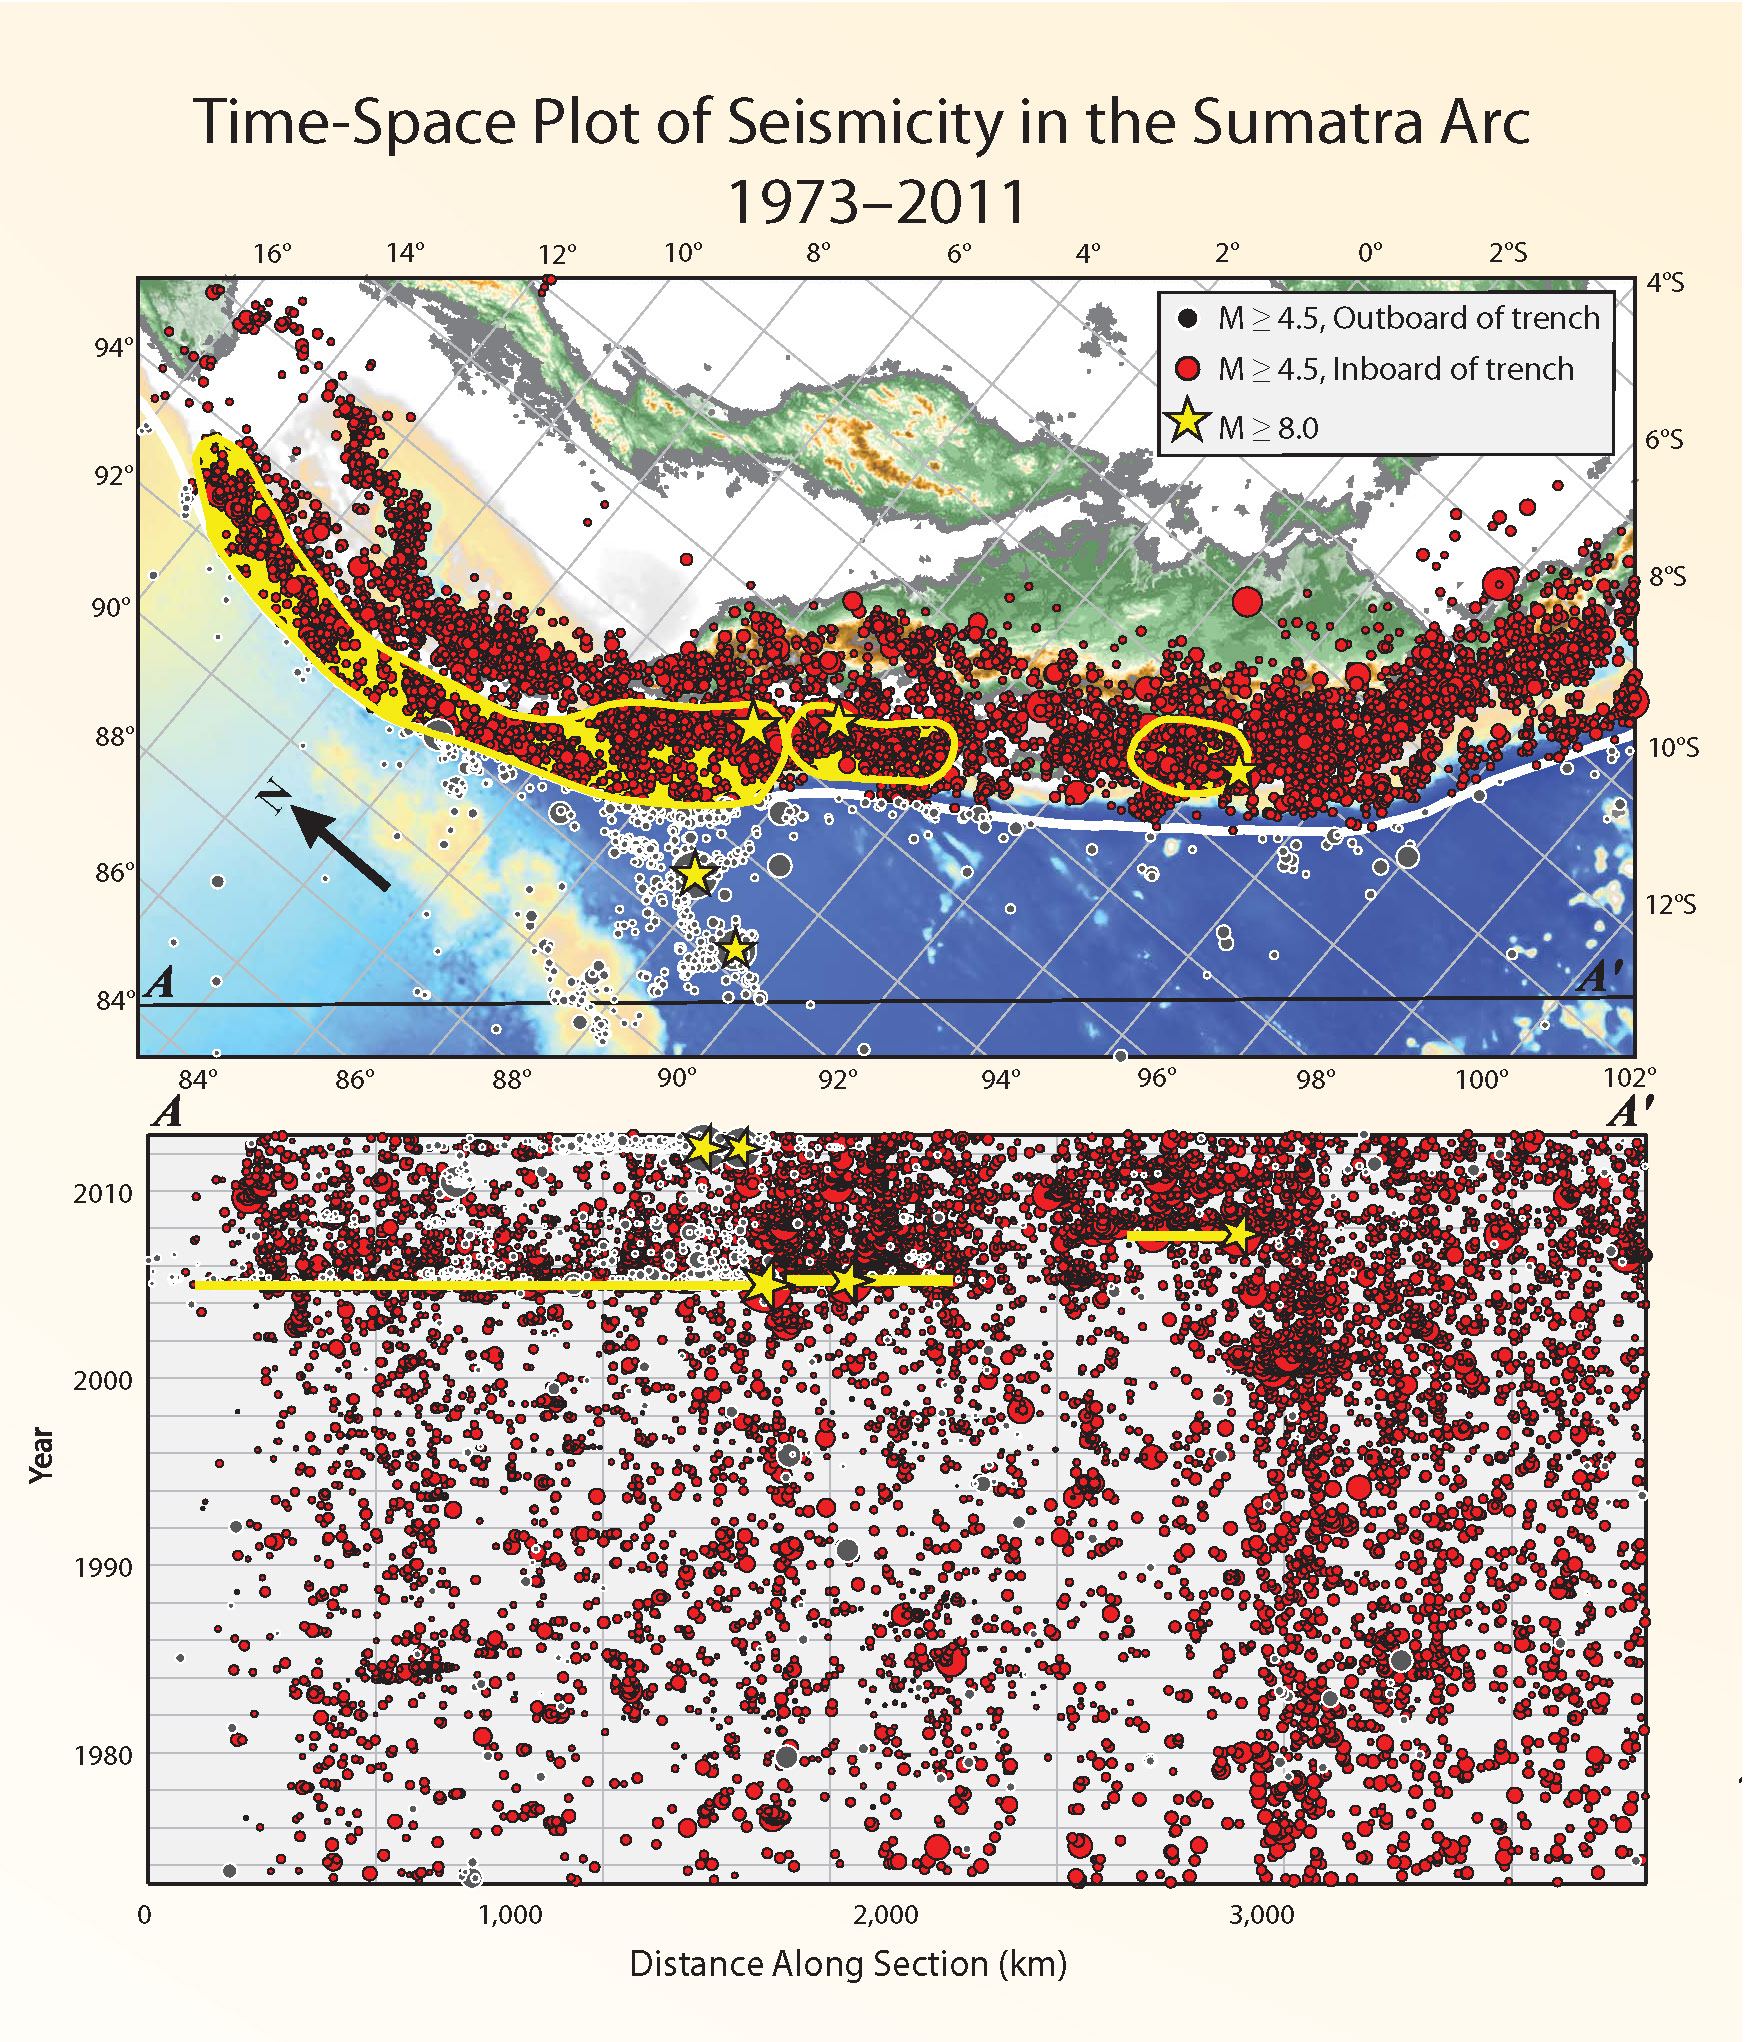
- In the lower right corner is a Time Space plot of seismicity from this region for the period of 1973-2012 (Hayes et al., 2013). Great earthquakes are represented by yellow stars on the map time-space plot. The epicenters from the 2012 earthquakes are plotted on this map, so the figure caption is incorrect in their publication (can’t be perfect). Note how the rate of seismicity (prior to 2004 and 2010) at and north of the latitude of the 2007-09-12 M 8.4 subduction zone earthquake (4° S) is lower than south of this latitude. Of particular interest is that there is a slightly higher rate of seismicity between 4° and 8°. Could this inform us about whether or not there will be a Great earthquake in this region of the subduction zone?
- In the upper left corner is a map that has the same earthquake patches as in the plate tectonic map. The base map is the Magnetic Anomaly data (Maus et al., 2009). These magnetic data is a compilation of data from ships, satellites, and airborne platforms. The first order patterns of dark and light gray represents the change in magnetic polarity through time. These show up on the map as horizontal/East-West bars in the oceanic crust west of Sumatra. These horizontal bars are also offset along North-South fracture zones (strike slip faults). Ninetyeast Ridge and the Investigator fracture zone are labeled. The Wharton Ridge is a spreading center that went inactive ~45 million years ago, which is part of the diffuse plate boundary between the India and Australia plates.
- Below that map is a tectonic map of the Wharton Basin from Earth Observatory of Singapore (EOS, 2012). The Wharton Basin is the ocean basin east of the Ninetyeast Ridge west of the Sunda Megathrust. This map shows some earthquake rupture areas and the plate boundary faults (including the forearc sliver fault, the Sumatra fault), and North-South fracture zones in the Wharton Basin. The 2012 earthquakes and earthquake fault ruptures are shown in red stars and red dashed lines. Aftershocks are plotted as red oranges. Note how these help us define the faults that ruptured.
- In the lower left corner are two maps that show seismicity from the 2012 earthquakes. On the left is a map showing the Satellite Gravity Anomaly. Variations in gravity anomaly data represent variations in earth material properties (things that change the spatial distribution of gravitational force). On the right is a map that shows the Magnetic Anomaly (like my map above). Epicenters and moment tensors for these earthquakes are plotted on both maps. The upper-right panel shows how the authors interpret how the faults slipped.
I include some inset figures in the poster.
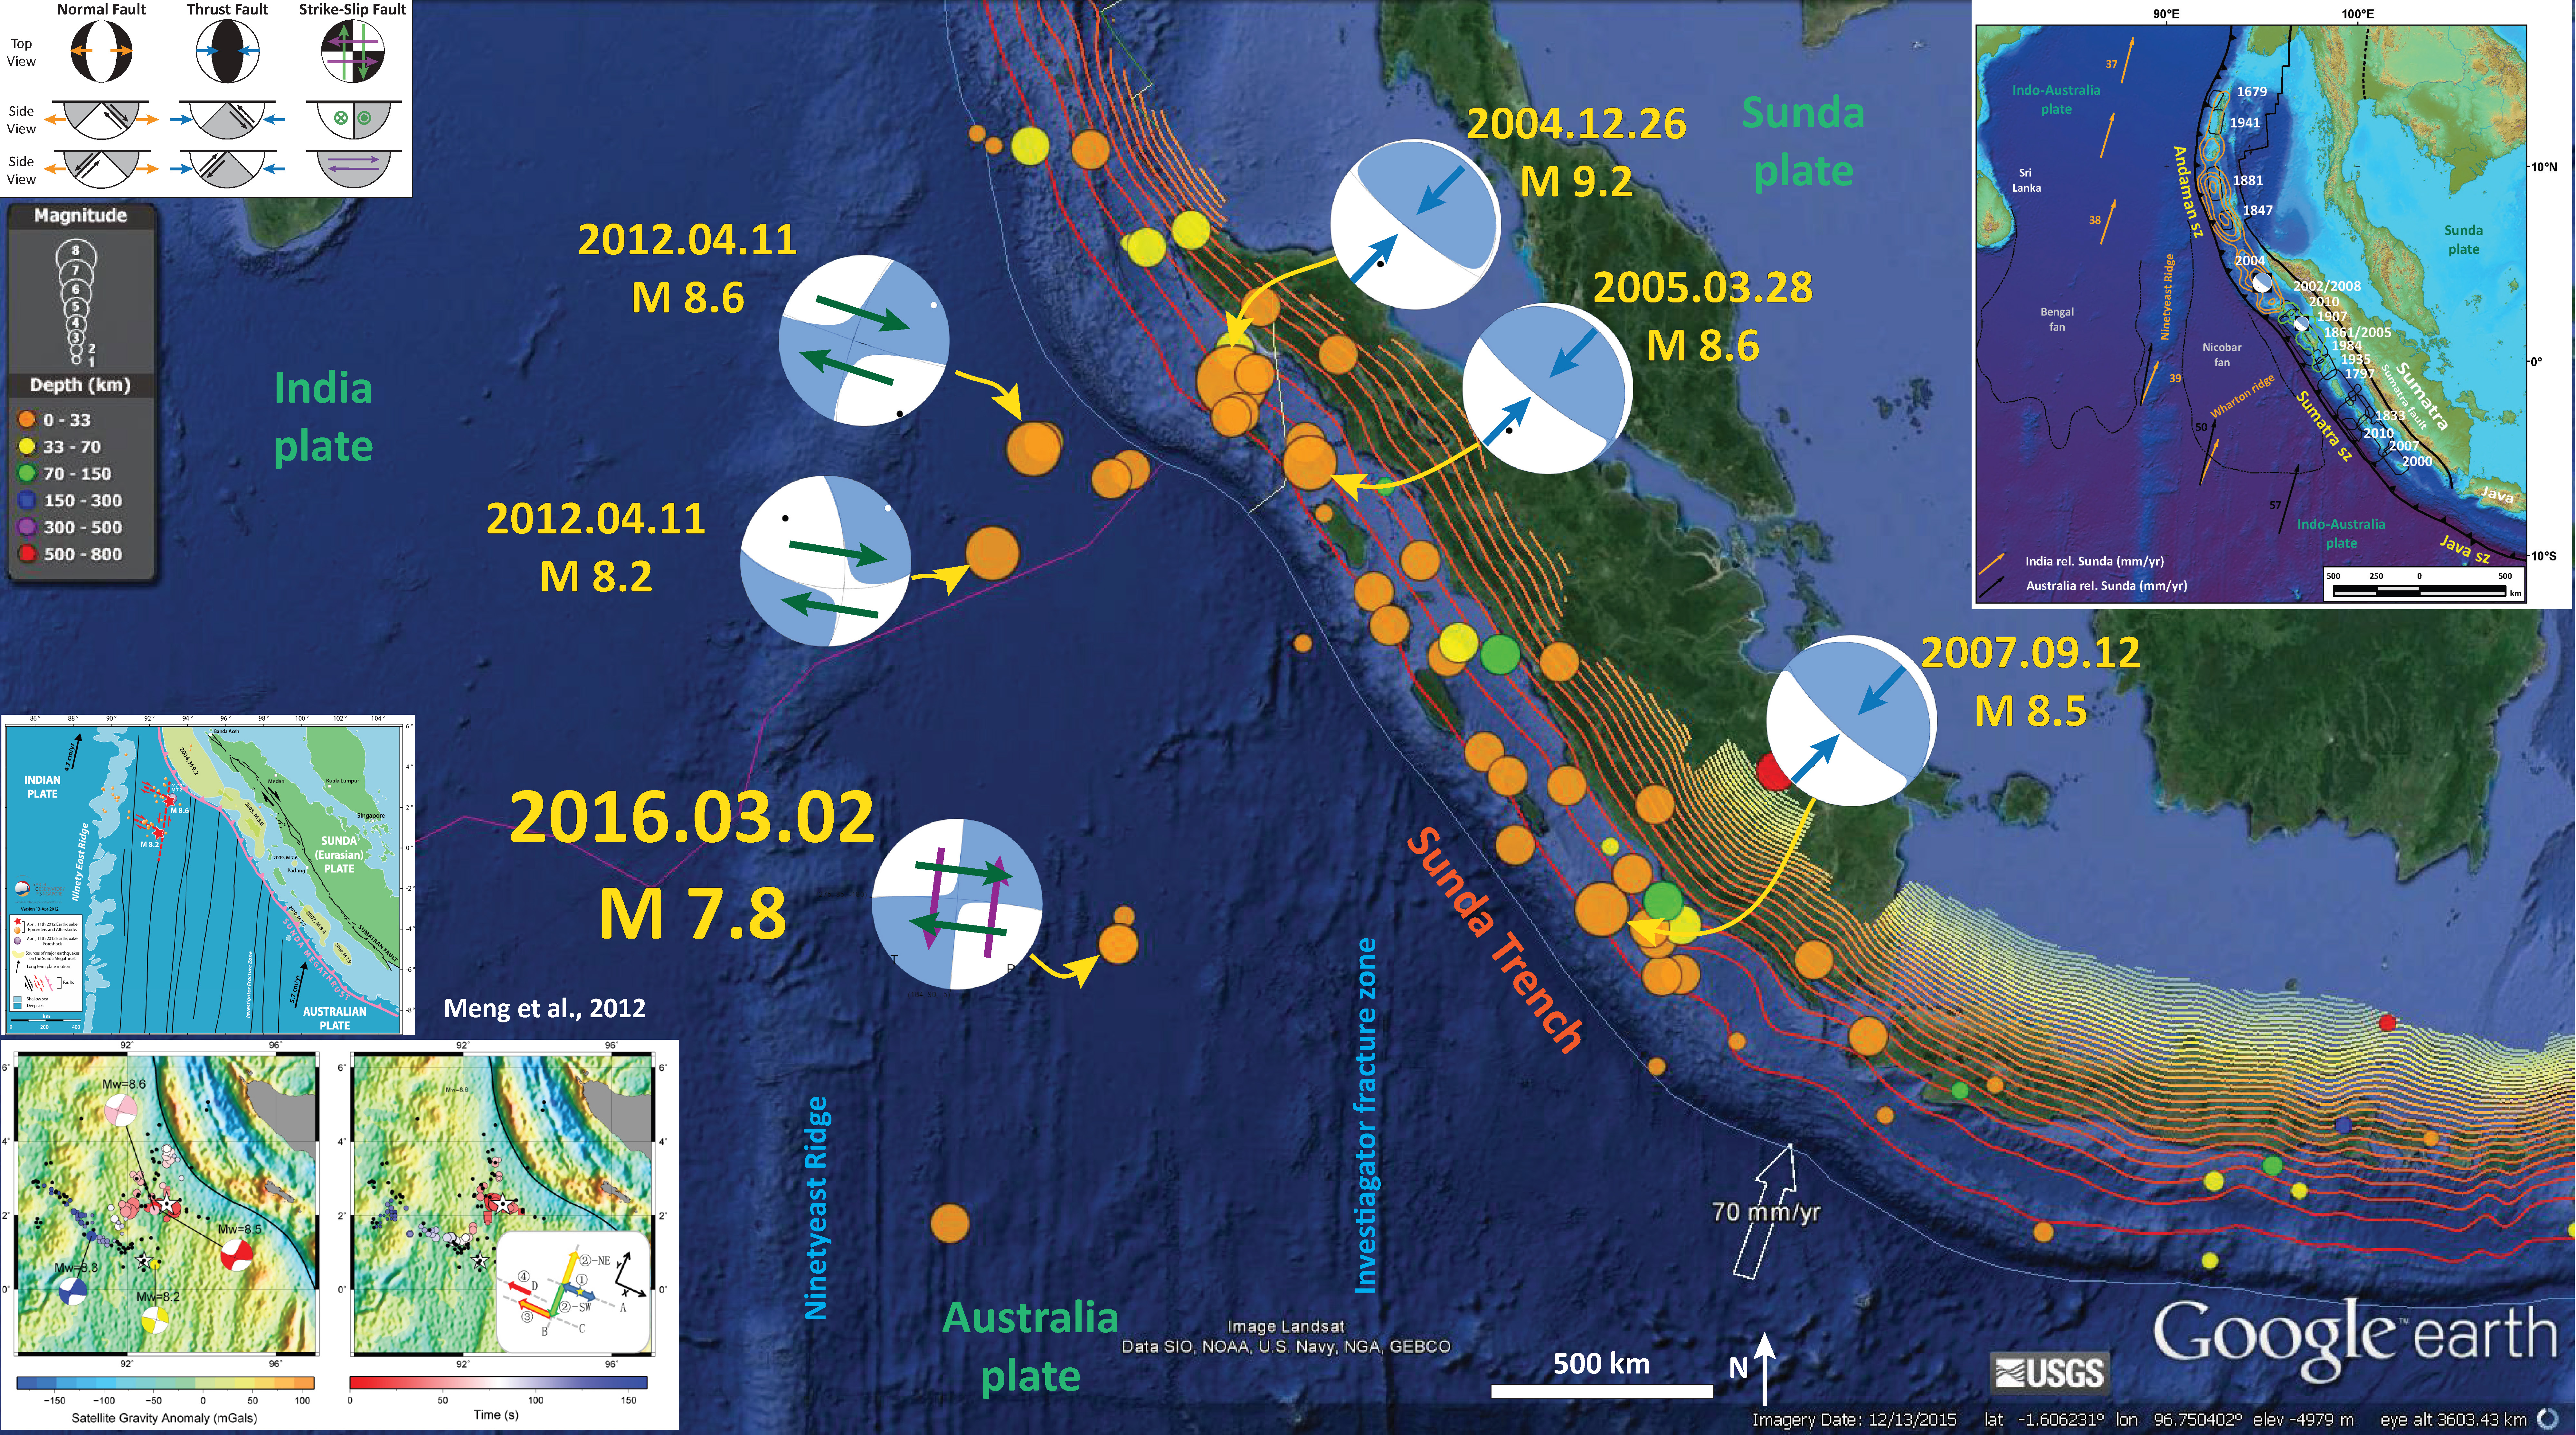
- Here is an interpretive map that shows the early 21st century Great Earthquakes in the Sumatra-Wharton Basin region. More interpretive maps can be found here.
Sumatra-Wharton Basin Eartquakes
Some of the Poster Figures
- This is the magnetic anomaly map.
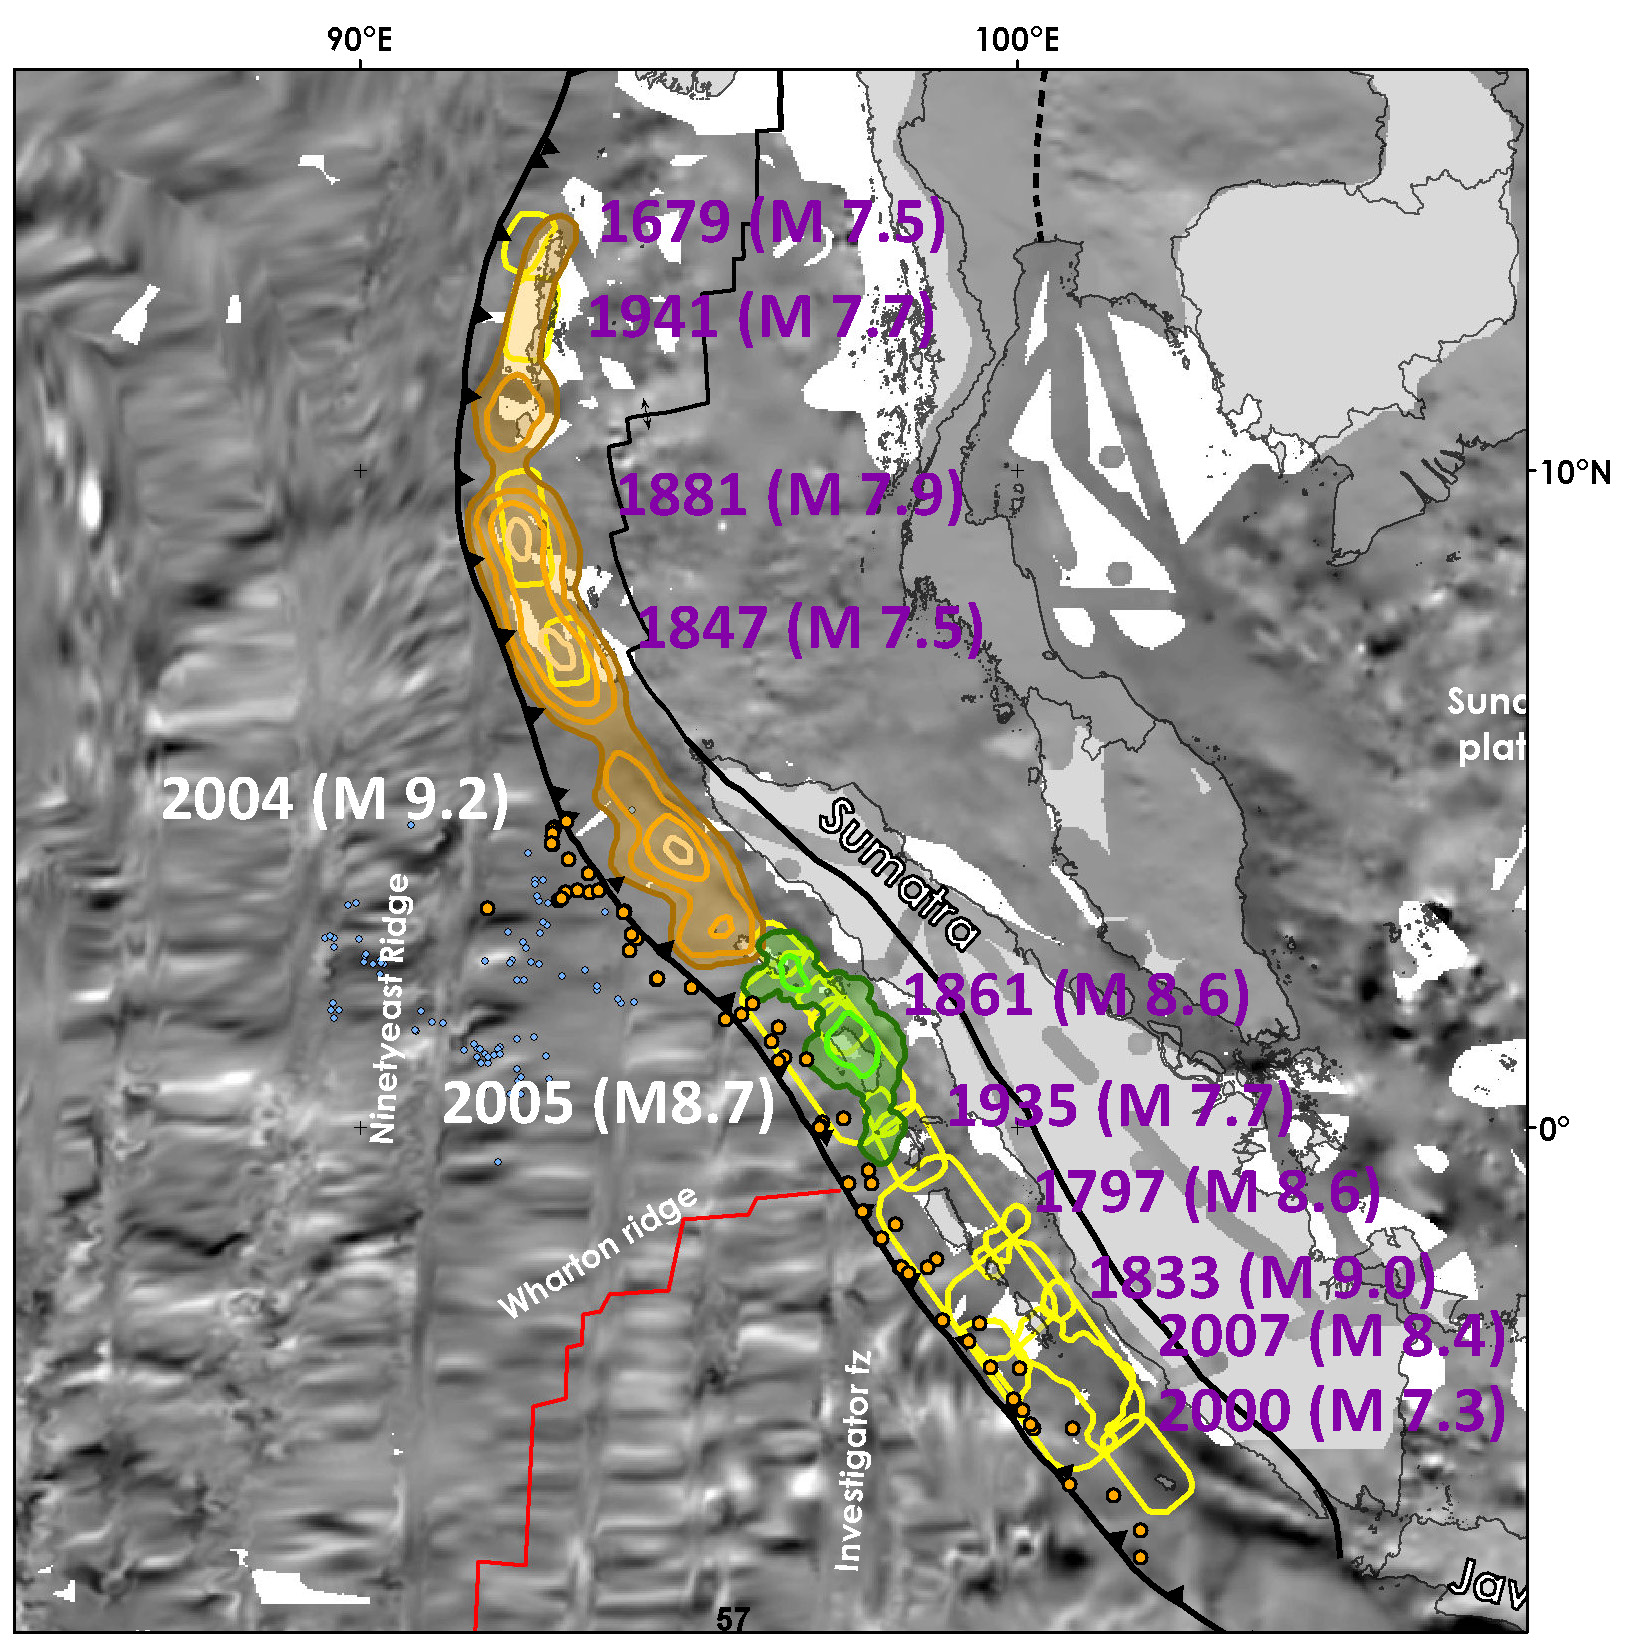
- This is the historic earthquake map.
- This is the EOS 2012 earthquake map.
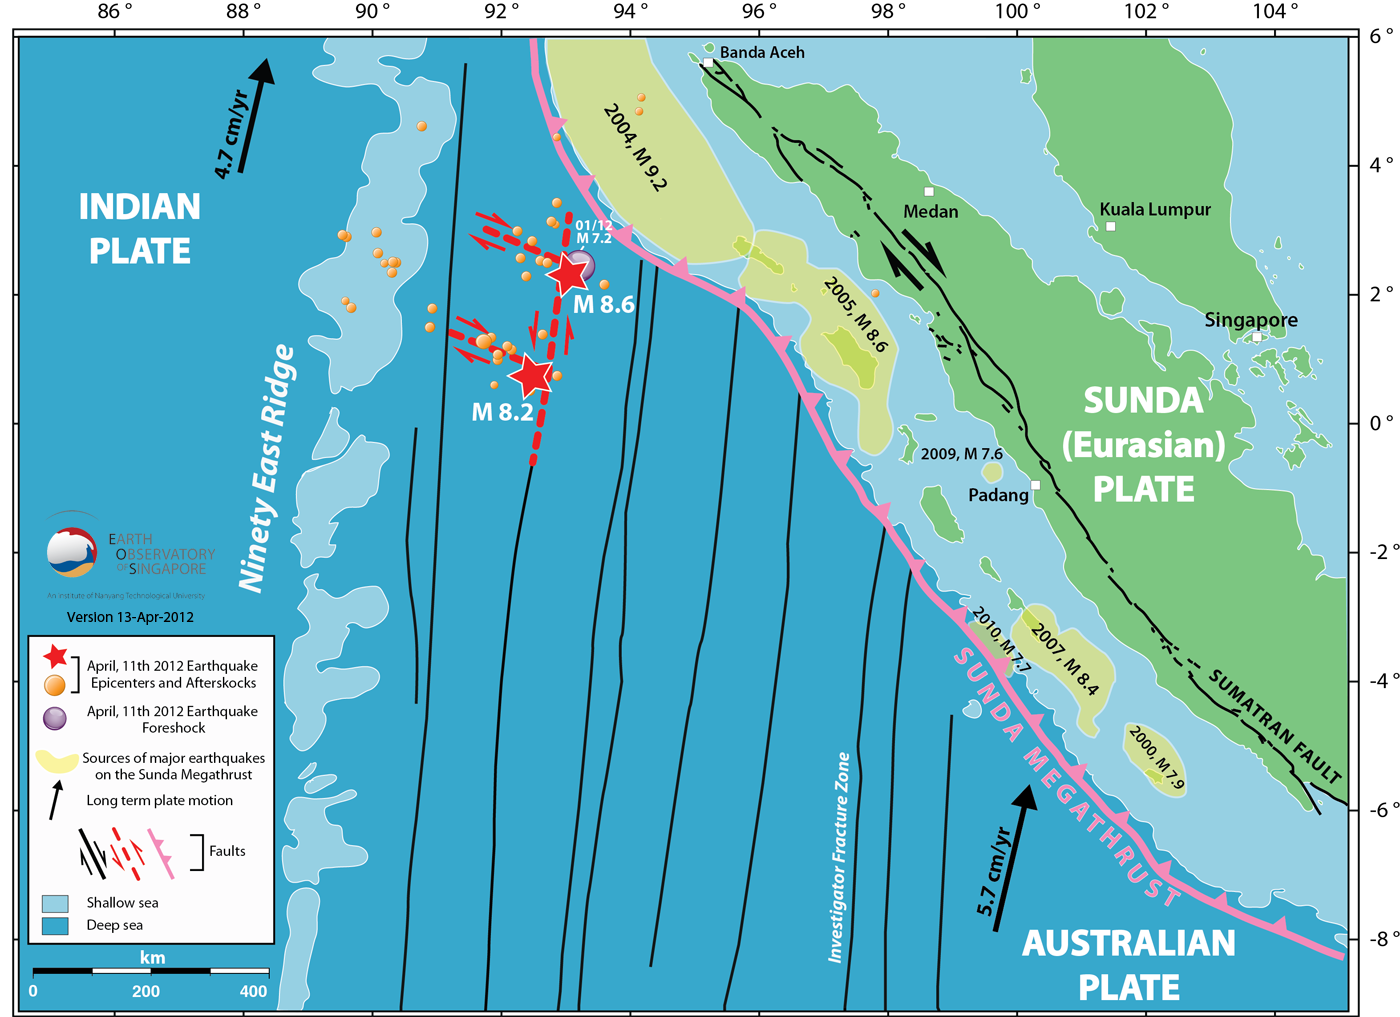
Tectonic setting of the April 11, 2012 earthquake. Seafloor fault information from Dyment et al. (2007) and Jacob et al. (2009), Satish et al. (2011), Deplus et al. (1998).
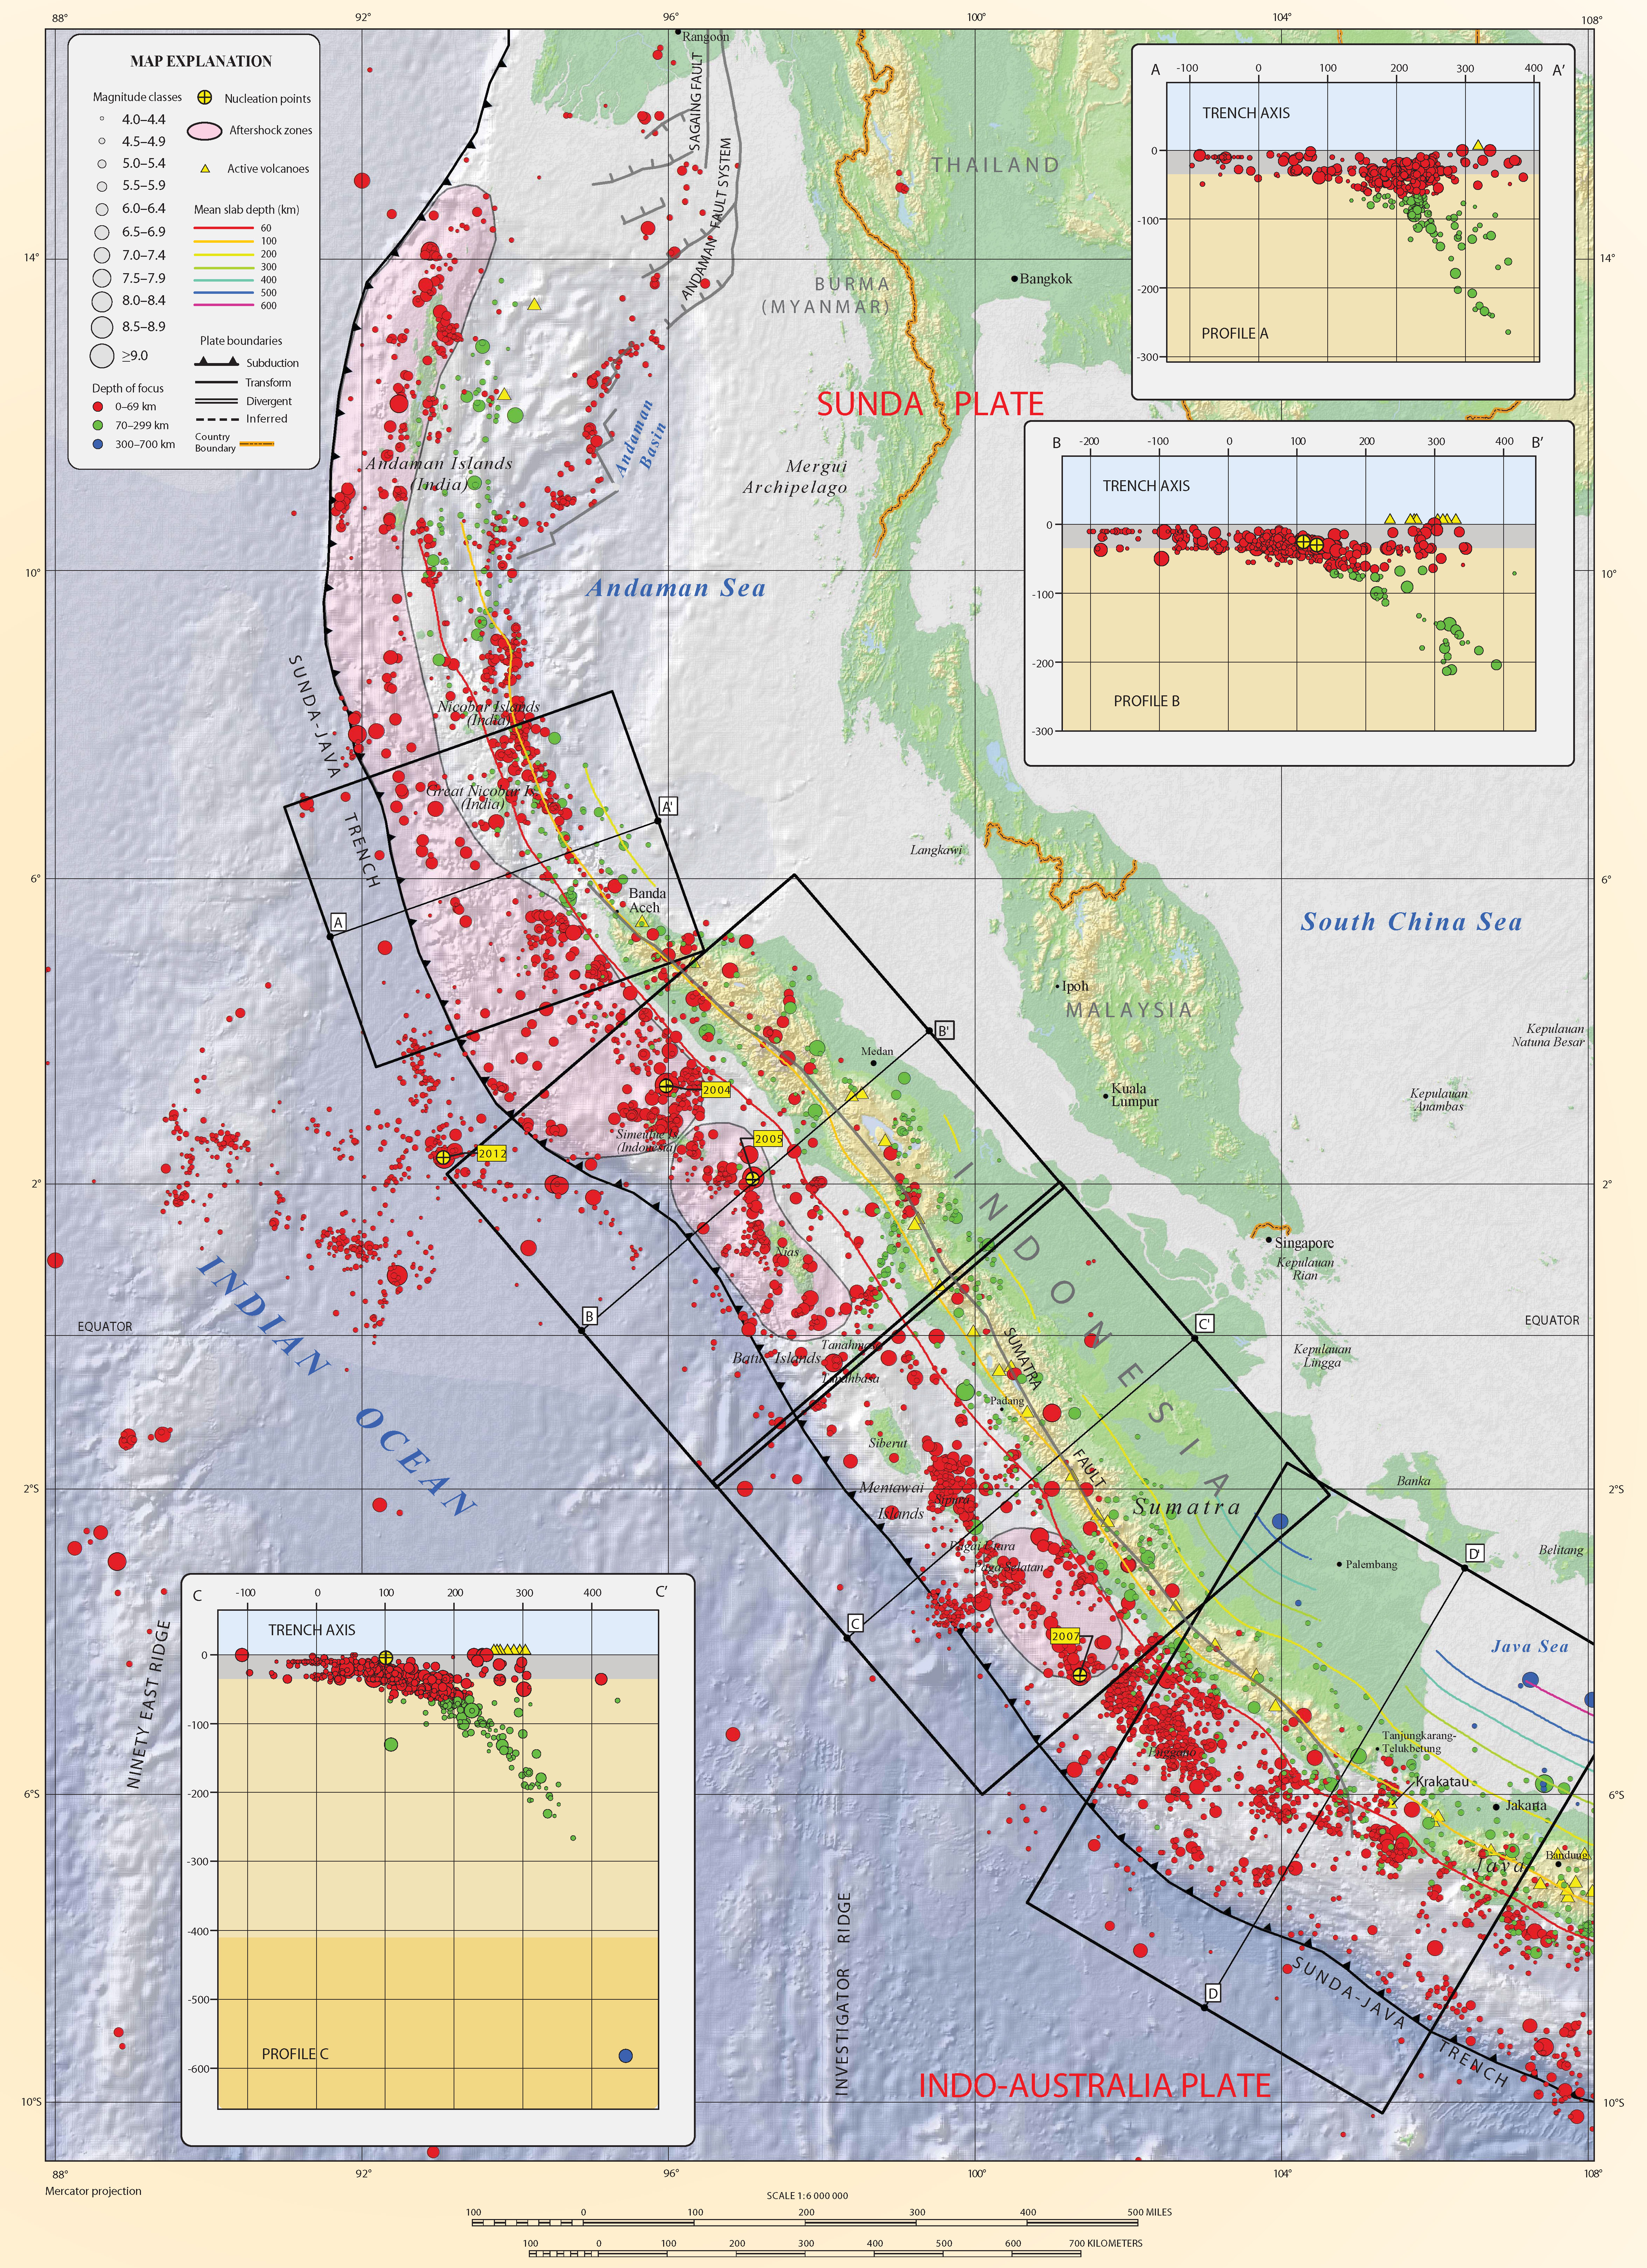
- This is the main figure from Hayes et al. (2013) from the Seismicity of the Earth series. There is a map with the slab contours and seismicity both colored vs. depth. There are also some cross sections of seismicity plotted, with locations shown on the map.
- This is the map and Time-Space plot (Hayes et al. (2013).
- These are the gravity and magnetic anomaly maps (Duputel et al., 2012). I include the figure caption below as a blockquote.

The 2012 Sumatra great earthquake sequence.(a) Map of the 2012 Sumatra great earthquake region. The 11 April 2012 mainshock can be decomposed into two subevents separated by about 200 km (green mechanisms and circles labeled I and II). The W phase and Global CMT (GCMT solution available in July 2012; Ekstrom et al.,2012.) single-point-source solutions for the mainshock (inset green mechanisms), the W phase solutions for the 10 January foreshock (blue mechanism), for the Mw 8.2 aftershock (yellow mechanism) and for the 5.8 < Mw < 8.2 aftershocks (red mechanisms) are shown. Yellow circles indicate the earthquake epicenters and magnitudes from the National Earthquake Information Center (NEIC)catalog between 1 January 1973 and 10 April 2012. Red circles show the events since the Mw 8.6 11 April 2012 earthquake through May 2012. White arrows indicate the direction of motion of the Australian plate relative to the Indian plate at about 13 mm/yr (De Mets et al.,2010). The red triangles on the globe indicate the locations of broadband stations RER and BFO. b) W phase waveforms recorded at station RER (epicentral distance delta = 43, azimuth phi = 235) and BFO(delta = 84, phi = 317) during the 11 Mw 8.6 April 2012 Sumatra earthquake. In each figure, the black trace is the vertical broad-band displacement data and the red trace is the very-long- period displacement data filtered in the 200–1000 s pass band. The W phase, body wave arrivals (P,PP, S,SS) and the Rayleigh wavetrain (R) are indicated.
- These are the gravity and magnetic anomaly maps (Meng et al., 2012). I include the figure caption below as a blockquote.

Spatiotemporal distribution of HF radiation imaged by the (left) European and (right) Japanese networks. Colored circles and squares indicate the positions of primary and secondary peak HF radiation (from movies S1 and S2, respectively). Their size is scaled by beamforming amplitude, and their color indicates timing relative to hypocentral time (color scale in center). The secondary peaks of the MUSIC pseudo-spectrum are those at least 50% as large as the main peak in the same frame. The brown shaded circles in the right figure are the HF radiation peaks from the Mw 8.2 aftershock observed from Japan. The colored contours in the Sumatra subduction zone (left) represent the slip model of the 2004 Mw 9.1 Sumatra earthquake (28). The figure background is colored by the satellite gravity anomaly (left) in milligalileos (mgals) (color scale on bottom left) and the magnetic anomaly (right) in nanoteslas (color scale on bottom right). Black dots are the epicenters of the first day of aftershocks from the U.S. National Earthquake Information Center catalog. The big and small white stars indicate the hypocenter of the mainshock and Mw 8.2 aftershock. The moment tensors of the Mw 8.6 mainshock, Mw 8.2 aftershock, and double CMT solutions of the mainshock are shown as colored pink, yellow, red, and blue beach balls. The red line in the top left inset shows the boundary between the India (IN) and Sundaland (SU) plates (29). The patterned pink area is the diffuse deformation zone between the India and Australia plate. The red rectangular zone indicates the study area. The top right inset shows the interpreted fault planes (gray dashed lines) and rupture directions (colored arrows).
- M 9.2 Andaman-Sumatra subduction zone 2014 Earthquake Anniversary
- M 9.2 Andaman-Sumatra subduction zone SASZ Fault Deformation
- M 9.2 Andaman-Sumatra subduction zone 2016 Earthquake Anniversary
- 2017.03.01 M 5.5 Banda Sea
- 2016.10.19 M 6.6 Java
- 2016.03.02 M 7.8 Sumatra/Indian Ocean
- 2015.07.22 M 5.8 Andaman Sea
- 2015.11.08 M 6.4 Nicobar Isles
- 2012.04.11 M 8.6 Sumatra outer rise
- 2004.12.26 M 9.2 Andaman-Sumatra subduction zone
Indonesia-Sumatra
General Overview
Earthquake Reports
References:
- Abercrombie, R.E., Antolik, M., Ekstrom, G., 2003. The June 2000 Mw 7.9 earthquakes south of Sumatra: Deformation in the India–Australia Plate. Journal of Geophysical Research 108, 16.
- Bassin, C., Laske, G. and Masters, G., The Current Limits of Resolution for Surface Wave Tomography in North America, EOS Trans AGU, 81, F897, 2000.
- Bock, Y., Prawirodirdjo, L., Genrich, J.F., Stevens, C.W., McCaffrey, R., Subarya, C., Puntodewo, S.S.O., Calais, E., 2003. Crustal motion in Indonesia from Global Positioning System measurements: Journal of Geophysical Research, v. 108, no. B8, 2367, doi: 10.1029/2001JB000324.
- Bothara, J., Beetham, R.D., Brunston, D., Stannard, M., Brown, R., Hyland, C., Lewis, W., Miller, S., Sanders, R., Sulistio, Y., 2010. General observations of effects of the 30th September 2009 Padang earthquake, Indonesia. Bulletin of the New Zealand Society for Earthquake Engineering 43, 143-173.
- Chlieh, M., Avouac, J.-P., Hjorleifsdottir, V., Song, T.-R.A., Ji, C., Sieh, K., Sladen, A., Hebert, H., Prawirodirdjo, L., Bock, Y., Galetzka, J., 2007. Coseismic Slip and Afterslip of the Great (Mw 9.15) Sumatra-Andaman Earthquake of 2004. Bulletin of the Seismological Society of America 97, S152-S173.
- Chlieh, M., Avouac, J.P., Sieh, K., Natawidjaja, D.H., Galetzka, J., 2008. Heterogeneous coupling of the Sumatran megathrust constrained by geodetic and paleogeodetic measurements: Journal of Geophysical Research, v. 113, B05305, doi: 10.1029/2007JB004981.
- DEPLUS, C. et al., 1998 – Direct evidence of active derormation in the eastern Indian oceanic plate, Geology.
- DYMENT, J., CANDE, S.C. & SINGH, S., 2007 – Oceanic lithosphere subducting beneath the Sunda Trench: the Wharton Basin revisited. European Geosciences Union General Assembly, Vienna, 15-20/05.
- Hayes, G. P., Wald, D. J., and Johnson, R. L., 2012. Slab1.0: A three-dimensional model of global subduction zone geometries in J. Geophys. Res., 117, B01302, doi:10.1029/2011JB008524.
- Hayes, G.P., Bernardino, Melissa, Dannemann, Fransiska, Smoczyk, Gregory, Briggs, Richard, Benz, H.M., Furlong, K.P., and Villaseñor, Antonio, 2013. Seismicity of the Earth 1900–2012 Sumatra and vicinity: U.S. Geological Survey Open-File Report 2010–1083-L, scale 1:6,000,000, https://pubs.usgs.gov/of/2010/1083/l/.
- JACOB, J., DYMENT, J., YATHEESH, V. & BHATTACHARYA, G.C., 2009 – Marine magnetic anomalies in the NE Indian Ocean: the Wharton and Central Indian basins revisited. European Geosciences Union General Assembly, Vienna, 19-24/04.
- Ji, C., D.J. Wald, and D.V. Helmberger, Source description of the 1999 Hector Mine, California earthquake; Part I: Wavelet domain inversion theory and resolution analysis, Bull. Seism. Soc. Am., Vol 92, No. 4. pp. 1192-1207, 2002.
- Ishii, M., Shearer, P.M., Houston, H., Vidale, J.E., 2005. Extent, duration and speed of the 2004 Sumatra-Andaman earthquake imaged by the Hi-Net array. Nature 435, 933.
- Kanamori, H., Rivera, L., Lee, W.H.K., 2010. Historical seismograms for unravelling a mysterious earthquake: The 1907 Sumatra Earthquake. Geophysical Journal International 183, 358-374.
- Konca, A.O., Avouac, J., Sladen, A., Meltzner, A.J., Sieh, K., Fang, P., Li, Z., Galetzka, J., Genrich, J., Chlieh, M., Natawidjaja, D.H., Bock, Y., Fielding, E.J., Ji, C., Helmberger, D., 2008. Partial Rupture of a Locked Patch of the Sumatra Megathrust During the 2007 Earthquake Sequence. Nature 456, 631-635.
- Maus, S., et al., 2009. EMAG2: A 2–arc min resolution Earth Magnetic Anomaly Grid compiled from satellite, airborne, and marine magnetic measurements, Geochem. Geophys. Geosyst., 10, Q08005, doi:10.1029/2009GC002471.
- Malik, J.N., Shishikura, M., Echigo, T., Ikeda, Y., Satake, K., Kayanne, H., Sawai, Y., Murty, C.V.R., Dikshit, D., 2011. Geologic evidence for two pre-2004 earthquakes during recent centuries near Port Blair, South Andaman Island, India: Geology, v. 39, p. 559-562.
- Meltzner, A.J., Sieh, K., Chiang, H., Shen, C., Suwargadi, B.W., Natawidjaja, D.H., Philobosian, B., Briggs, R.W., Galetzka, J., 2010. Coral evidence for earthquake recurrence and an A.D. 1390–1455 cluster at the south end of the 2004 Aceh–Andaman rupture. Journal of Geophysical Research 115, 1-46.
- Meng, L., Ampuero, J.-P., Stock, J., Duputel, Z., Luo, Y., and Tsai, V.C., 2012. Earthquake in a Maze: Compressional Rupture Branching During the 2012 Mw 8.6 Sumatra Earthquake in Science, v. 337, p. 724-726.
- Natawidjaja, D.H., Sieh, K., Chlieh, M., Galetzka, J., Suwargadi, B., Cheng, H., Edwards, R.L., Avouac, J., Ward, S.N., 2006. Source parameters of the great Sumatran megathrust earthquakes of 1797 and 1833 inferred from coral microatolls. Journal of Geophysical Research 111, 37.
- Newcomb, K.R., McCann, W.R., 1987. Seismic History and Seismotectonics of the Sunda Arc. Journal of Geophysical Research 92, 421-439.
- Philibosian, B., Sieh, K., Natawidjaja, D.H., Chiang, H., Shen, C., Suwargadi, B., Hill, E.M., Edwards, R.L., 2012. An ancient shallow slip event on the Mentawai segment of the Sunda megathrust, Sumatra. Journal of Geophysical Research 117, 12.
- Prawirodirdjo, P., McCaffrey,R., Chadwell, D., Bock, Y, and Subarya, C., 2010. Geodetic observations of an earthquake cycle at the Sumatra subduction zone: Role of interseismic strain segmentation, JOURNAL OF GEOPHYSICAL RESEARCH, v. 115, B03414, doi:10.1029/2008JB006139
- Rivera, L., Sieh, K., Helmberger, D., Natawidjaja, D.H., 2002. A Comparative Study of the Sumatran Subduction-Zone Earthquakes of 1935 and 1984. BSSA 92, 1721-1736.
- Shearer, P., and Burgmann, R., 2010. Lessons Learned from the 2004 Sumatra-Andaman Megathrust Rupture, Annu. Rev. Earth Planet. Sci. v. 38, pp. 103–31
- SATISH C. S, CARTON H, CHAUHAN A.S., et al., 2011 – Extremely thin crust in the Indian Ocean possibly resulting from Plume-Ridge Interaction, Geophysical Journal International.
- Sieh, K., Natawidjaja, D.H., Meltzner, A.J., Shen, C., Cheng, H., Li, K., Suwargadi, B.W., Galetzka, J., Philobosian, B., Edwards, R.L., 2008. Earthquake Supercycles Inferred from Sea-Level Changes Recorded in the Corals of West Sumatra. Science 322, 1674-1678.
- Singh, S.C., Carton, H.L., Tapponnier, P, Hananto, N.D., Chauhan, A.P.S., Hartoyo, D., Bayly, M., Moeljopranoto, S., Bunting, T., Christie, P., Lubis, H., and Martin, J., 2008. Seismic evidence for broken oceanic crust in the 2004 Sumatra earthquake epicentral region, Nature Geoscience, v. 1, pp. 5.
- Smith, W.H.F., Sandwell, D.T., 1997. Global seafloor topography from satellite altimetry and ship depth soundings: Science, v. 277, p. 1,957-1,962.
- Sorensen, M.B., Atakan, K., Pulido, N., 2007. Simulated Strong Ground Motions for the Great M 9.3 Sumatra–Andaman Earthquake of 26 December 2004. BSSA 97, S139-S151.
- Subarya, C., Chlieh, M., Prawirodirdjo, L., Avouac, J., Bock, Y., Sieh, K., Meltzner, A.J., Natawidjaja, D.H., McCaffrey, R., 2006. Plate-boundary deformation associated with the great Sumatra–Andaman earthquake: Nature, v. 440, p. 46-51.
- Tolstoy, M., Bohnenstiehl, D.R., 2006. Hydroacoustic contributions to understanding the December 26th 2004 great Sumatra–Andaman Earthquake. Survey of Geophysics 27, 633-646.
- Zhu, Lupei, and Donald V. Helmberger. “Advancement in source estimation techniques using broadband regional seismograms.” Bulletin of the Seismological Society of America 86.5 (1996): 1634-1641.