Well, I put this and my next earthquake report together shortly after these earthquakes happened, but I was otherwise busy before I could present them online.
There was an earthquake in the Arctic on 2017.01.08, along the channel of one of the major northwest passages. At first, I thought: “intraplate!” This earthquake is not along a plate boundary (though there are many examples of intraplate earthquakes). What led to this seismicity? Perhaps it is due to intraplate deformation along pre-existing fault systems. Perhaps it is related to internal deformation of the crust due to stressed from post-glacial rebound. I am still not sure. There is sparce historic seismicity here and I only spent a few hours looking through the literature. If anyone has an explanation, I would love to hear their ideas. One confounding factor is that this region is covered in ice at least most of the year, so there is probably a limitation to the subsurface geophysical exploration data (e.g. seismic reflection/refraction, seismic tomography, etc.).
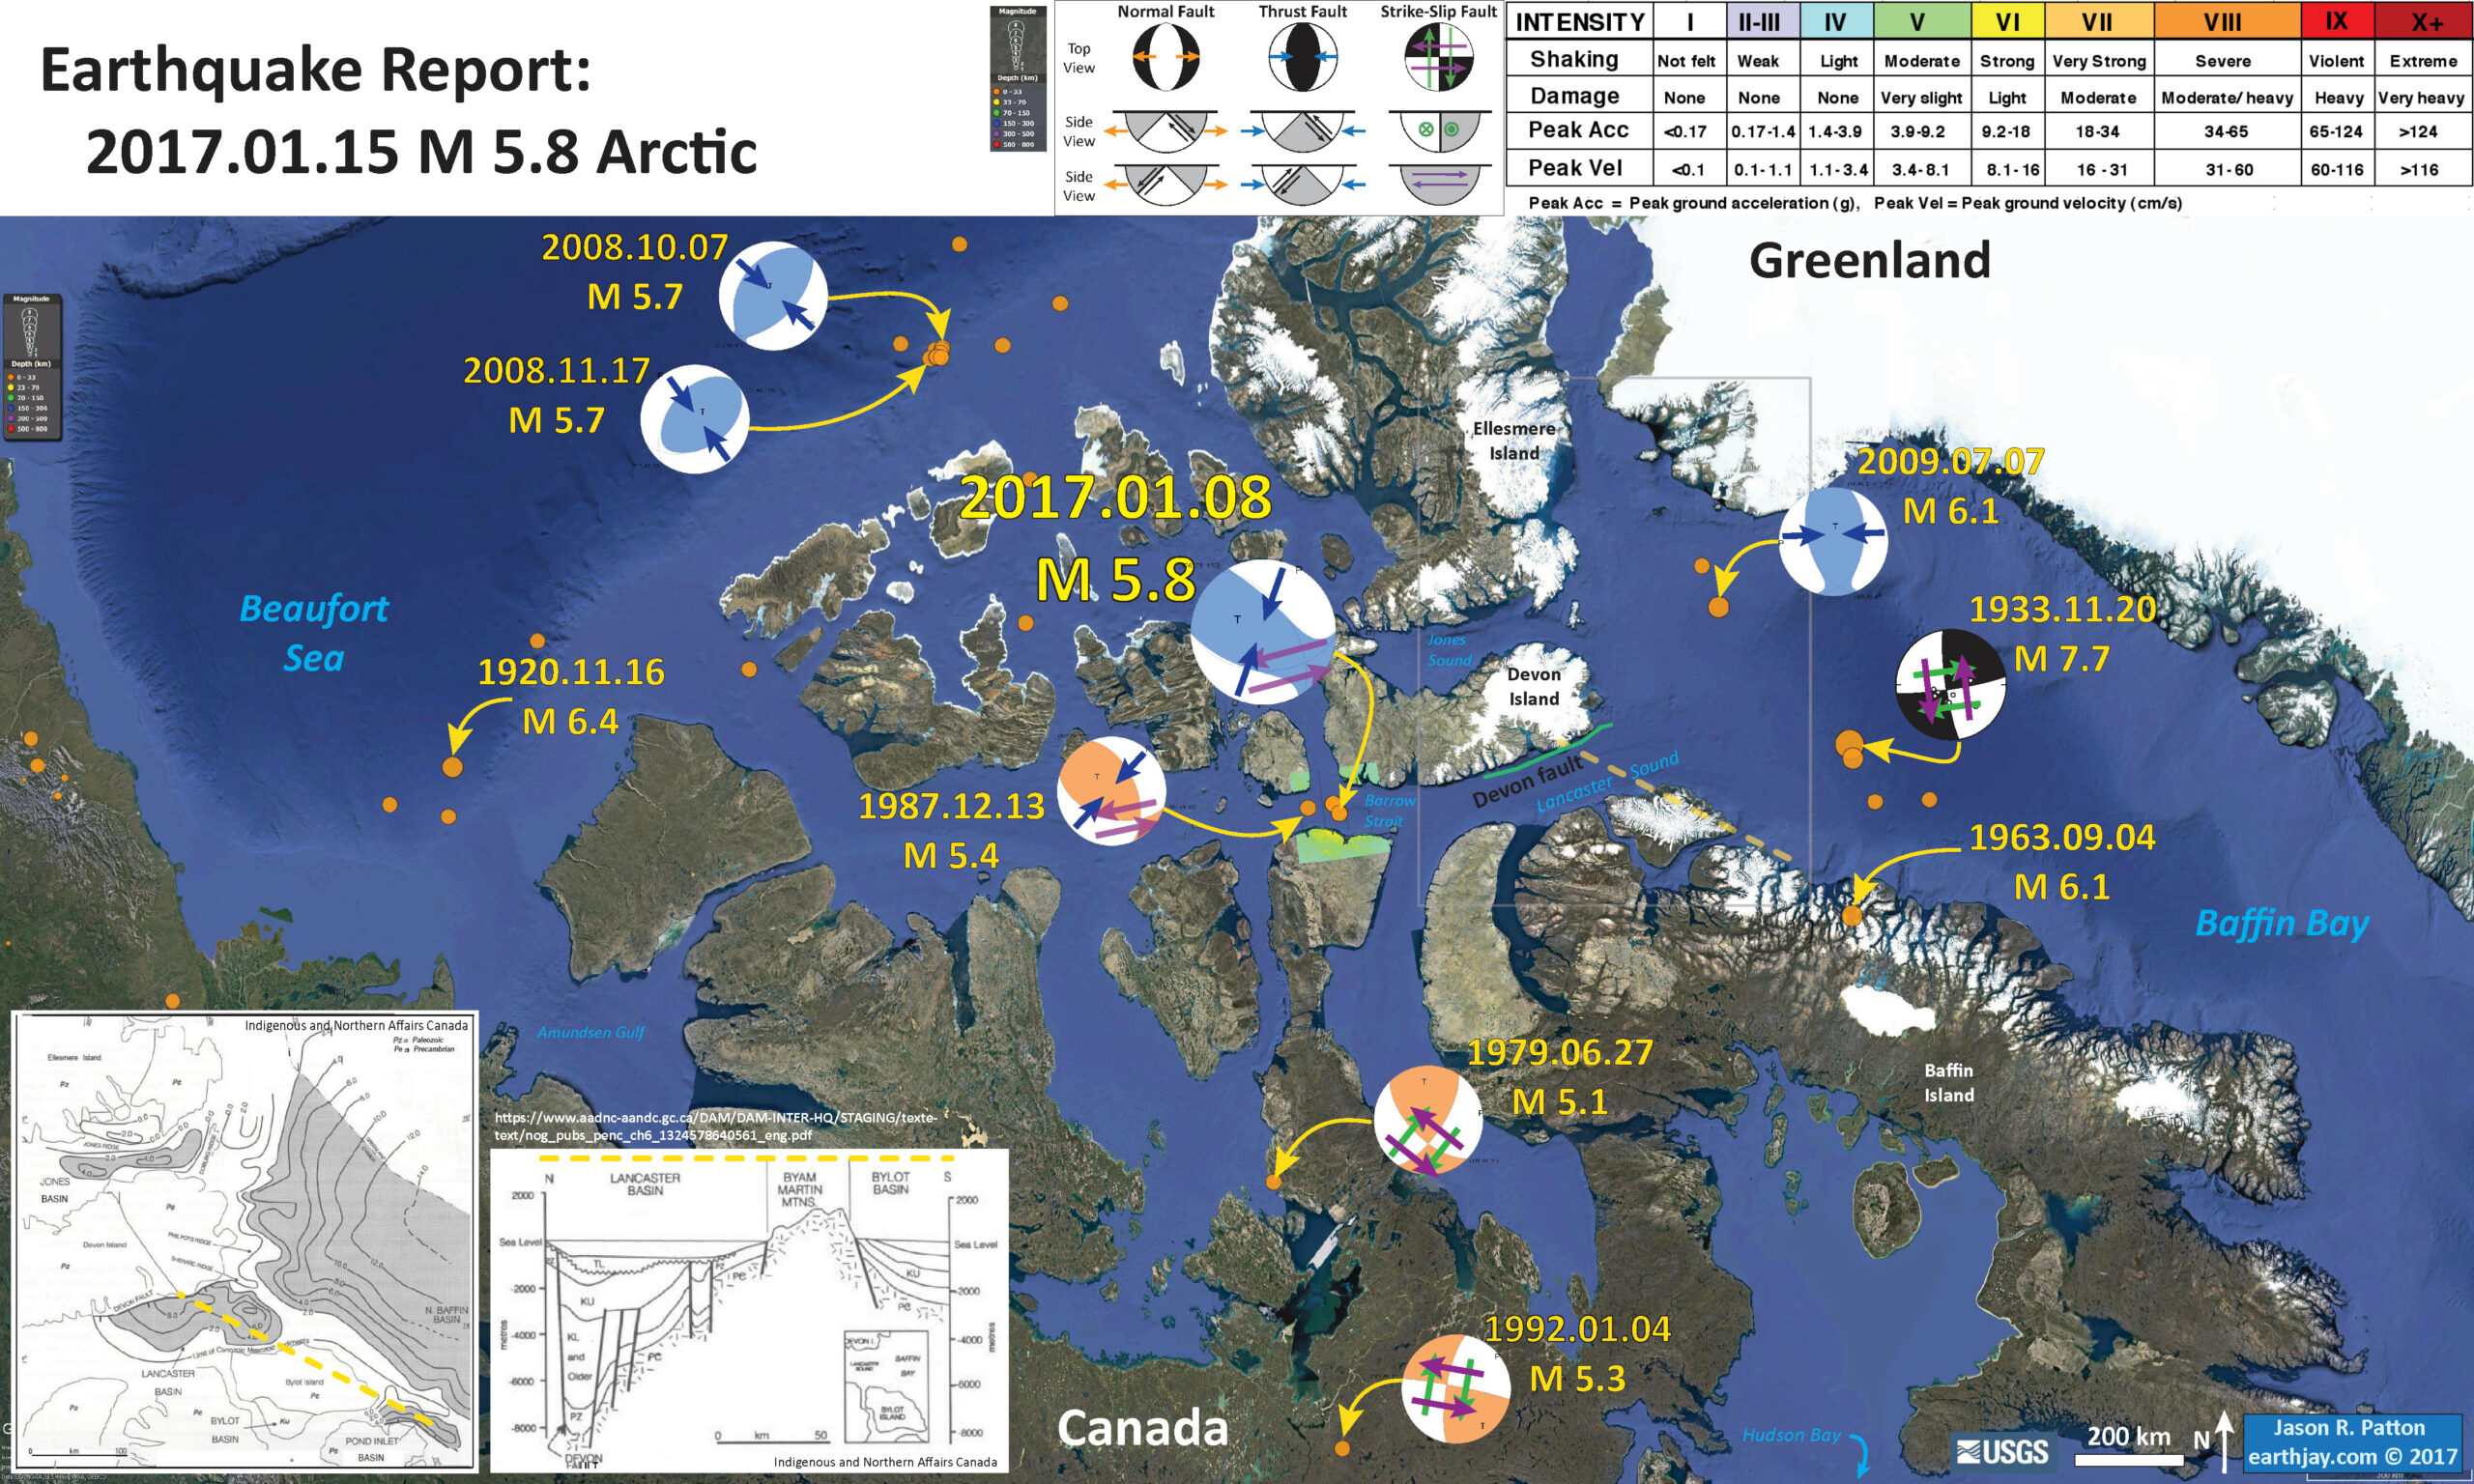
Below is my interpretive poster for this earthquake.
I plot the seismicity from the 1900 until today, with color representing depth and diameter representing magnitude (see legend). Here is my html query for the USGS NEIC database. I present USGS moment tensors for some of the larger magnitude earthquakes. There was an earthquake with a magnitude of M = 7.7 in 1933. There has been some work on that earthquake, so I plot the focal mechanism for that earthquake from Bent (2002).
There have been earthquakes in this region, notably a M 5.8 earthquake in 1987, which has a focal mechanism (plotted) almost identical to this 2017 M 5.8 earthquake (can we say “characteristic?” heheh). There was another earthquake after the 2016 M 5.8, a M = 85.2 on 2016.01.09. Below are some of the earthquakes plotted on this interpretive poster below. The earthquakes with moment tensors or focal mechanisms have their magnitude in bold.
Anthony Lomax prepared a first motion mechanism for this 2017.01.08 M 5.8 earthquake that suggest a more strike-slip earthquake. Lomax states they interpret these data to be of poor quality (probably due to the azimuthal seismologic coverage). I present the Lomax focal mechanism below. The USGS moment tensor suggests that this is compressional and slightly oblique (largely consistent with the Lomax focal mechanism).
This earthquake may be along faults related to the Devon fault or others that may be responsible for the formation of Barrow Strait. It is difficult to tell without more data.
- 2017.01.08 M 5.8 Resolute, Canada
- 2017.01.09 M 5.2 Resolute, Canada
2017
- 1920-11-16 M 6.4 – Beaufort Sea
- 1933-11-20 M 7.7 – Baffin Bay
- 1956-06-03 M 5.6 – Arctic Ocean
- 1963-09-04 M 6.1 – Baffin Island region, Nunavut, Canada
- 1979-06-27 M 5.1 – King William Island region, Nunavut, Canada
- 1986-04-22 M 5.0 – Beaufort Sea
- 1987-12-13 M 5.4 – Cornwallis Island region, Nunavut, Canada
- 1992-01-04 M 5.3 – Nunavut, Canada
- 2008-10-07 M 5.7 – Arctic Ocean
- 2008-11-17 M 5.7 – Arctic Ocean
- 2009-07-07 M 6.1 – Baffin Bay
Historic
- I place a moment tensor / focal mechanism legend on the poster. There is more material from the USGS web sites about moment tensors and focal mechanisms (the beach ball symbols). Both moment tensors and focal mechanisms are solutions to seismologic data that reveal two possible interpretations for fault orientation and sense of motion. One must use other information, like the regional tectonics, to interpret which of the two possibilities is more likely. The moment tensor shows northeast-southwest compression, perpendicular to the compression at the “Big Bend.”
- I also include the shaking intensity on the map (as a raster, not as contours, due to the small scale of this map). These use the Modified Mercalli Intensity Scale (MMI; see the legend on the map). This is based upon a computer model estimate of ground motions, different from the “Did You Feel It?” estimate of ground motions that is actually based on real observations. The MMI is a qualitative measure of shaking intensity. More on the MMI scale can be found here and here. This is based upon a computer model estimate of ground motions, different from the “Did You Feel It?” estimate of ground motions that is actually based on real observations.
- I include some additional information like the possible location of the Devon fault, as published by Indigenous and Northern Affairs Canada (green line). I include the approximate location of the cross section from this publication (with some insets described below) as a dashed yellow line.
- In the lower left corner is a map that shows the estimated thickness of sediment overlying Cretaceous oceanic crust. The location of the cross section (on the right) is demarcated as a dashed yellow line on this map and on the main map. The general region mapped in this inset map is outlined as a gray rectangle on the main map.
- To the right of the map is a cross section from the same publication. Note the sub-vertical faults, with the basin forming Devon fault on the northern boundary of the Lancaster Basin (labeled “Lancaster Sound” on the map.
I include some inset figures in the poster (there is not much literature about the tectonics of this region, in my very brief review: please let me know of any additional sources!).

- This is the Lomax focal mechanism for the 2017 M 5.8 earthquake/

- Here is a map showing seismicity in the region of the 1933 earthquake (Bent, 2002). I include the original figure caption below in blockquote.

Seismicity in and near Baffin Bay. Circles (scaled to magnitude) indicate epicentres of earthquakes of magnitude less than 6.0. Larger earthquakes are represented by stars and date. Earthquakes of magnitude 5.0 and greater are plotted for the period 1900–1996, magnitudes 4.0–4.9 for 1960–1996, 3.0–3.9 for 1970–1996 and 2.0–2.9 for 1980–1996. See the text for completeness periods for various magnitudes. Epicentres are from the Canadian Earthquake Epicentre File (CEEF). The 2000 m bathymetry contour is indicated by the dashed line. Black triangles indicate communities in which the London Times reported that the 1933 earthquake had been felt; white triangles are communities in which the earthquake had been reported not felt; grey triangles are communities shown for geographic reference only.
- Here is the map of the Cenezoic/Mesozoic sedimentary basins (INAC). The major basin bounding faults are labeled (e.g. Devon fault)

lsopach (thousands of metres) of Mesozoic-Cenozoic strata, Lancaster Sound and adjacent areas.
- Here is the cross section designated by the dashed yellow lines in the interpretive poster. Note that the Devon fault is the big player on the northern boundary of the basin. With this single cross section, it is difficult to understand the structural relations between these different faults.

Schematic cross-section, Lancaster Sound Basin to Bylot Basin.
References:
- Bent, A.L., 2002. The 1933 Ms= 7.3 Baffin Bay earthquake: strike-slip faulting along the northeastern Canadian passive margin in Geophysical Journal International, v. 150, no. 3, p. 726-736/
- Indigenous and Northern Affairs (INAC), ch. 6 (unsure what this is from; feel free to contact me to help me learn and document)