We just had a large earthquake along the West Fiji Ridge, one of the spreading ridges that forms the North Fiji Basin. Here is the USGS website for this M 7.2 earthquake.
This earthquake was relatively shallow and, probably since it was an extensional earthquake with a relatively low magnitude, did not pose a tsunami hazard or risk. There was a tsunami with a height of ~10 cm recorded in Fiji. Here is the final tsunami threat message from the Pacific Tsunami Warning Center in Hawaii.
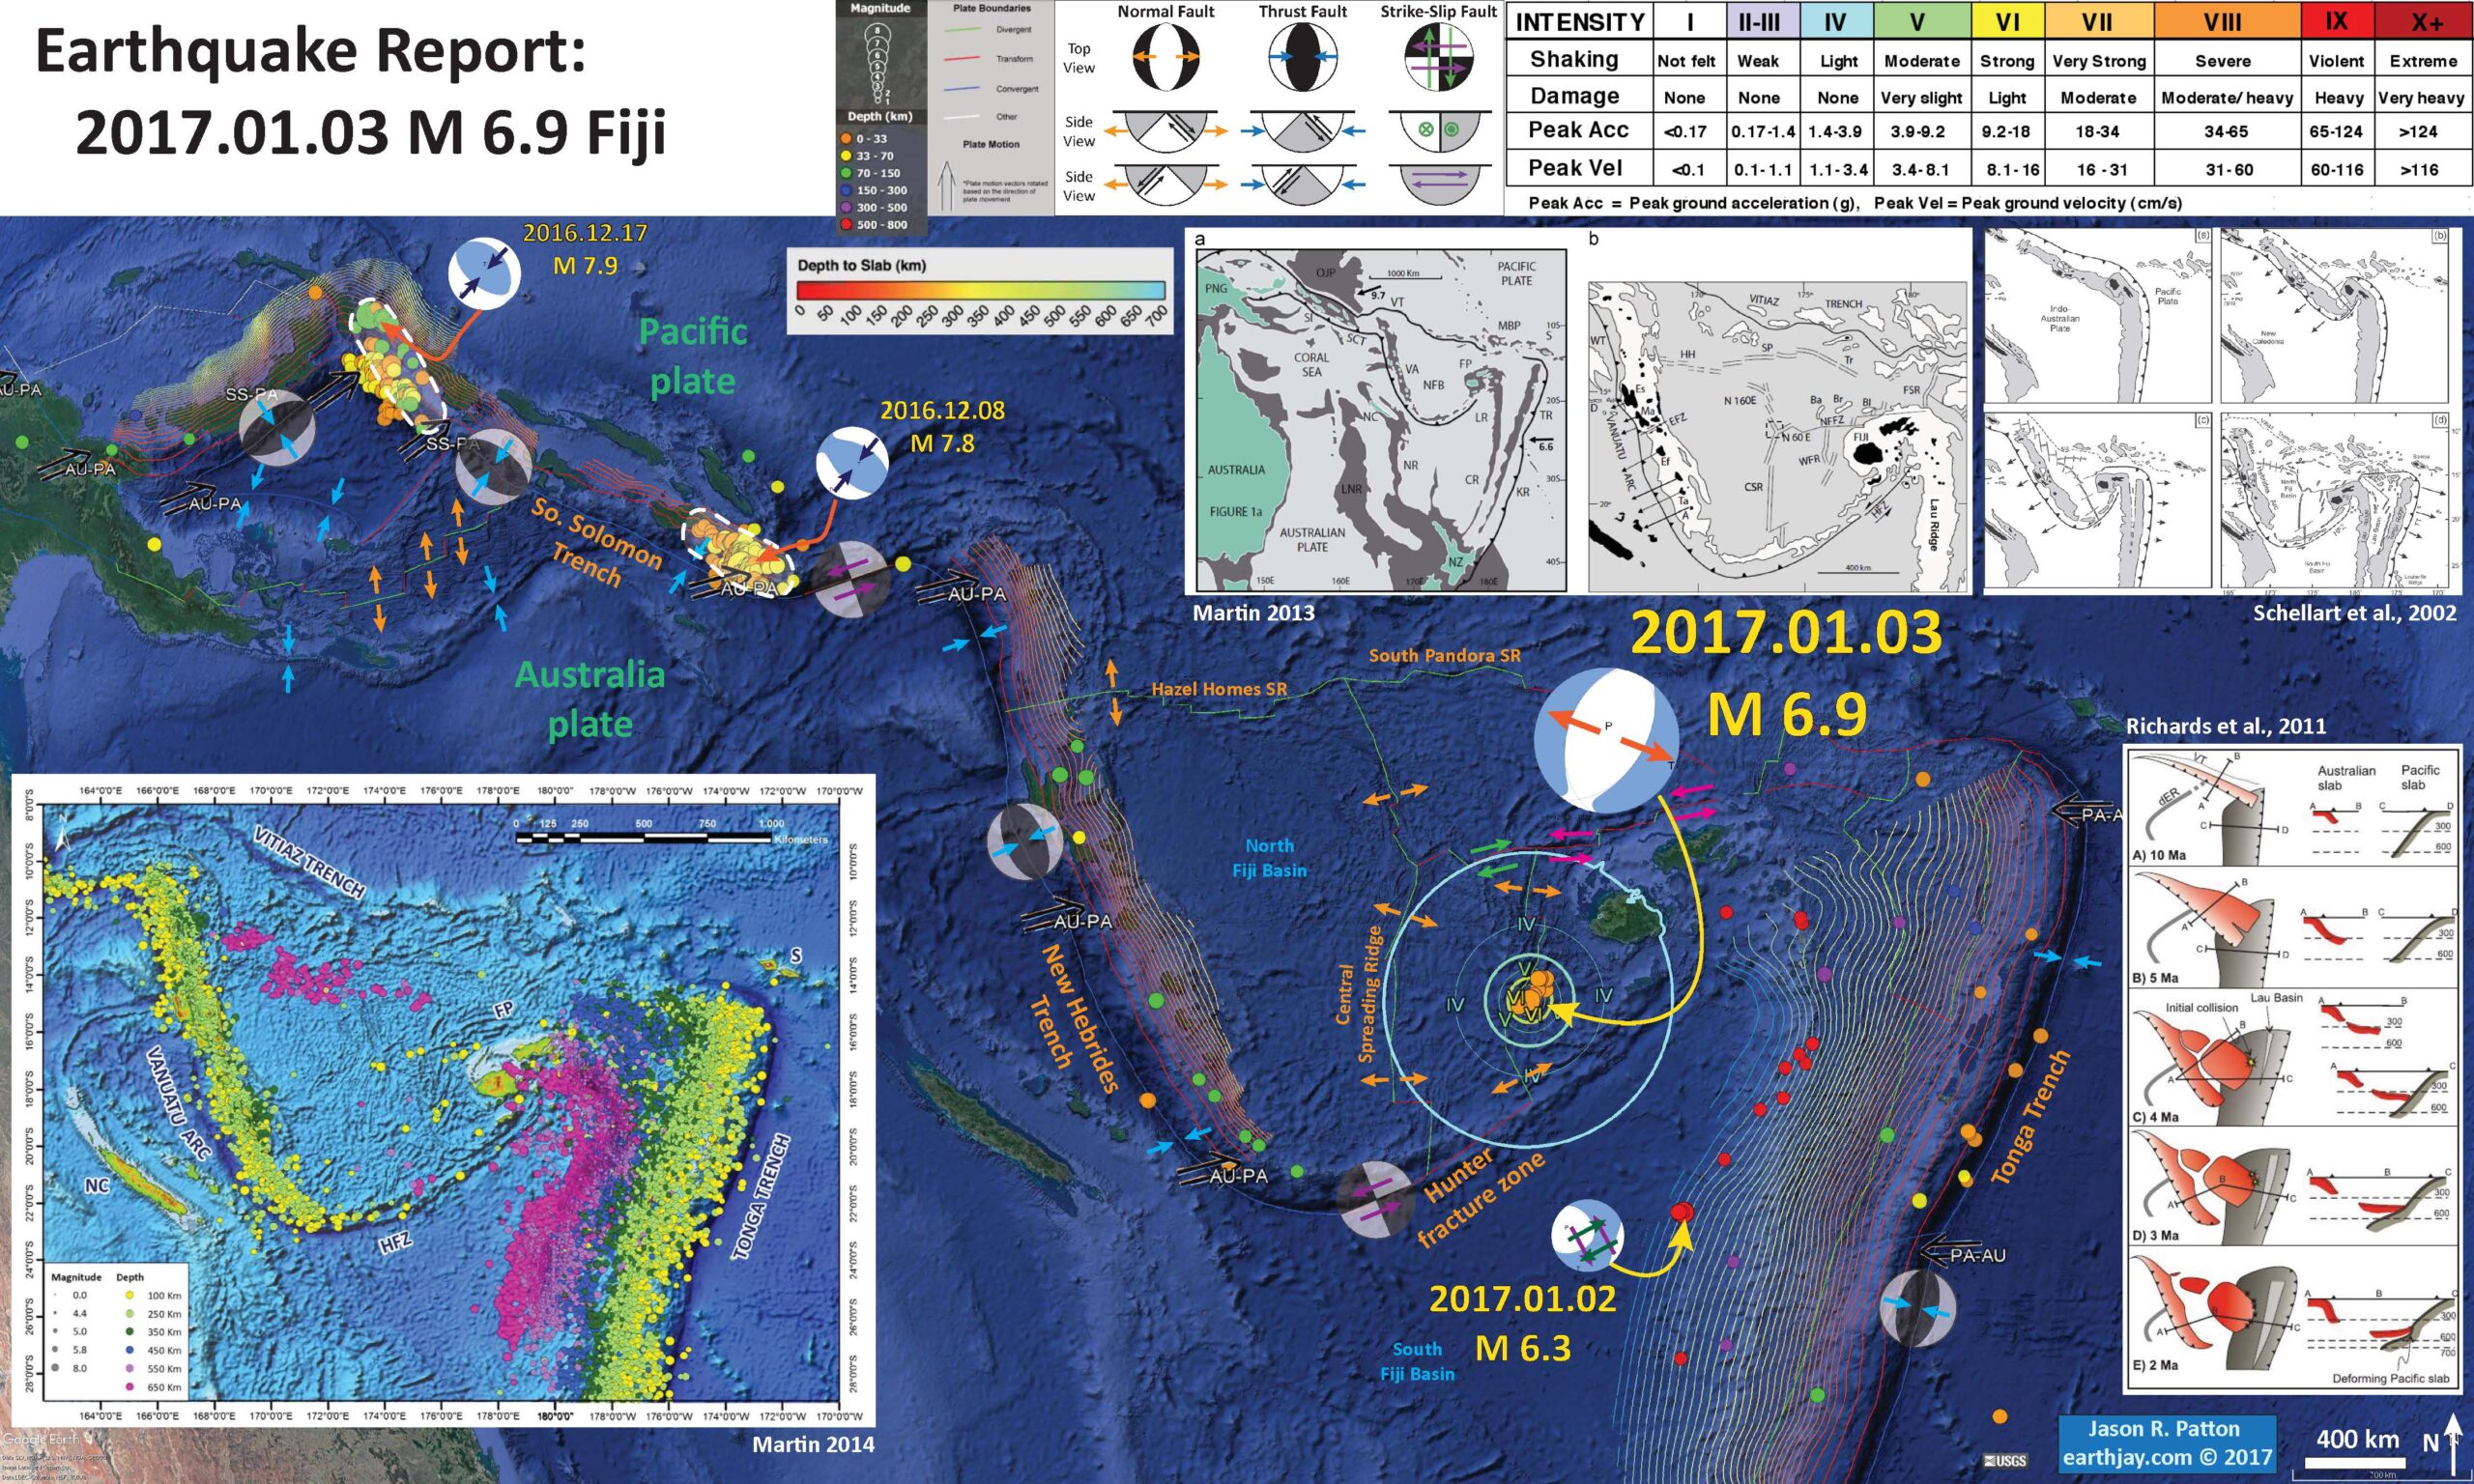
Below is my interpretive poster for this earthquake.
I plot the seismicity from the past month, with color representing depth and diameter representing magnitude (see legend).
- I placed a moment tensor / focal mechanism legend on the poster. There is more material from the USGS web sites about moment tensors and focal mechanisms (the beach ball symbols). Both moment tensors and focal mechanisms are solutions to seismologic data that reveal two possible interpretations for fault orientation and sense of motion. One must use other information, like the regional tectonics, to interpret which of the two possibilities is more likely.
- I also include the shaking intensity contours on the map. These use the Modified Mercalli Intensity Scale (MMI; see the legend on the map). This is based upon a computer model estimate of ground motions, different from the “Did You Feel It?” estimate of ground motions that is actually based on real observations. The MMI is a qualitative measure of shaking intensity. More on the MMI scale can be found here and here. This is based upon a computer model estimate of ground motions, different from the “Did You Feel It?” estimate of ground motions that is actually based on real observations.
- I include the slab contours plotted (Hayes et al., 2012), which are contours that represent the depth to the subduction zone fault. These are mostly based upon seismicity. The depths of the earthquakes have considerable error and do not all occur along the subduction zone faults, so these slab contours are simply the best estimate for the location of the fault. Today’s M 7.2 earthquake is not directly related to the subduction zones in this region (it is genetically related to a spreading ridge), but they do play an important role in the region.
- I also include moment tensors for several recent earthquakes in the region. Below are links to the USGS websites and the Earthquake Report pages for these earthquakes. I had not prepared a report for the M 6.3, but will briefly discuss this earthquake in this report. The M 7.8 and M 7.9 subduction zone earthquake slip patches are outlined as dashed white lines.
- 2016.12.08 M 7.8 (USGS) (#EarthquakeReport)
- 2016.12.17 M 7.9 (USGS) (#EarthquakeReport)
- 2017.01.02 M 6.3 (USGS) (#EarthquakeReport)
- In the lower left corner I include map that shows the historic seismicity for this region (Martin, 2014). The color shows well how the earthquakes that happen along the Tonga Trench get deeper along with the subducting slab. Shallow earthquakes are generally subduction zone earthquakes and deeper earthquakes are related (generally) to processes happening withing the downgoing slab. The 2017.01.02 M 6.3 earthquake is one of these deep earthquakes. I will briefly compare this M 6.3 earthquake with an earthquake from the region that occurred in 1932 (Okal, 1997).
- In the center top I include a figure that shows a small scale map of the southwestern Pacific (a) and a large scale map of the North Fiji Basin (b) from Martin, 2013. The various spreading ridges are indicated as double lines. I present this figure below.
- In the upper right corner I include a figure from Schellart et al. (2002) that shows a conceptual model for the development of the North Fiji Basin formed by extension in the plate as the Basin rotated clockwise towards the New Hebrides Trench. I present this below.
- In the lower right corner I include a figure from Richards et al. (2011) that shows their model of how the subducting slabs have interacted through time. These authors think that there is a stalled out and torn slab at depth below the North Fiji Basin. The M 7.2 earthquake occurred near the cross section c-c’.
I include some inset figures in the poster.

Below is additional background material about the tectonics in this region.
- Here is the seismicity map from Martin (2014). Below I include the text from the original figure caption in blockquote.

Earthquake hypocentres from the USGS catalogue (earthquakes from 0 to 70 km depth excluded for clarity), overlain on shaded relief bathymetry showing tectonic elements of the Vanuatu/Tonga area. FP= Fiji Platform. HFZ= Hunter Fracture Zone. NC = New Caledonia. S = Samoa.
- Here is the general tectonic map for the western Pacific and the North Fiji Basin (Martin, 2013). Below I include the text from the original figure caption in blockquote.

(a) The North Fiji Basin in its regional setting in the southwest Pacific Ocean (after Hall and Spakman, 2002; Mann and Taira, 2004; Schellart et al., 2006; Whattam et al., 2008). Light grey¼oceanic crust. Dark grey = oceanic plateaus or island-arc crust. NZ = New Zealand; PNG = Papua New Guinea. CR = Colville Ridge; FP = Fiji Platform; KR = Kermadec Ridge; LHR = Lord Howe Rise; LR = Lau Ridge; MBP = Melanesian Border Plateau; NFB = North Fiji Basin; NC = New Caledonia; NR = Norfolk Ridge; OJP = Ontong Java Plateau; S = Samoa; SCT = San Cristobal Trench; SI = Solomon Islands; TR = Tonga Ridge; VA = Vanuatu Arc; VT = Vitiaz Trench. Black arrows show direction and rate in cm/yr of motion of the Pacific Plate relative to the Australian Plate (DeMets et al., 1994; Mann and Taira, 2004). (b) Main tectonic elements of the North Fiji Basin (NFB) (after Auzende et al., 1995a; Lagabrielle et al., 1996; Pelletier et al., 2001; Ruellan and Lagabrielle, 2005). White areas outlined in black = island arc crust. Black = Islands: A = Aneityum; Ef = Efate; Es = Espirito Santo; M = Malekula; Ta = Tanna. Ridges: Ba, Bl and Br¼Balmoral, Bligh and Braemar (after Jarvis et al., 1994); D = D’Entrecasteaux; WT = West Torres Platform. Spreading Ridges: CSR = Central; FSR = Futuna; HH = Hazel Holmes; SP = South Pandora; Tr = Tripartite; WFR = West Fiji; Fracture Zones: EFZ = Epi (after Greene and Collot, 1994; Raos and Crawford, 2004); HFZ = Hunter; NFFZ = North Fiji. Thin arrows show representative GPS convergence rates between the Vanuatu Arc and the Australian Plate (Calmant et al., 1995, 2003; Taylor et al., 1995; Wallace et al., 2005, 2009). In the Aneityum Tanna area rates are 116–124 mm/yr, in Efate 86–94 mm/yr, while in Espirito Santo and Malekula they are 17–43 mm/yr. Small dashed square shows the location of Fig. 10.
- Here is the figure from Schellart et al. (2002) that shows their model of tectonic development of the North Fiji Basin. Schellart et al. (2002) include a long list of references for the tectonics in this region here. Below I include the text from the original figure caption in blockquote.

Tectonic reconstruction of the New Hebrides – Tonga region (modified and interpreted from Auzende et al. [1988], Pelletier et al. [1993], Hathway [1993] and Schellart et al.(2002a)) at (a) ~ 13 Ma, (b) ~ 9 Ma, (c) 5 Ma and (d) Present. The Indo-Australian plate is fixed. DER = d’Entrcasteaux Ridge, HFZ = Hunter Fracture Zone, NHT = New Hebrides Trench, TT = Tonga Trench, WTP = West Torres Plateau. Arrows indicate direction of arc migration. During opening of the North Fiji Basin, the New Hebrides block has rotated some 40-50° clockwise [Musgrave and Firth 1999], while the Fiji Plateau has rotated some 70-115° anticlockwise [Malahoff et al. 1982]. During opening of the Lau Basin, the Tonga Ridge has rotated ~ 20° clockwise [Sager et al. 1994]. (Click for enlargement)
- Here is a great illustration from Martin (2013) that shows the “Double Saloon Door” model of backarc spreading that may have led to the development of the North Fiji Basin. Below I include the text from the original figure caption in blockquote.

Double-saloon-door rifting and seafloor spreading model (after Martin, 2006, 2007). Double wavy lines¼island arc crust created at a pre-existing accretionary wedge/magmatic arc. Motifs on the rotating terranes = island arc volcanoes. Dotted area¼extended island arc crust. Thin lines within light shaded area = isochrons within oceanic crust. Thick line with black triangles¼subduction zone. Plate West 2 rotates clockwise about pole P1, whereas plate East 2 rotates counter clockwise about pole P2. (a) 201 of Rotation: arc-parallel rifts have developed, and an arc-perpendicular rift has initiated as West 2 separates from East 2 in an east west direction. (b) 401 of Rotation: oceanic crust has extended both to the east and west (compare Fig. 3b with a), and the oceanic rift tips propagate both east and west, shown by isochrons abutting rifted island arc crust. Relative to the southwesterly motion of the east end of plate West 2, and the southeasterly motion of the west end of plate East 2, the arc-perpendicular oceanic rift tip propagates north. Simultaneously, the arc-perpendicular oceanic rift also extends south (compare the NS extent of oceanic crust in Fig. 3b and c). The arc-perpendicular rift therefore propagates both north and south. (c) 601 of Rotation: similar to the development of the North Fiji Basin (NFB), where the situation described in Fig. 3b above has evolved further. (d) For comparison to the model, a compilation of identified magnetic anomalies and lineations in the NFB (after Malahoff et al., 1982a; Auzende et al., 1988a, 1988b,1990, 1994a, 1995a, 1995b; Charvis and Pelletier, 1989; Maillet et al., 1989; Tanahashi et al., 1991; Pelletier et al., 1993; Huchon et al., 1994; Jarvis et al., 1994; Joshima et al., 1994; Tanahashi et al., 1994; Lagabrielle et al., 1996; Pelletier et al., 2000, 2001; Ruellan and Lagabrielle, 2005). Numbers and letter J¼identified magnetic anomalies. Fracture zones: HFZ¼Hunter, FFZ¼Futuna. Note that Fig. 3a–c is symmetrical, whereas the NFB is asymmetrical: Vanuatu Arc is 1163 km long, whereas Fiji Platform extends 510 km.
- Here is a time series of maps and cross sections from Martin (2014) that shows the development of these plate margins for the past 12 Ma. Below I include the text from the original figure caption in blockquote.
- a) Vitiaz-parallel reconstruction when NEdirected subduction of the Australian Plate started 12/10 Ma ago. Toroidal flow radii shown as 500 km except around the Fiji Platform pole which is shown as 270 km because it may have been restricted by the northern end of the reconstructed Tonga slab (cf Fig. 2), whose hingeline was essentially stationary from 12/10Ma to 6 Ma. F=Fiji Platform. L=Lau Ridge. T=Tonga Ridge. V=Vanuatu Arc.
- b) 7.5Ma reconstruction. Thick black arrows showclockwise rollback of Vanuatu Arc and counterclockwise rollback of Fiji Platform, creating a concave slab (cf Fig. 3).
- c) 5Ma reconstruction. Rollback of Tonga slab beginning 6Ma ago (indicated inwhite,marking initial opening of overlying Lau Basin) initiates toroidal flowaround northern end of Tonga slab (blue arrows). Separate flow cell around Fiji Platform rotation pole is omitted for clarity. Flow likely entered both NFB and Lau Basin mantle wedges.
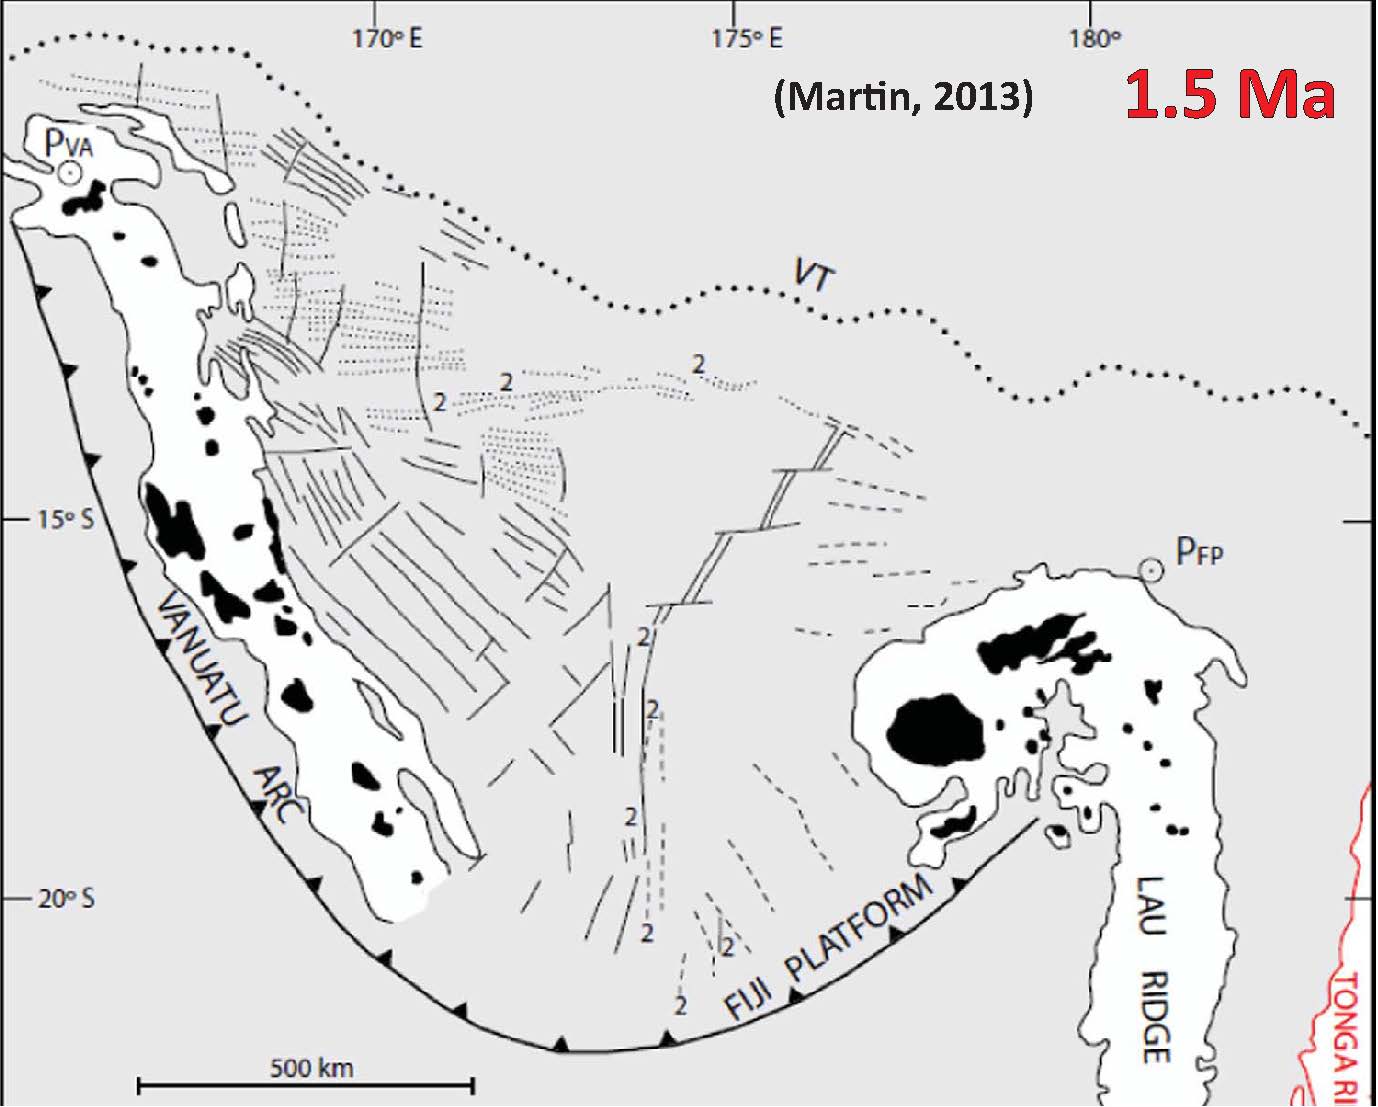
- d) 1.5 Ma reconstruction when Fiji Platformstopped rotating (Martin, 2013), as it collided with Lau Ridge.
- e) Present day. Extent of the combined Vanuatu/Fiji Platformslab based on seismicity outboard of the Tonga slab in zones I and II of Bonnardot et al. (2009). Where Richards et al. (2011) show extensive slab tears, limited tears are shown based on tomography (Hall and Spakman, 2002; Schellart and Spakman, 2012), with gaps indicating possible tears under the Hunter and Epi Fracture Zones. The modelled slab (using rotations of Martin, 2013) extends SE to the Hunter Fracture Zone. Note that Chen and Brudzinski (2001) and Richards et al. (2011) include more hypocentres to the southeast, but these have alternatively been interpreted as extensional or compressional earthquakes related to the upper surface of a Tonga slab double seismic zone (Bonnardot et al., 2009). Lau Basin has expanded, northern Tonga slab is further east and flow into the NFB is reduced or curtailed.

Evolution of slabs underlying the NFB in plan and two cross-sections, based on reconstructions of Martin (2013). Red = combined Vanuatu Fiji Platform slab. Grey=Tonga slab. Toroidal flows around the Vanuatu Arc rotation pole shown in brown arrows, around the Fiji platform rotation pole in green and around the northern end of Tonga slab in blue (lighter colours indicate flows below the slab). Cross-sections are intended to show upwelling and downwelling components of toroidal as opposed to poloidal flows. See Funiciello et al. (2006), Stegman et al. (2006), Schellart (2008) and Faccenna et al. (2010) for the full complexity of flows generated in analogue and numeric models.
- Here is an animated gif that I made from martin (2013) that shows their tectonic reconstruction from 12 Ma to ~1.5 Ma. I also prepared this as a short video clip here (4 MB mp4). I include the figure captions from the individual panels below as blockquotes.
- >12 Ma (Fig. 4)
- 10-12 Ma (Fig. 5)
- 7.5 Ma (Fig. 6)
- 5 Ma (Fig. 7)
- 2.5 Ma (Fig. 8)
- 1.5 Ma (Fig. 9)

Pre-12 Ma pre-rift reconstruction. Fiji Platform is rotated 126.4° (after Taylor et al., 2000) about a rotation pole at 15°37S 179°W (PFP), thereby positioning it NS and aligned with the Lau Ridge. The Vanuatu Arc is rotated 631 about a pole at 10°22S 166°E (PVA). Stars with OJP and MBP mark Ontong Java Plateau and Melanesian Border Plateau collisions which choke the SW-directed subduction zone (thick line with triangles). Dotted lines: VT = Vitiaz Trench; NDZ = northern deformation zone (after Pelletier and Auzende, 1996). Tonga Ridge, outlined in red, is rotated against the Lau Ridge to its position prior to opening of the Lau Basin.

Vitiaz-parallel reconstruction. Vanuatu Arc rotated 52°, and Fiji platform 58.4° from their present-day positions. This is similar to the pre-rift reconstruction of Auzende et al. (1988b, 1995a) which they date as 10 and 12 Ma respectively. Dotted line¼ = Vitiaz Trench. Black line with triangles = NE-directed subduction zone. Thin arrows indicate initial movements of the Vanuatu Arc and the Fiji Platform. Depending on their relative rate of motion (Martin, 2006), initial movement between the east end of the Vanuatu Arc and the west end of the Fiji Platform is strike–slip, implying an R–R–F triple junction. Dashed line¼first magnetic lineation southwest of Fiji Platform, which in its rotated position is sub-parallel to a magnetic lineation off the tip of the Vanuatu Arc. Inset shows subdivision of magnetic lineations into three regions (after Auzende et al., 1988b, 1990). Double dashed line¼axial anomaly. Note that region 2 is divided into two sub-regions, separated by region 3.

Figs. 6–9 are drawn taking the Vitiaz-parallel reconstruction (Fig. 5) to be 12Ma (Auzende et al., 1995a), and assuming 521 rotation of the Vanuatu Arc pro-rata over 12 Ma, and 58.41 of the Fiji Platform pro-rata from 12 Ma to 1.56 Ma (see Sections 2 and 4). 7.5 Ma reconstruction. Vanuatu Arc rotated 32.51 and Fiji Platform rotated 33.21 from their present-day positions. Thin lines are rotated magnetic lineations northeast and southeast of the Vanuatu Arc (Fig. 3d), whereas dashed thin lines are rotated lineations north and southwest of Fiji Platform. Paired thin lines represent a cartoon of the R–R–R triple junction which develops as a result of the WNW–ESE separation of the east end of the Vanuatu Arc and the west end of the Fiji Platform (compare Fig. 3). Note that the first lineation to the southwest of Fiji, which was oriented slightly east of due north in Fig. 5, has been rotated and is slightly west of due north.

5.0 Ma reconstruction. Vanuatu Arc rotated 21.7°, Fiji Platform rotated 19.3°. Dotted lines = EW-oriented anomalies (after Pelletier et al., 1993). Other lineations as in Fig. 6. With initial movement having started at 6 Ma, Tonga Ridge and Lau Ridge have begun to separate (after Parson and Hawkins, 1994; Parson and Wright, 1996; Taylor et al., 1996).

2.5 Ma reconstruction. Vanuatu Arc rotated 10.91, Fiji Platform rotated 5.31. 2A = anomaly 2A (3.6–2.6 Ma). Note that anomalies 2A are superimposed at 17°S, but are overlapped at 17°30′–19°30′S.
1.5 Ma reconstruction. Vanuatu Arc rotated 6.51, Fiji Platform present-day position. 2 = anomaly 2 (1.95–1.78 Ma).
- Martin (2014) suggests that mantle flow at the edges of the subducting slabs play a part in the “Double Saloon Door” tectonic model. Here is an illustration that shows how these flows (toroidal in shape) may be configured. Below I include the text from the original figure caption in blockquote.
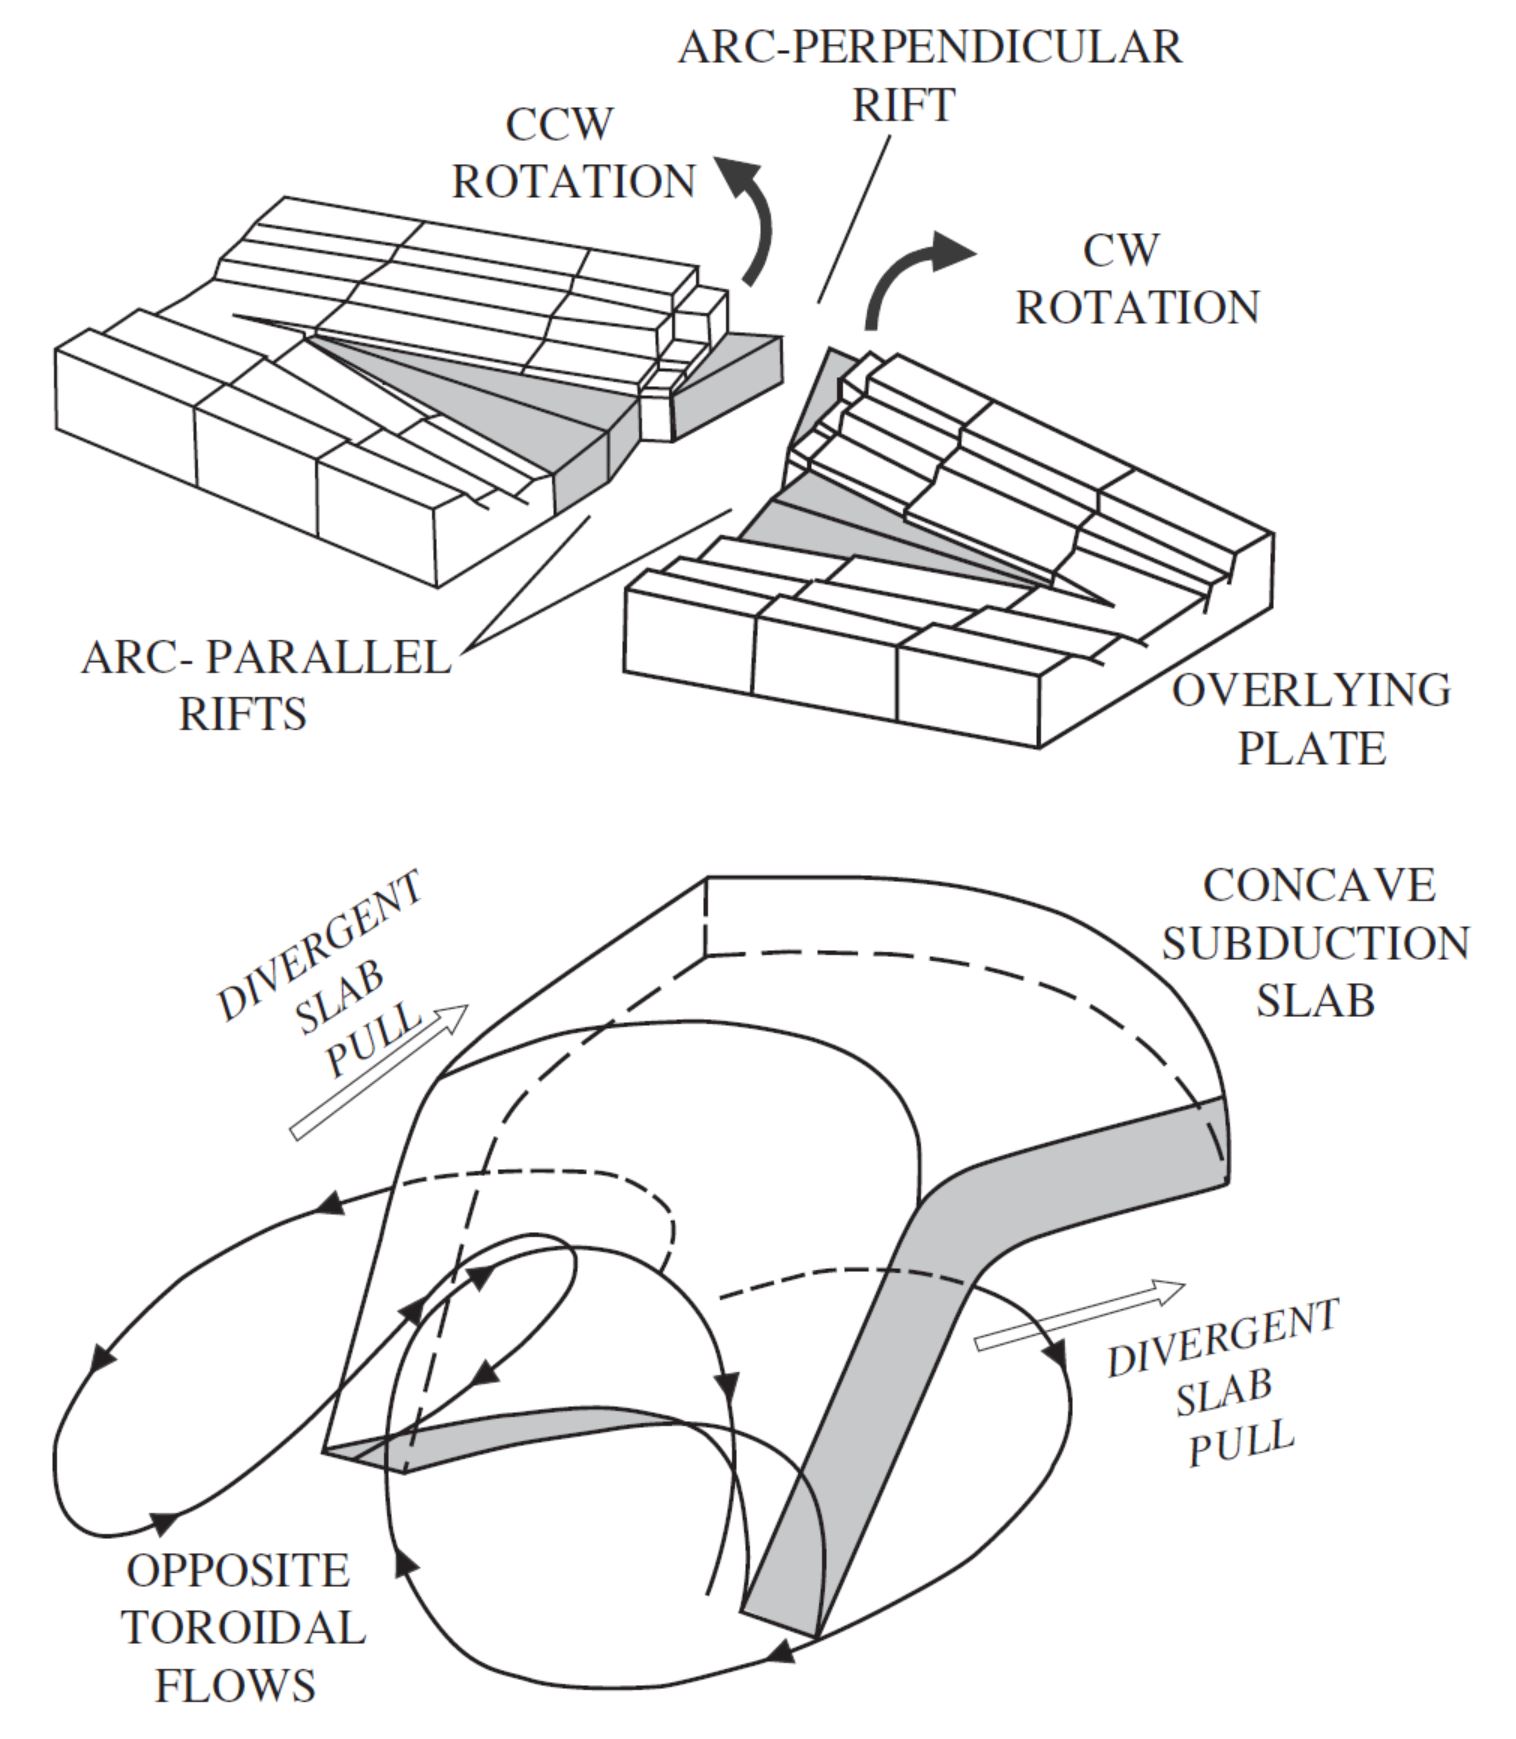
Proposed geodynamic mechanism for concave slab under the NFB. Rollback induces slab curvature and opposite toroidal flows with upwelling and downwelling components (Faccenna et al., 2010; Funiciello et al., 2006; Schellart, 2008), the latter influenced by slab curvature (Kneller and Van Keken, 2008). Mantle flow is concentrated towards the slab in a central location (curved solid lines with arrows, shown dashed when seaward of the slab). Gravitational forces on either flank of curved subduction slab shown by open white arrows. Rifted island arc crust in overlying plate shown in white with fault block pattern. Oceanic crust lightly shaded.
- Auzende et al. (1994) posit that the Central Spreading Ridge and the West Fiji Ridge have been spreading and “functioning synchronously” for the past 1-1.5 Ma. Here is a figure where they present their estimates of spreading rates for these ridges. These spreading rates are based upon the distances between magnetic anomalies and the ridges. Below I include the text from the original figure caption in blockquote.

Kinematic sketch of twin ridges. NFFZ = north Fiji fracture zone; CFZ = central Fiji fracture zone; SFFZ = south Fiji fracture zone; CSR = central spreading ridge; WFR = west Fiji ridge; 5-6 = spreading rate (in cm/yr) calculated from magnetic data; 0-2? = inferred spreading rate (in cm/yr). Arrows at tips of ridge segments indicate direction of propagation. Contour interval = 1 km. A = western North Fiji Basin plate; B = intermediate microplate; C = north Fiji (Pacific?) plate; D = southeast Fiji (Australian?) plate.
- Okal (1997) conducted an analysis of seismological records from a deep earthquake that happened in the region of the M 6.3 earthquake. This earthquake occurred on 26 May 1932, long before modern seismometers made it to the scene. Okal estimated the magnitude to be similar in size to earthquakes in the mid M 7 range. Here is a figure from Okal (1997) that shows some focal mechanisms for the earthquakes from 1932. Compare the mainshock (the largest focal mechanism) with the moment tensor for the 2016.01.02 M 6.3 earthquake. Below I include the text from the original figure caption in blockquote.
- 1932.05.26 M 7.6 (USGS)

Focal mechanism of the 1932 earthquake, as determined in this study. We also show CMT solutions in the immediate vicinity of the event, as available from Dziewonski et al. (1983, and subsequent quarterly updates) and Huang et al. (1997). Their spatial distribution is shown in map view. The background map at the upper right sets the study area (shaded) into the familiar bathymetry of the Fiji-Tonga-Kermadec region. The separation of isobaths is 1000 m.
- Interestingly, deep focus earthquakes take up ~66% of the deep earthquakes globally. From Yu and Wen (2012), we can see some moment tensors for deep earthquakes in this region. The 1994.07.30 earthquake is just west of the 2017 M 6.3 earthquake and also has a similar moment tensor to the 2017 M 6.3 earthquake.
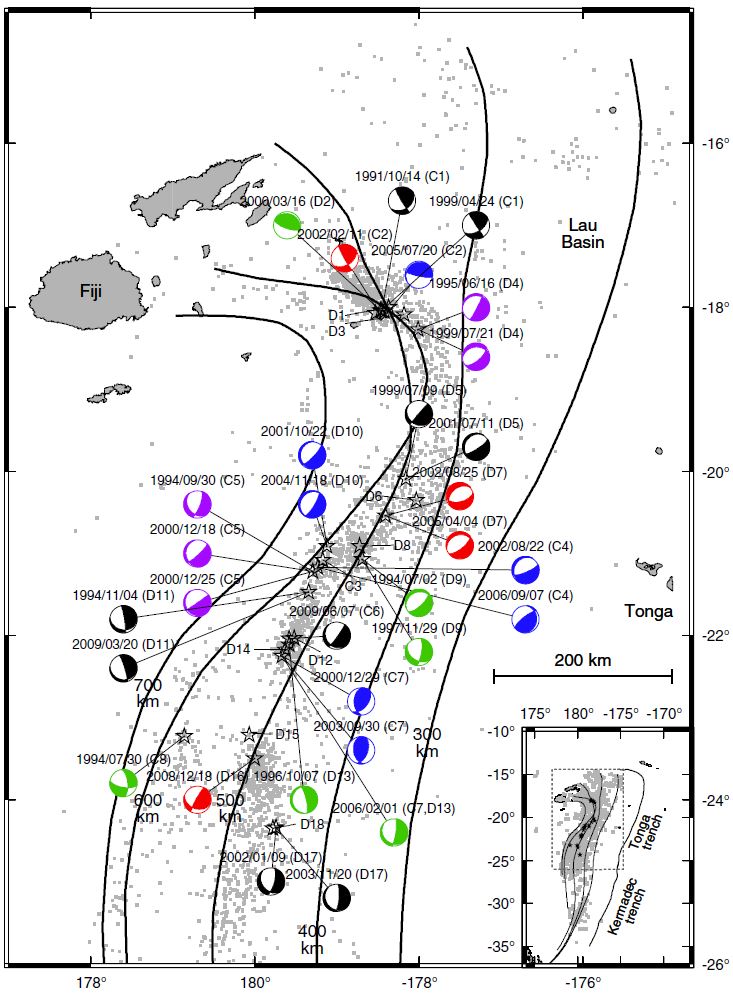
Regional map of deep-focus similar earthquake pairs and seismicity near the Tonga–Fiji subduction zone. Deep similar earthquake pairs (black stars) and their available Global Centroid Moment Tensor (CMT) (Dziewonski et al., 1981; Ekstrom et al., 2003) are labeled with event date and doublet/cluster ID where applicable. Source parameters of the doublets/clusters are listed in Tables 1, 2. Background deep seismicity is shown as gray dots. Black lines indicate the slab contours below 300 km depth (Gudmundsson and Sambridge, 1998), with an interval of 100 km. Regional map of the Tonga–Fiji–Kermadec subduction zone is shown in the inset, with gray dotted box indicating the region blow-up in the main figure. Black lines are the slab contours below 300 km depth and the Tonga–Kermadec trench (Bird, 2003). The color version of this figure is available only in the electronic edition.
UPDATE: 2017.01.03 20:15 PST:
- Here is a plot from here that shows focal mechanisms from the Global Centroid Moment Tensor (GCMT) catalog. This is from an online webGIS from earth-analysis.com. Here is the map interface.

References:
- Auzende, J-M., Pelletier, B., Lafoy, Y., 1994. Twin active spreading ridges in the North Fiji Basin (southwest Pacific) in Geology, v. 22, p. 63-66.
- Benz, H.M., Herman, Matthew, Tarr, A.C., Furlong, K.P., Hayes, G.P., Villaseñor, Antonio, Dart, R.L., and Rhea, Susan, 2011. Seismicity of the Earth 1900–2010 eastern margin of the Australia plate: U.S. Geological Survey Open-File Report 2010–1083-I, scale 1:8,000,000.
- Hayes, G.P., Wald, D.J., and Johnson, R.L., 2012. Slab1.0: A three-dimensional model of global subduction zone geometries in, J. Geophys. Res., 117, B01302, doi:10.1029/2011JB008524
- Martin, A.K., 2013. Double-saloon-door tectonics in the North Fiji Basin in EPSL, v. 374, p. 191-203.
- Martin, A.K., 2014. Concave slab out board of the Tonga subduction zone caused by opposite toroidal flows under the North Fiji Basin in Tectonophysics, v. 622, p. 56-61.
- Okal, 1997. A reassessment of the deep Fiji earthquake of 26 May 1932 in Tectonophysics v., 275, p. 313-329.
- Richards, S., Holm., R., Barber, G., 2011. When slabs collide: A tectonic assessment of deep earthquakes in the Tonga-Vanuatu region, Geology, v. 39, pp. 787-790.
- Schellart, W., Lister, G. and Jessell, M. 2002. Analogue modelling of asymmetrical back-arc extension. In: (Ed.) Wouter Schellart, and Cees W. Passchier, Analogue modelling of large-scale tectonic processes, Journal of the Virtual Explorer, Electronic Edition, ISSN 1441-8142, volume 7, paper 3, doi:10.3809/jvirtex.2002.00046
- Yu, W. and Wen, L., 2012. Deep-Focus Repeating Earthquakes in the Tonga–Fiji Subduction Zone, BSSA, v. 102, no. 4, pp. 1829-1849