While waiting to board my plane from Sydney (AU) to SFO, I put together an interpretive poster for the M 7.0 earthquake offshore of El Salvador from today. I will spend more time later adding more information, including some background material about this subduction zone and some of the materials that I include in this poster. Generally, I use the same type of data that I include in my other earthquake posters. I will add that information here later (need to board my plane now). Here is the USGS website for this earthquake.
I have some maps that show the historic earthquakes in this region that I will upload later (probably as an update to this initial report).
Here is my interpretive poster for the extensional earthquake that is in the downgoing (subducting) Cocos plate. This earthquake has a shallow depth and produced a small tsunami run-up.
I also include the shaking intensity contours on the map. These use the Modified Mercalli Intensity Scale (MMI; see the legend on the map). This is based upon a computer model estimate of ground motions, different from the “Did You Feel It?” estimate of ground motions that is actually based on real observations. The MMI is a qualitative measure of shaking intensity. More on the MMI scale can be found here and here. This is based upon a computer model estimate of ground motions, different from the “Did You Feel It?” estimate of ground motions that is actually based on real observations.
I placed a moment tensor / focal mechanism legend on the poster. There is more material from the USGS web sites about moment tensors and focal mechanisms (the beach ball symbols). Both moment tensors and focal mechanisms are solutions to seismologic data that reveal two possible interpretations for fault orientation and sense of motion. One must use other information, like the regional tectonics, to interpret which of the two possibilities is more likely.
- In the upper right corner is a map from Funk et al. (2009) that shows focal mechanisms for earthquakes in this region. These data are from the Harvard Centroid Moment Tensor (CMT) catalog for all earthquakes from 1976 to 2007. The region outlined in dashed red lines shows the limit for the Funk et al. (2009) summary figure in the lower right corner and the map and cross section on the left side of the poster.
- In the lower right corner is a tectonic summary figure from Funk et al. (2009). The authors suggest that there is a forearc sliver in this region. A forearc sliver is a large plate boundary scale strike-slip fault bounded block that is formed due to strain partitioning. When the relative plate motion at a subduction zone are not perpendicular to the megathrust fault, the motion that is perpendicular is accommodated by the megathrust fault. The plate motion that is not perpendicular to the subduction zone fault is accommodated by strike-slip faults parallel to the strike of the subduction zone fault. The authors place red arrows showing the relative motion along the plate bounding fault along the eastern boundary of this forearc sliver (these are called forearc sliver faults for obvious reasons). A classic example of a forearc sliver fault is the Sumatra fault along the Sunda subduction zone. Forearc sliver faults do not always bound a block like this and are not always parallel to the plate boundary. The Cascadia subduction zone has a series of forearc sliver faults offshore, but these are formed oblique to the plate boundary. For the case in cascadia, the plate margin parallel strain is accommodated by rotating blocks, not rigid blocks. As these blocks rotate in response to this shear couple, they rotate and form strike-slip faults between the blocks (forming “bookshelf” faults). Another plate where relative oblique motion creates rotating blocks is along the Aleutian subduction zone.
- On the left part of the poster I include a map and some cross sections (Funk et al., 2009). The map shows epicenters from 1995-2003. The locations of the cross sections B, C, D, and E are designated by red lines. Arc volcanoes plotted in the cross sections are also shown on the map. The cross sections show the hypocenters from the earthquakes plotted on the map.
- To the right of these Funk et al. (2009) figures, I include a subset of figures from Benz et al. (2010). There is a map that shows USGS epicenters with dots colored by depth and magnitude represented by circle diameter. There is also a cross section for this region, just to the northwest of El Salvador. Cross section B-B’ shows the earthquake hypocenters along a profile displayed on the map. Note how the subduction zone dip steepens to the northeast.
Inset Figures
I include some inset figures. Here is some information about them. Below I include the original figures with the figure captions as blockquotes.

- Here is the focal mechanism summary map from Funk et al. (2009). The authors depict the forearc sliver as a shaded red region. Note the strike-slip focal mechanisms in the region on the northeast of the forearc sliver.
- Here is the seismicity map and cross sections for the region to the southeast of El Salvador. The subduction zone in the El Salvador region is depicted by cross section B. Note that the subduction zone has a low angle dip in the shallow region of the fault, then steepens to 55 degrees to the east.
- Here is the summary figure from Funk et al. (2009). This map shows the detailed fault mapping the authors prepared for their manuscript. Their observations include field mapping and seismic profiles. There are several parts of this forearc sliver fault system that show how the strike-slip system bends and steps. There are restraining bends (where the s-s fault generates compression) and releasing bends (where the s-s fault generates extension). These regions are colored red and green, respectively. In the Marabios En Exchelon segment of this map there are some plate margin obvlique extensional fault bounded basins. These appear to be formed by bookshelf style faulting.

Tectonic setting of Central America displayed on satellite topography and bathymetry from Sandwell and Smith (1997). Subduction of the Cocos plate beneath the Caribbean plate occurs along the Middle America Trench. Global positioning system (GPS)–based plate velocities are relative to a fixed Caribbean plate, and focal mechanisms are from the Harvard Centroid Moment Tensor (CMT) catalog for all events from 1976 to 2007. Northwestward arc-parallel translation of the Central America forearc sliver (red shading) occurs at 7–8 mm yr–1 on Nicoya Peninsula of Costa Rica (Norabuena et al., 2004) and 14 mm yr–1 in Nicaragua (DeMets, 2001). The boundary between the Caribbean and North American plate occurs along the left-lateral strike-slip Swan Islands fault zone (SIFZ), Polochic fault (PF), and Motagua fault (MF).

(A) Earthquake locations are from the National Earthquake Information Center (NEIC) and, in Nicaragua, were recorded by the local Nicaragua network from 1995 to 2003 operated by the Instituto Nicaraguense de Estudios Territoriales (INETER ). (B–E) Earthquake profiles are perpendicular to the Middle America Trench (MAT) and extend to the interior volcanic highlands of Central America. These profiles merge all earthquakes within a 50-km-wide swath along each transect. Seismic activity beneath the volcanic front in Nicaragua is more evident because of more data from local stations of the Nicaraguan seismic network. These shallow crustal earthquakes commonly occur within the upper 30 km of the crust and are concentrated within ~25 km of the active Central America volcanic front (CAVF).

Regional tectonic map of Central America emphasizing key structures described in this paper. The El Salvador fault zone (ESFZ) is characterized by a broad right-lateral shear zone accommodating transtensional motion that results in multiple pull-apart basins . A major transition zone occurs in the Gulf of Fonseca, where strike-slip fault zones along the Central American forearc sliver change strike from dominantly east-west strikes in El Salvador to northwesterly strikes in Nicaragua. A proposed restraining bend connects faults mapped in the Gulf of Fonseca with fault scarps deforming Cosiguina volcano and faults of the Central America volcanic front north of Lake Managua . Diffuse and poorly exposed faults parallel to the Central America volcanic front in northern Nicaraguan segment are inferred to represent a young fault boundary in which right-lateral shear is accommodated over a broad zone. This model proposes a young en echelon pattern of strike-slip and secondary faults based on secondary extensional features and fi ssure eruptions along the Marabios segment of the Central America volcanic front. Lake Managua and the Managua graben are interpreted to occur at a major releasing bend in the trend of the Nicaraguan depression and are marked by the curving surface trace of the Mateare fault interpreted from aeromagnetic data. Subsequent right-lateral strike-slip motion related to translation of the Central America forearc sliver may occur along these reactivated normal faults. The Lake Nicaragua segment of the Central America volcanic front is bounded by a normal fault (LNFZ—Lake Nicaragua fault zone) offsetting the Rivas anticline, the southeastward continuation of this normal fault into Costa Rica (CNFZ—Costa Rica fault zone), and a synthetic normal fault (SRFZ—San Ramon fault zone) that we discovered in our survey of Lake Nicaragua. Transverse faults (MFZ—Morrito fault zone, JMFZ—Jesus Maria fault zone) strike approximately east-west across the Central America volcanic front. North-south–trending rift zones are abundant in El Salvador but less common in Nicaragua and may also be controlled by regional east-west extension affecting the northwestern corner of the Caribbean plate.
- Here is a map and cross section of seismicity that was written about an earthquake pair that happened in 2001 from Martínez-Díaz et al. (2004). In January 2001 there was a M 7.7 earthquake in the downgoing Cocos plate. In February there was a M 6.6 earthquake in the Caribbean plate, which was probably triggered by the January quake. The triggered M 6.6 quake was a strike-slip earthquake on along the plate boundary forearc sliver, the El Salvador fault zone (ESFZ). I include other figures below.
- Here are the USGS websites for the major earthquakes discussed by Martínez-Díaz et al. (2004).
- 1982.06.19 M 6.2 El Salvador (may have triggered an earthquake in 1986)
- 2001.01.13 M 7.7 El Salvador
- 1982.06.19 M 6.6 El Salvador (may have been triggered by M 7.7)
- Here is a map that shows focal mechanisms for large earthquakes in the region from 1977-2001. The ESFZ is visible on the shaded relief map (the fault creates enough topography to be shown at the scale of kms).
- Here is a map that shows how the afershocks (of the M 6.6) were limited to two segments of the ESFZ.
- Here are some figures that show the modeled changes in static coulomb stress generated by earthquakes in 1982 and 2001. Regions that get increased in stress following an earthquake are plotted in red and regions that have lowered levels of stress are in blue. We do not know what the state of stress is on any fault at any given time. The changes in stress in these regions are very small compared to the stresses that faults release during earthquakes (so, the possibility that a fault my be triggered by these small changes is also very small). Generally, a fault would need to be at a high state of stress to be triggered by an earthquake in this manner.
- Panels A, B, and C are maps showing coulomb stress changes for the 1982 series and the 2001 series. Panel D is a cross section for the 2001 sequence. Note how the 1986 and Feb 2001 faults are in regions of increased stress. Also note how the ESFZ in regions adjacent to the Feb 2001 earthquake have increased stress.
- Finally, here are the hypocenters shown with a low angle oblique view. The upper figure shows aftershocks for the Jan 2001 earthquake and the lower figure shows the aftershocks for the Feb earthquake.
A: Geodynamic setting of study area. Line within box indicates trace of cross sections B and C. Plate motion direction and rates are shown by arrows (data from DeMets, 2001). B: Cross section passing through coordinates 13.938N, 88.788W. Focal mechanisms were taken from Harvard Centroid Moment Tensor (CMT) and U.S. Geological Survey–National Earthquake Information Center (USGS-NEIC) catalogues (period 1977–February 2003). Gray dots are hypocenters from USGSNEIC database (Ms >2.5). Dashed lines represent estimation of upper and lower bounds of seismogenic zone of subducted slab. C: Cross section of 2001 seismic sequence of El Salvador following two main shocks of January and February. Hypocenters are from Servicio Nacional de Estudios Territoriales catalogue and focal mechanisms are from Harvard CMT and USGS-NEIC catalogues.
Radar–Shuttle Radar Topography Mission image of El Salvador (courtesy of Jet Propulsion Laboratory) with historical destructive earthquakes (white circles) and instrumental epicenters (Ms >2.5, period 1977–2001) from U.S. Geological Survey–National Earthquake Information Center (USGS-NEIC) catalogue (small dots). Small focal mechanisms are from events with Mw >5.5 (period 1977–2001, Harvard Centroid Moment Tensor database). Large mechanisms are from Buforn et al. (2001). Inset: map of faults extracted from Geological Map of El Salvador (Bosse et al., 1978). ESFZ—El Salvador fault zone.
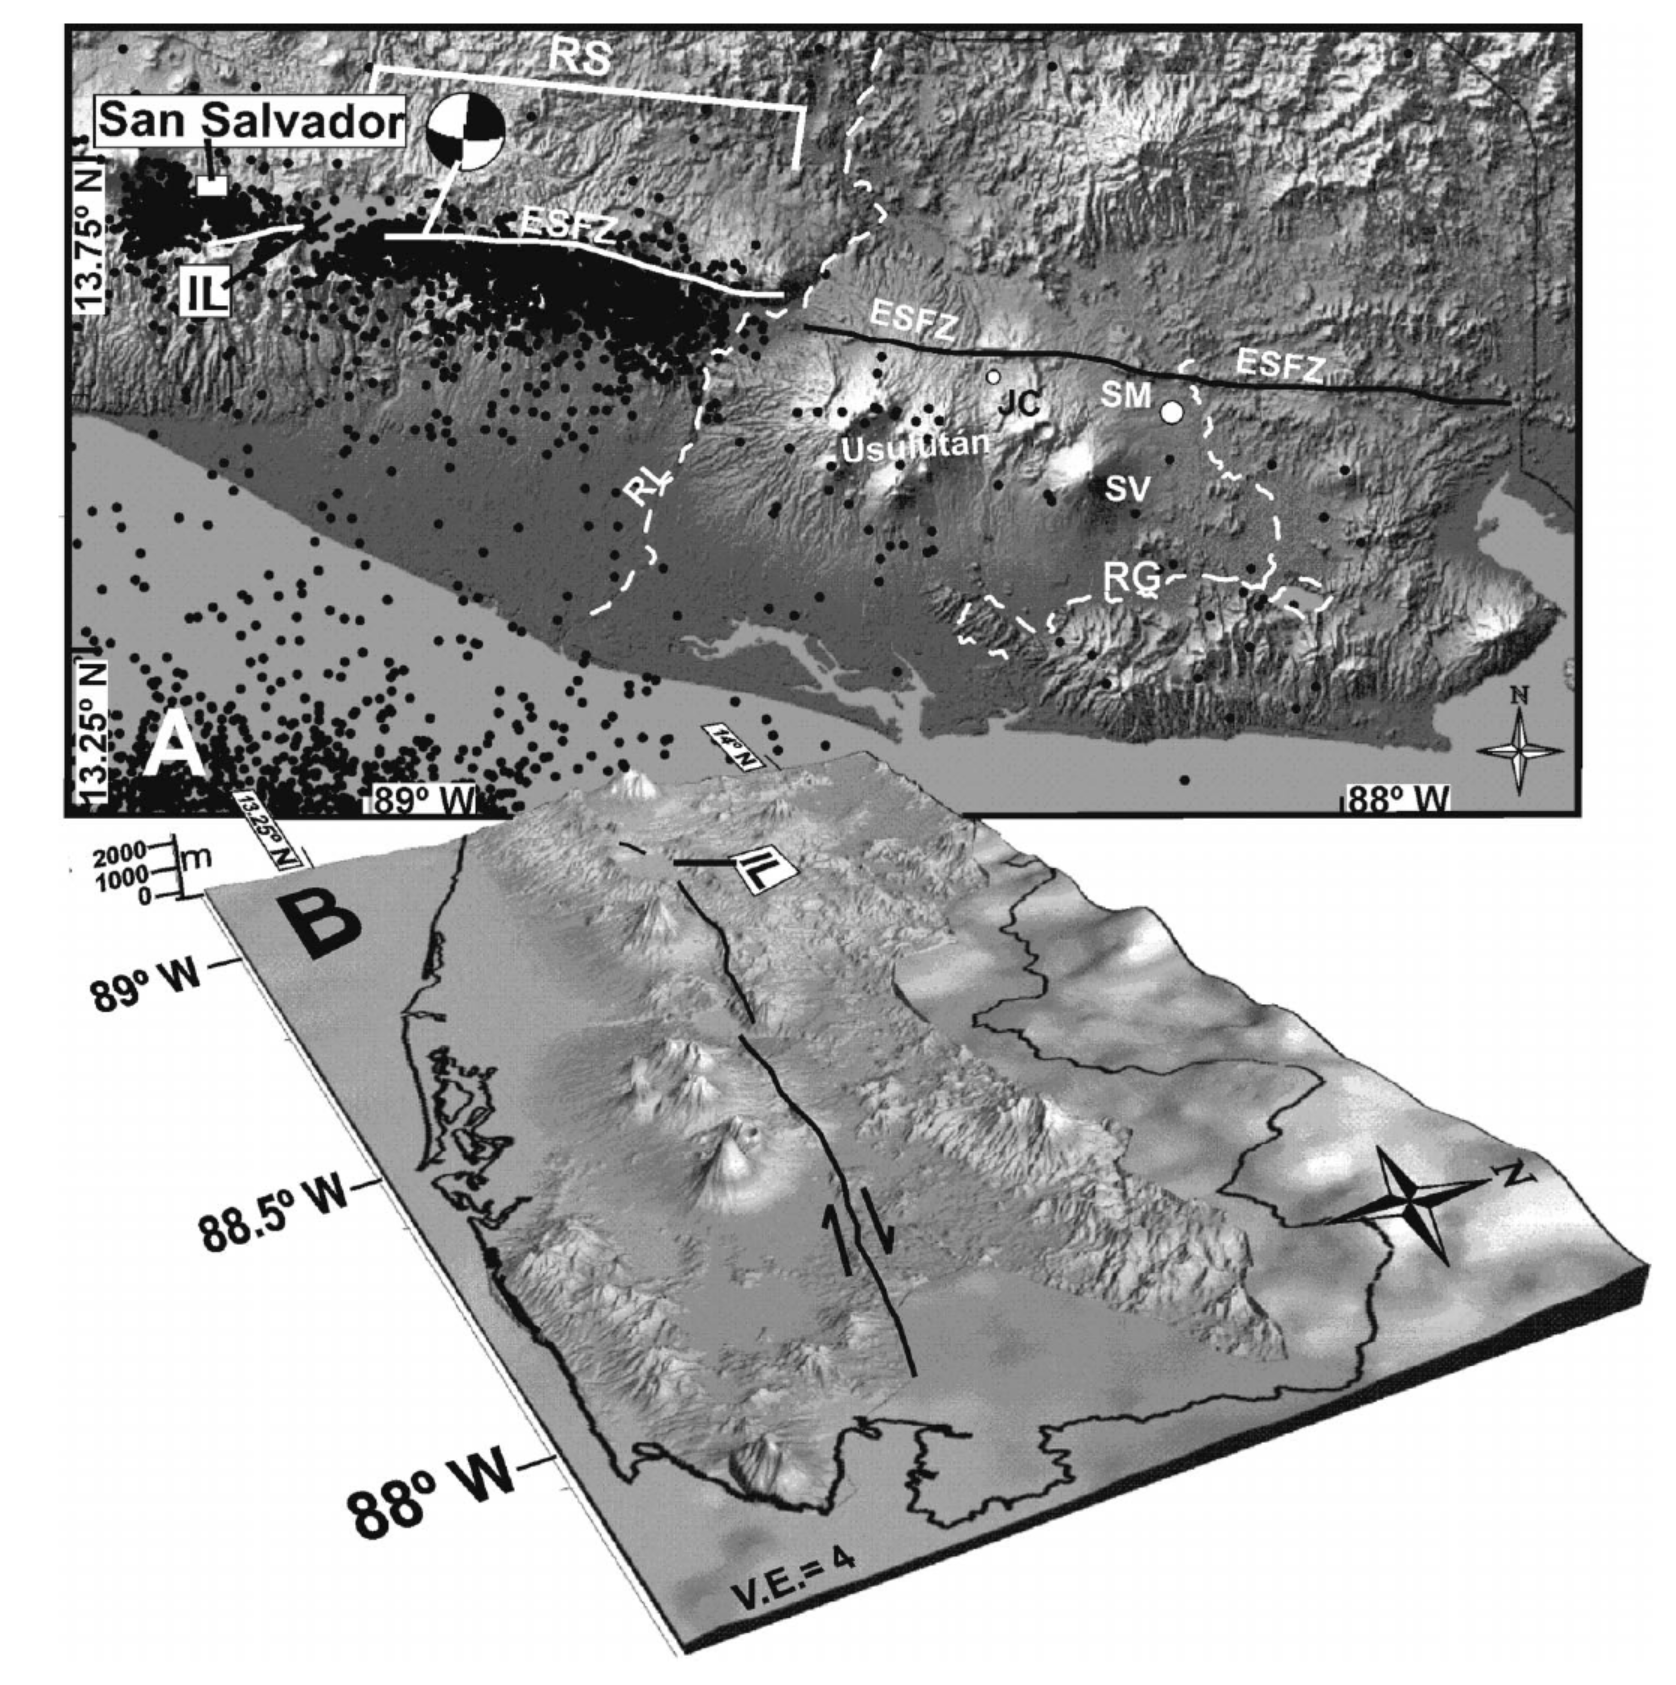
A: Aftershocks sequence of February 2001 (Mw 6.6) event projected on Radar image of El Salvador fault zone (ESFZ). SM—San Miguel; SV—San Miguel volcano; IL—Lago Ilopango; RS—rupture segment; JC—Jucuapa; RL—Rio Lempa; RG—Rio Grande. B: Oblique view of digital elevation model of volcanic arc with ESFZ trace.
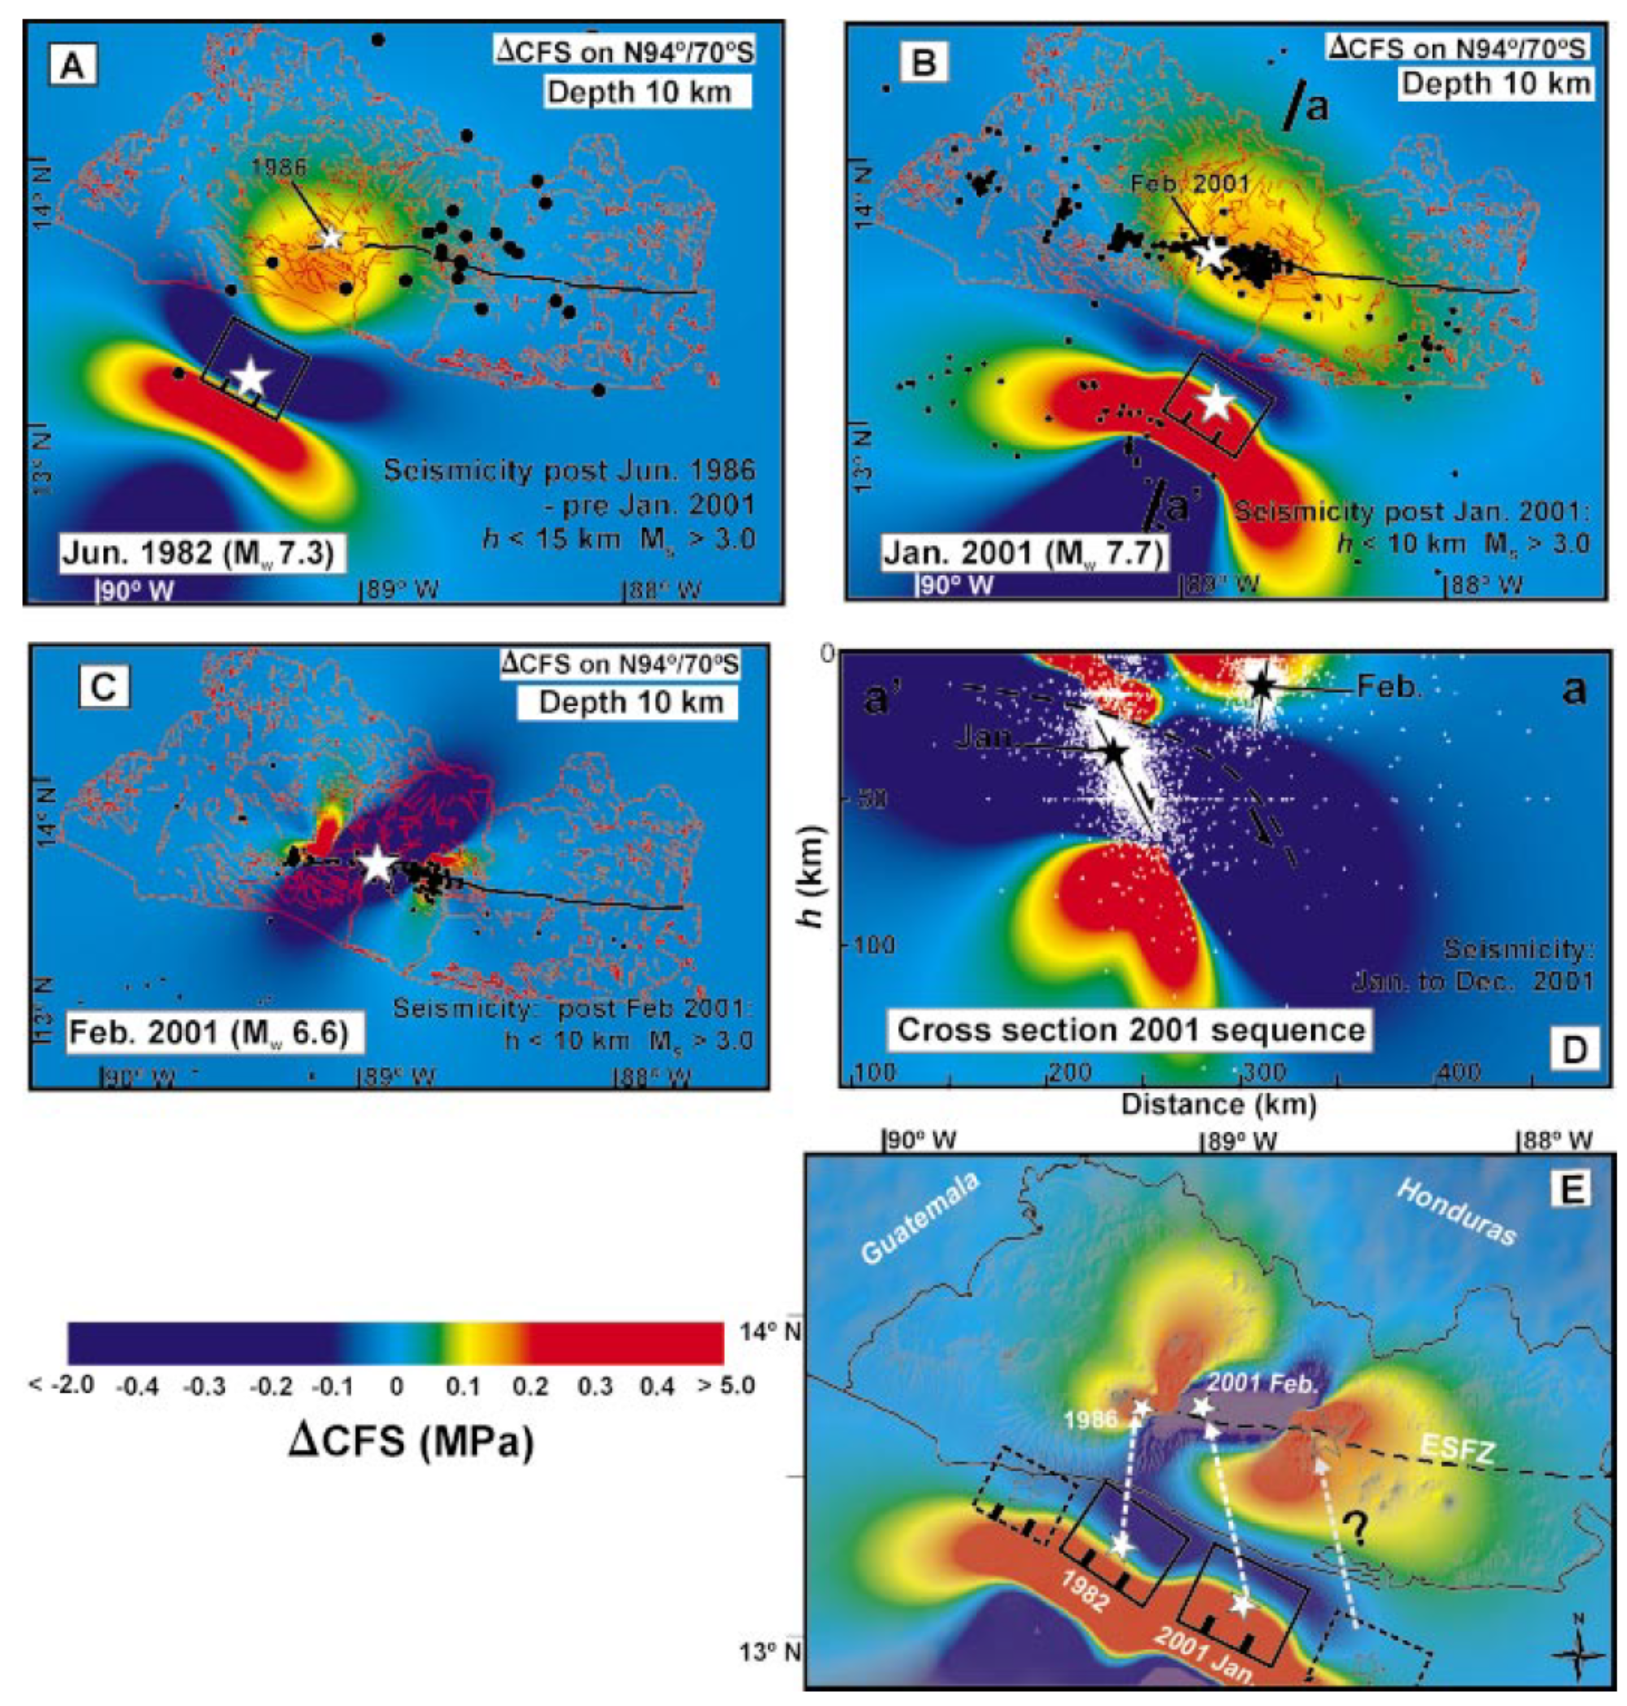
A–C: Models of change in static Coulomb failure stress (CFS) generated after events of 1982, January 2001, and February 2001 projected on map of faults. Black line represents El Salvador fault zone (ESFZ). D: Model for 2001 event is shown in cross section. E: Joint model with CFS change generated by three major events. Rectangles represent surface ruptures. Dotted rectangles represent hypothetical ruptures.
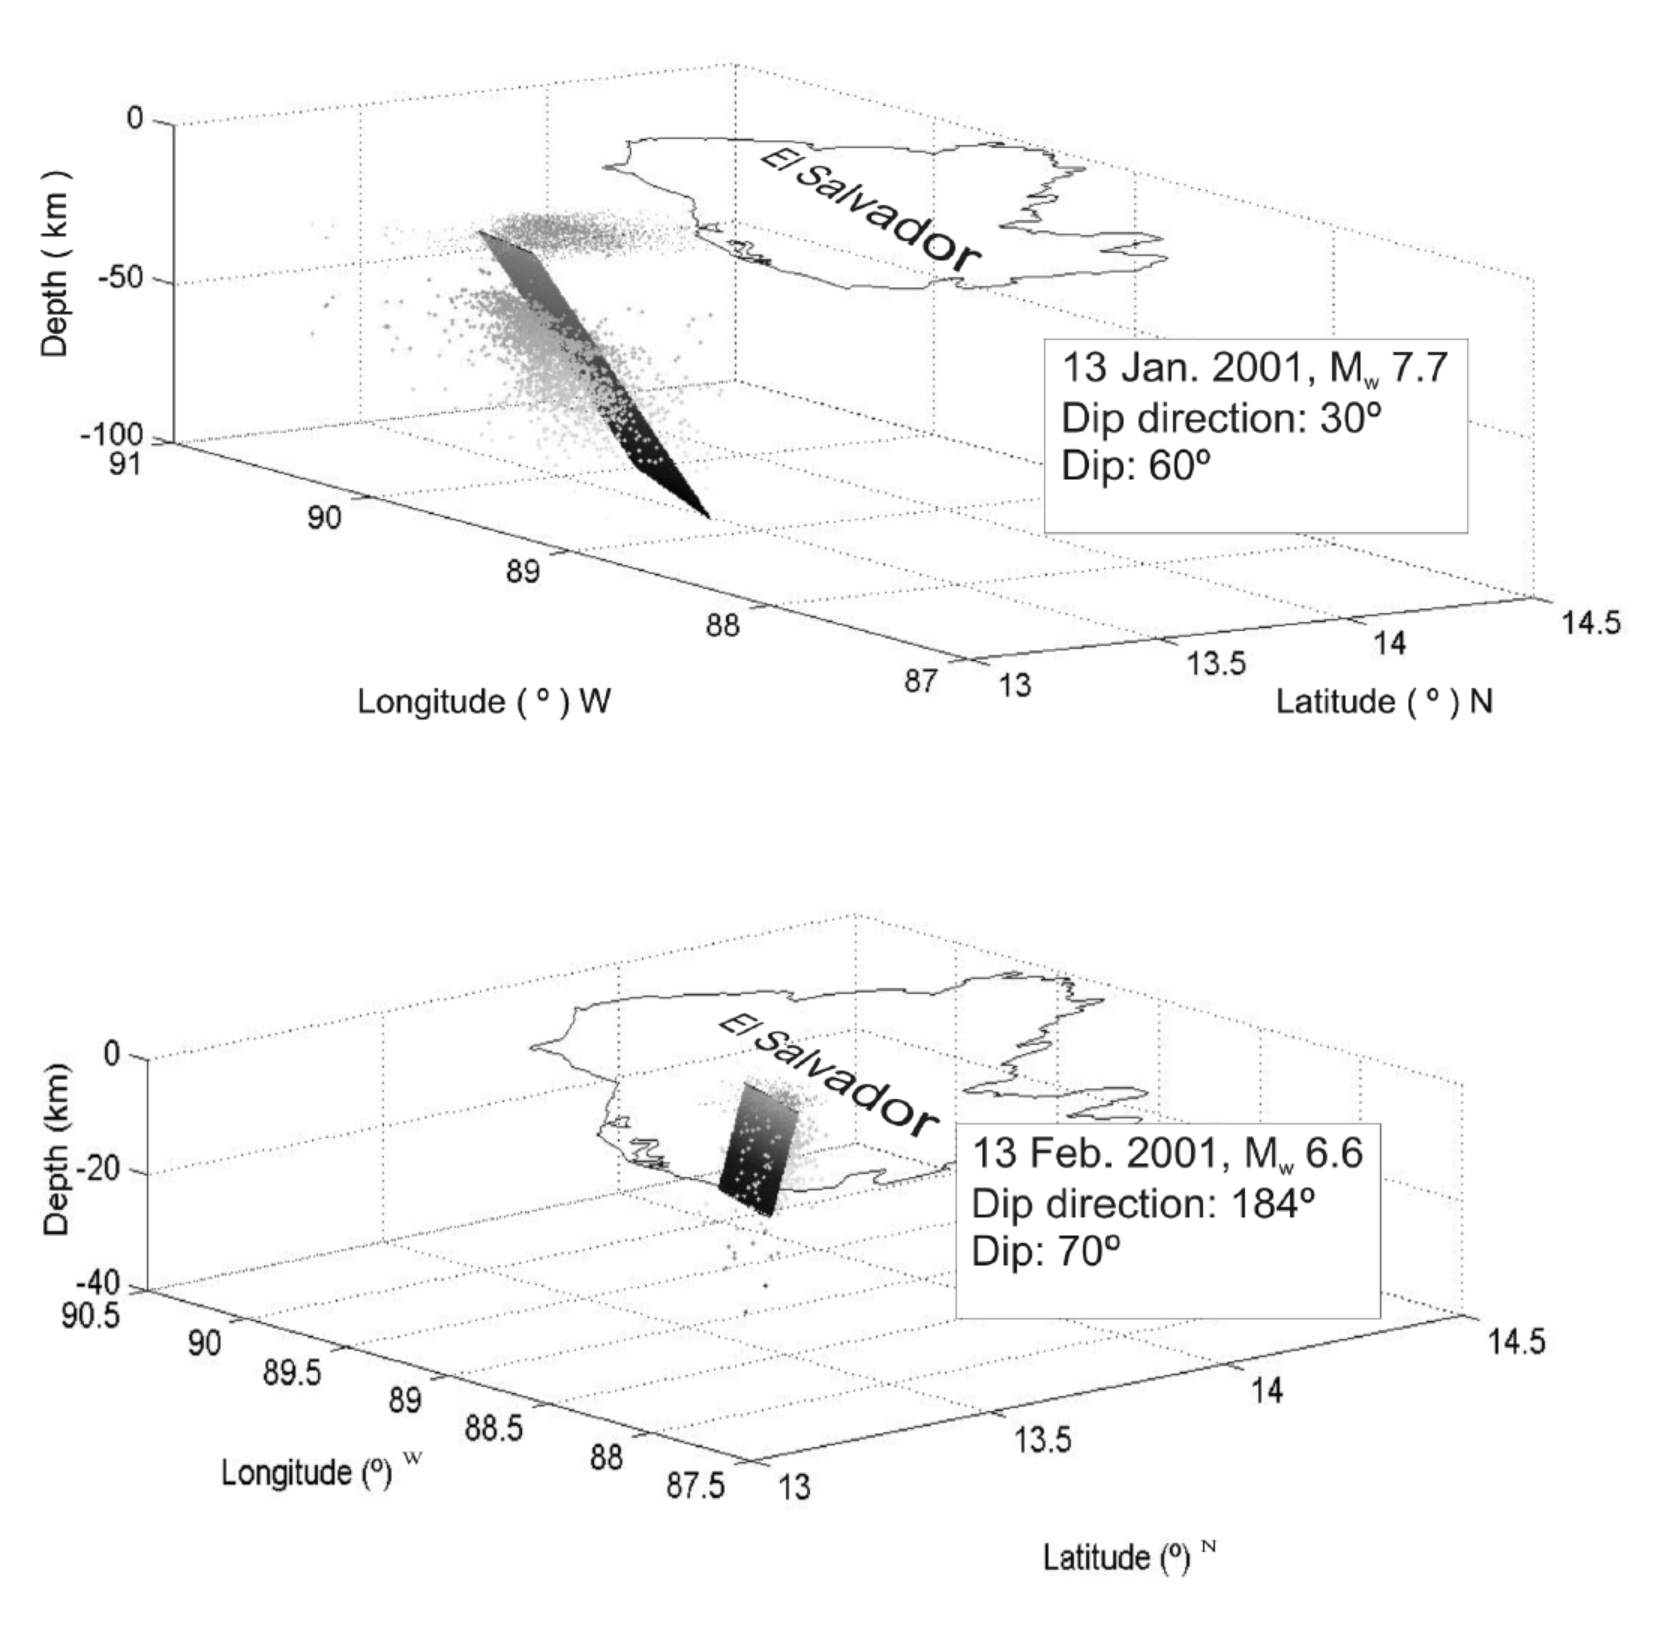
Fault planes of main shocks fitted to aftershocks of the first three days, with the epicentres and outline of El Salvador. A. Representation for the 13 January Mw 7.7 event. The fault trace is subparallel to the coast. B. Representation for the 13 February Mw 6.6 event.
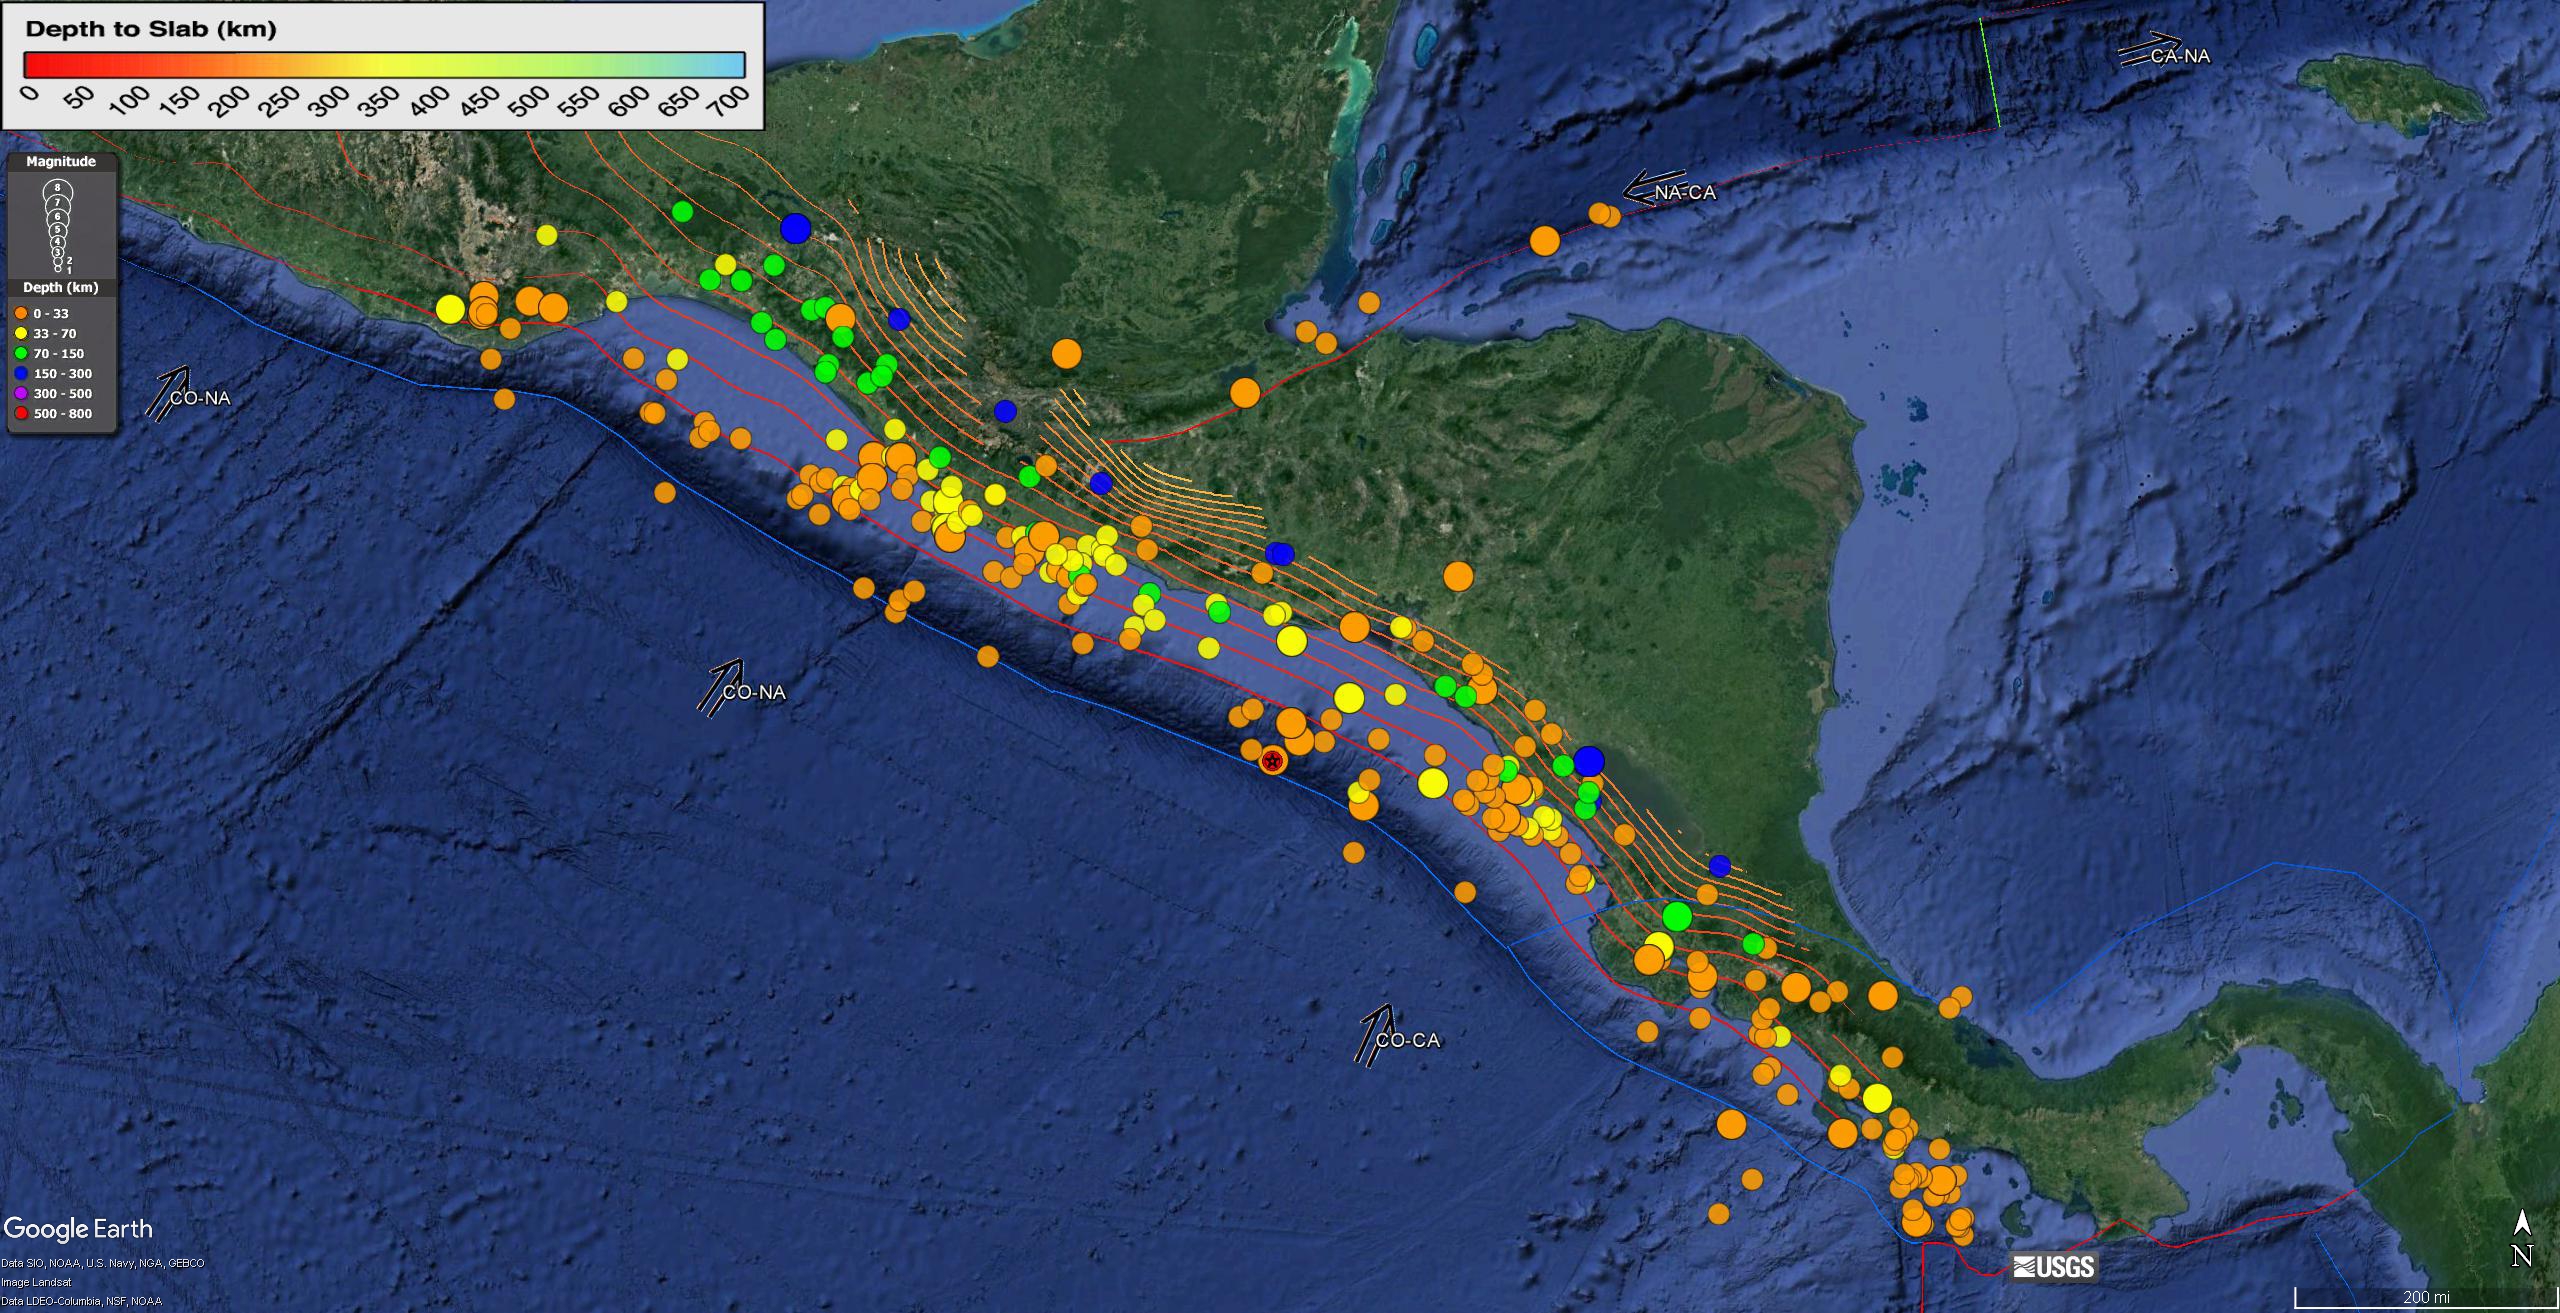
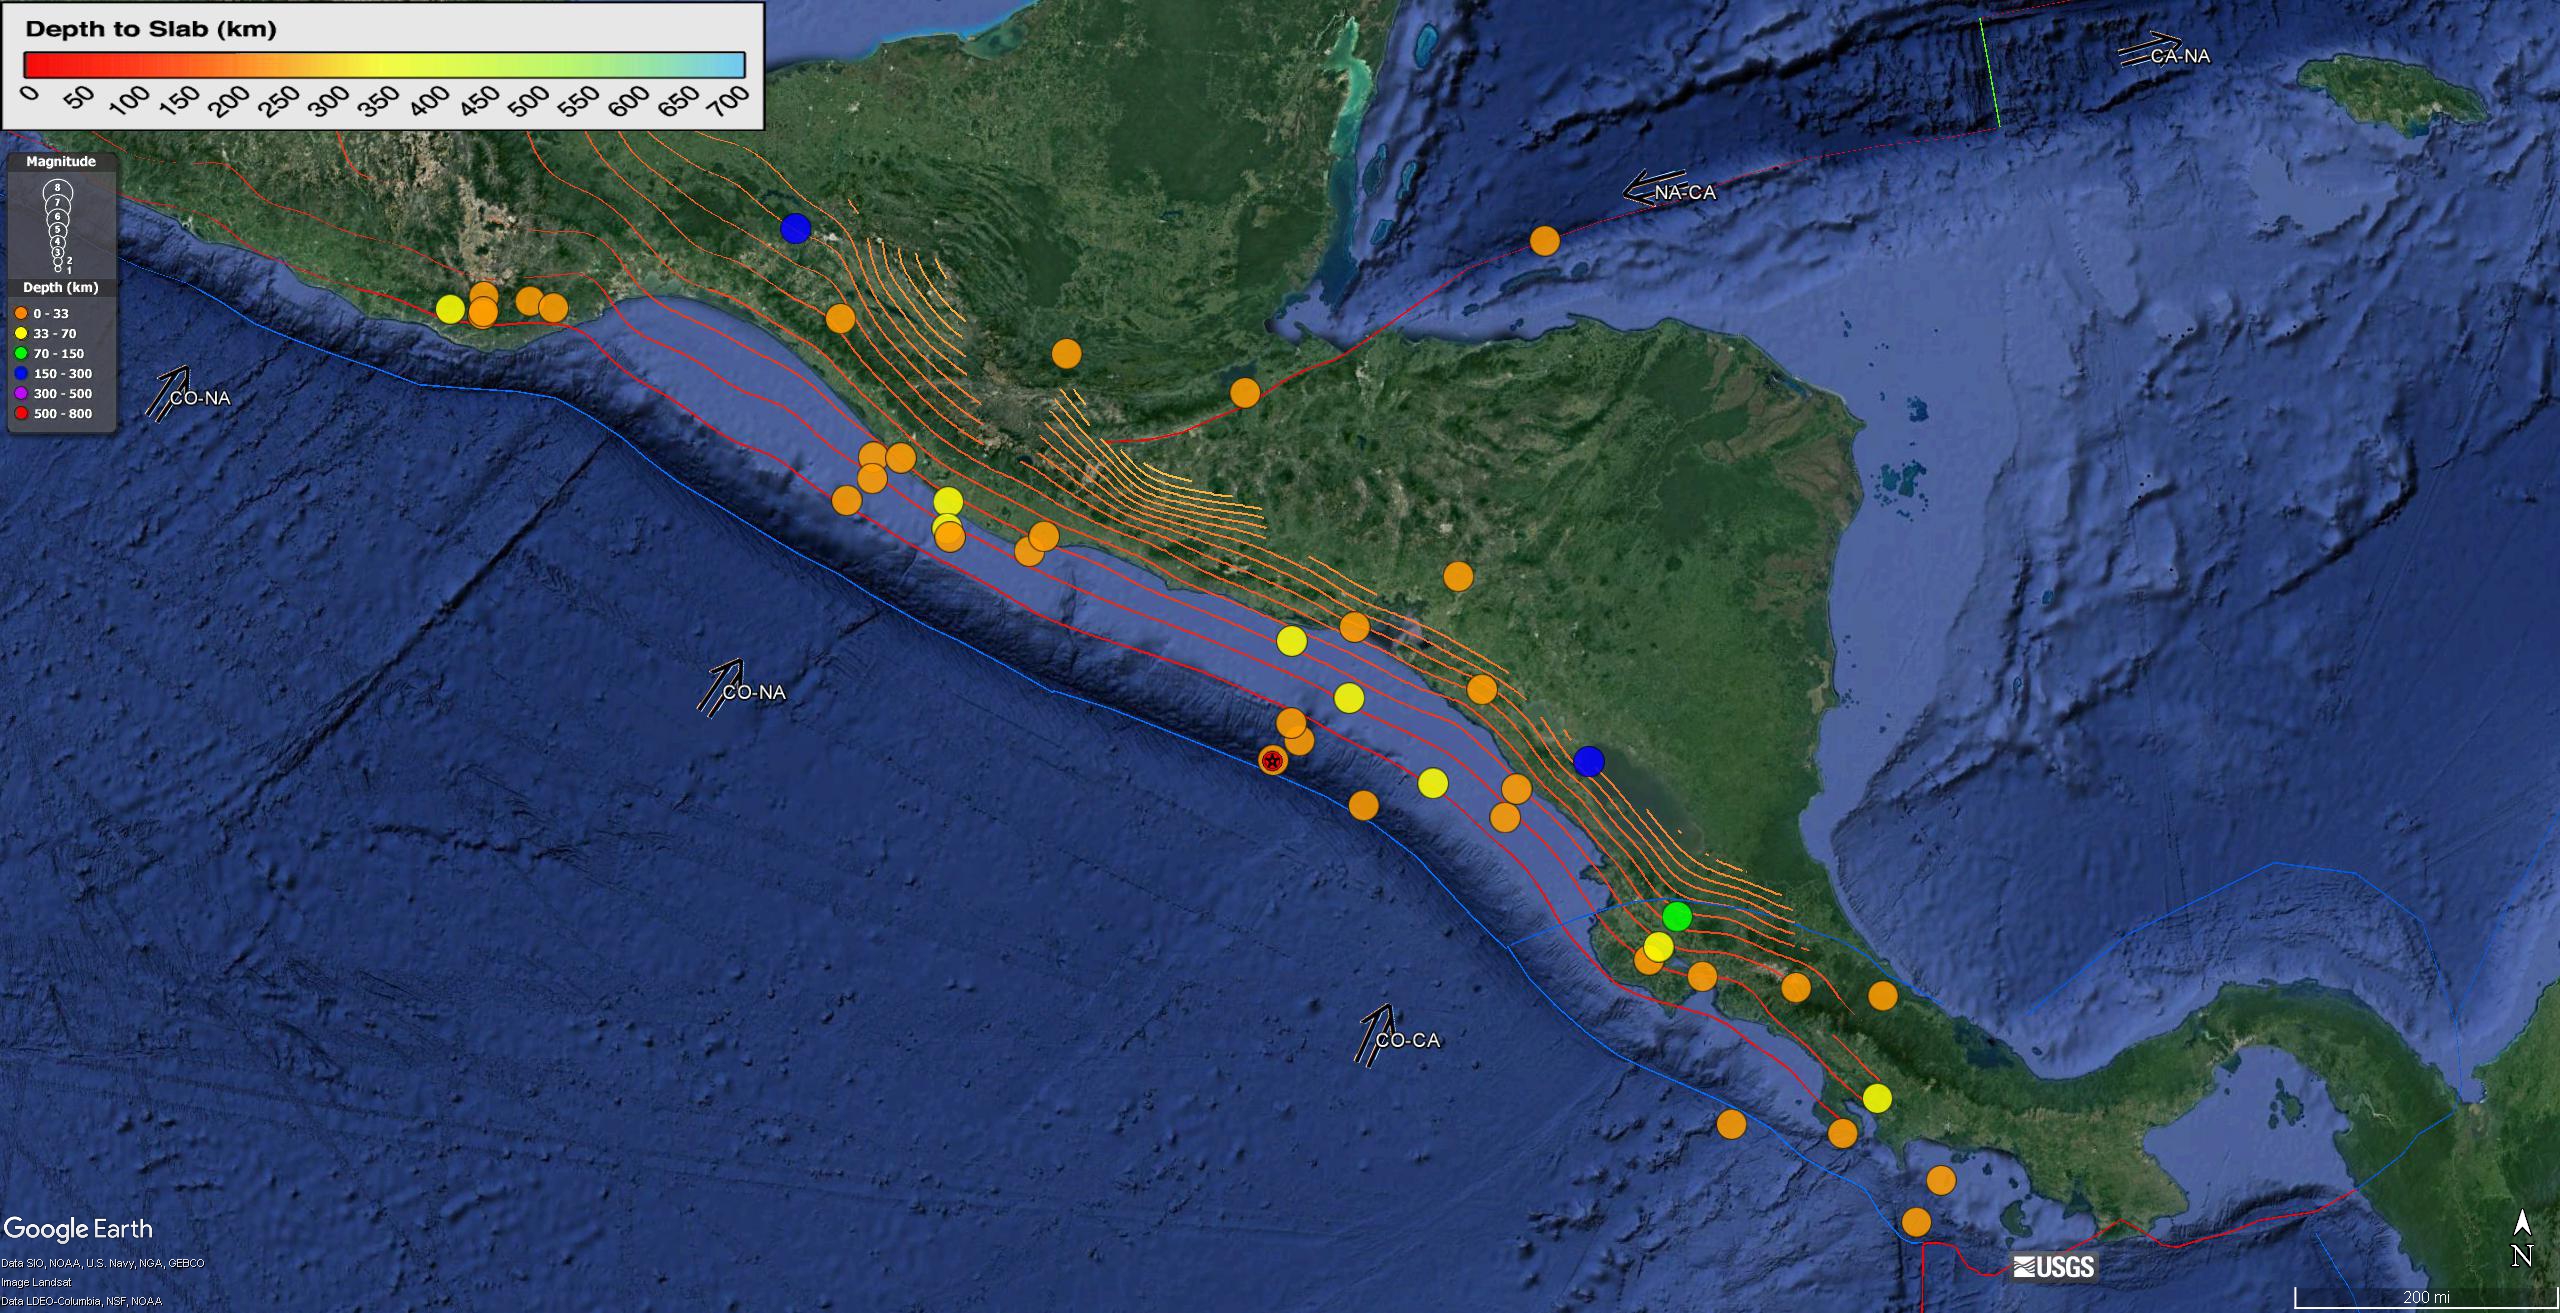
- Here is a map that shows earthquakes from the NEIC for the region from 1900 to 2016, for magnitudes greater than or equal to M 6.0. The color of the dot represents the hypocentral depth of the earhquake. Note how the earthquakes fenerally get deeper along with the subduction zone megathrust. Some do not for earthquakes in the Caribbean plate and along the Swan Islands fault zone. The lower map shows earthquakes M ≥ 7.0.
- Here are the USGS queries I used for the maps below.
- Earthquakes from 1900-2016 for magnitudes M ≥ 6.0 USGS
- Earthquakes from 1900-2016 for magnitudes M ≥ 7.0 USGS
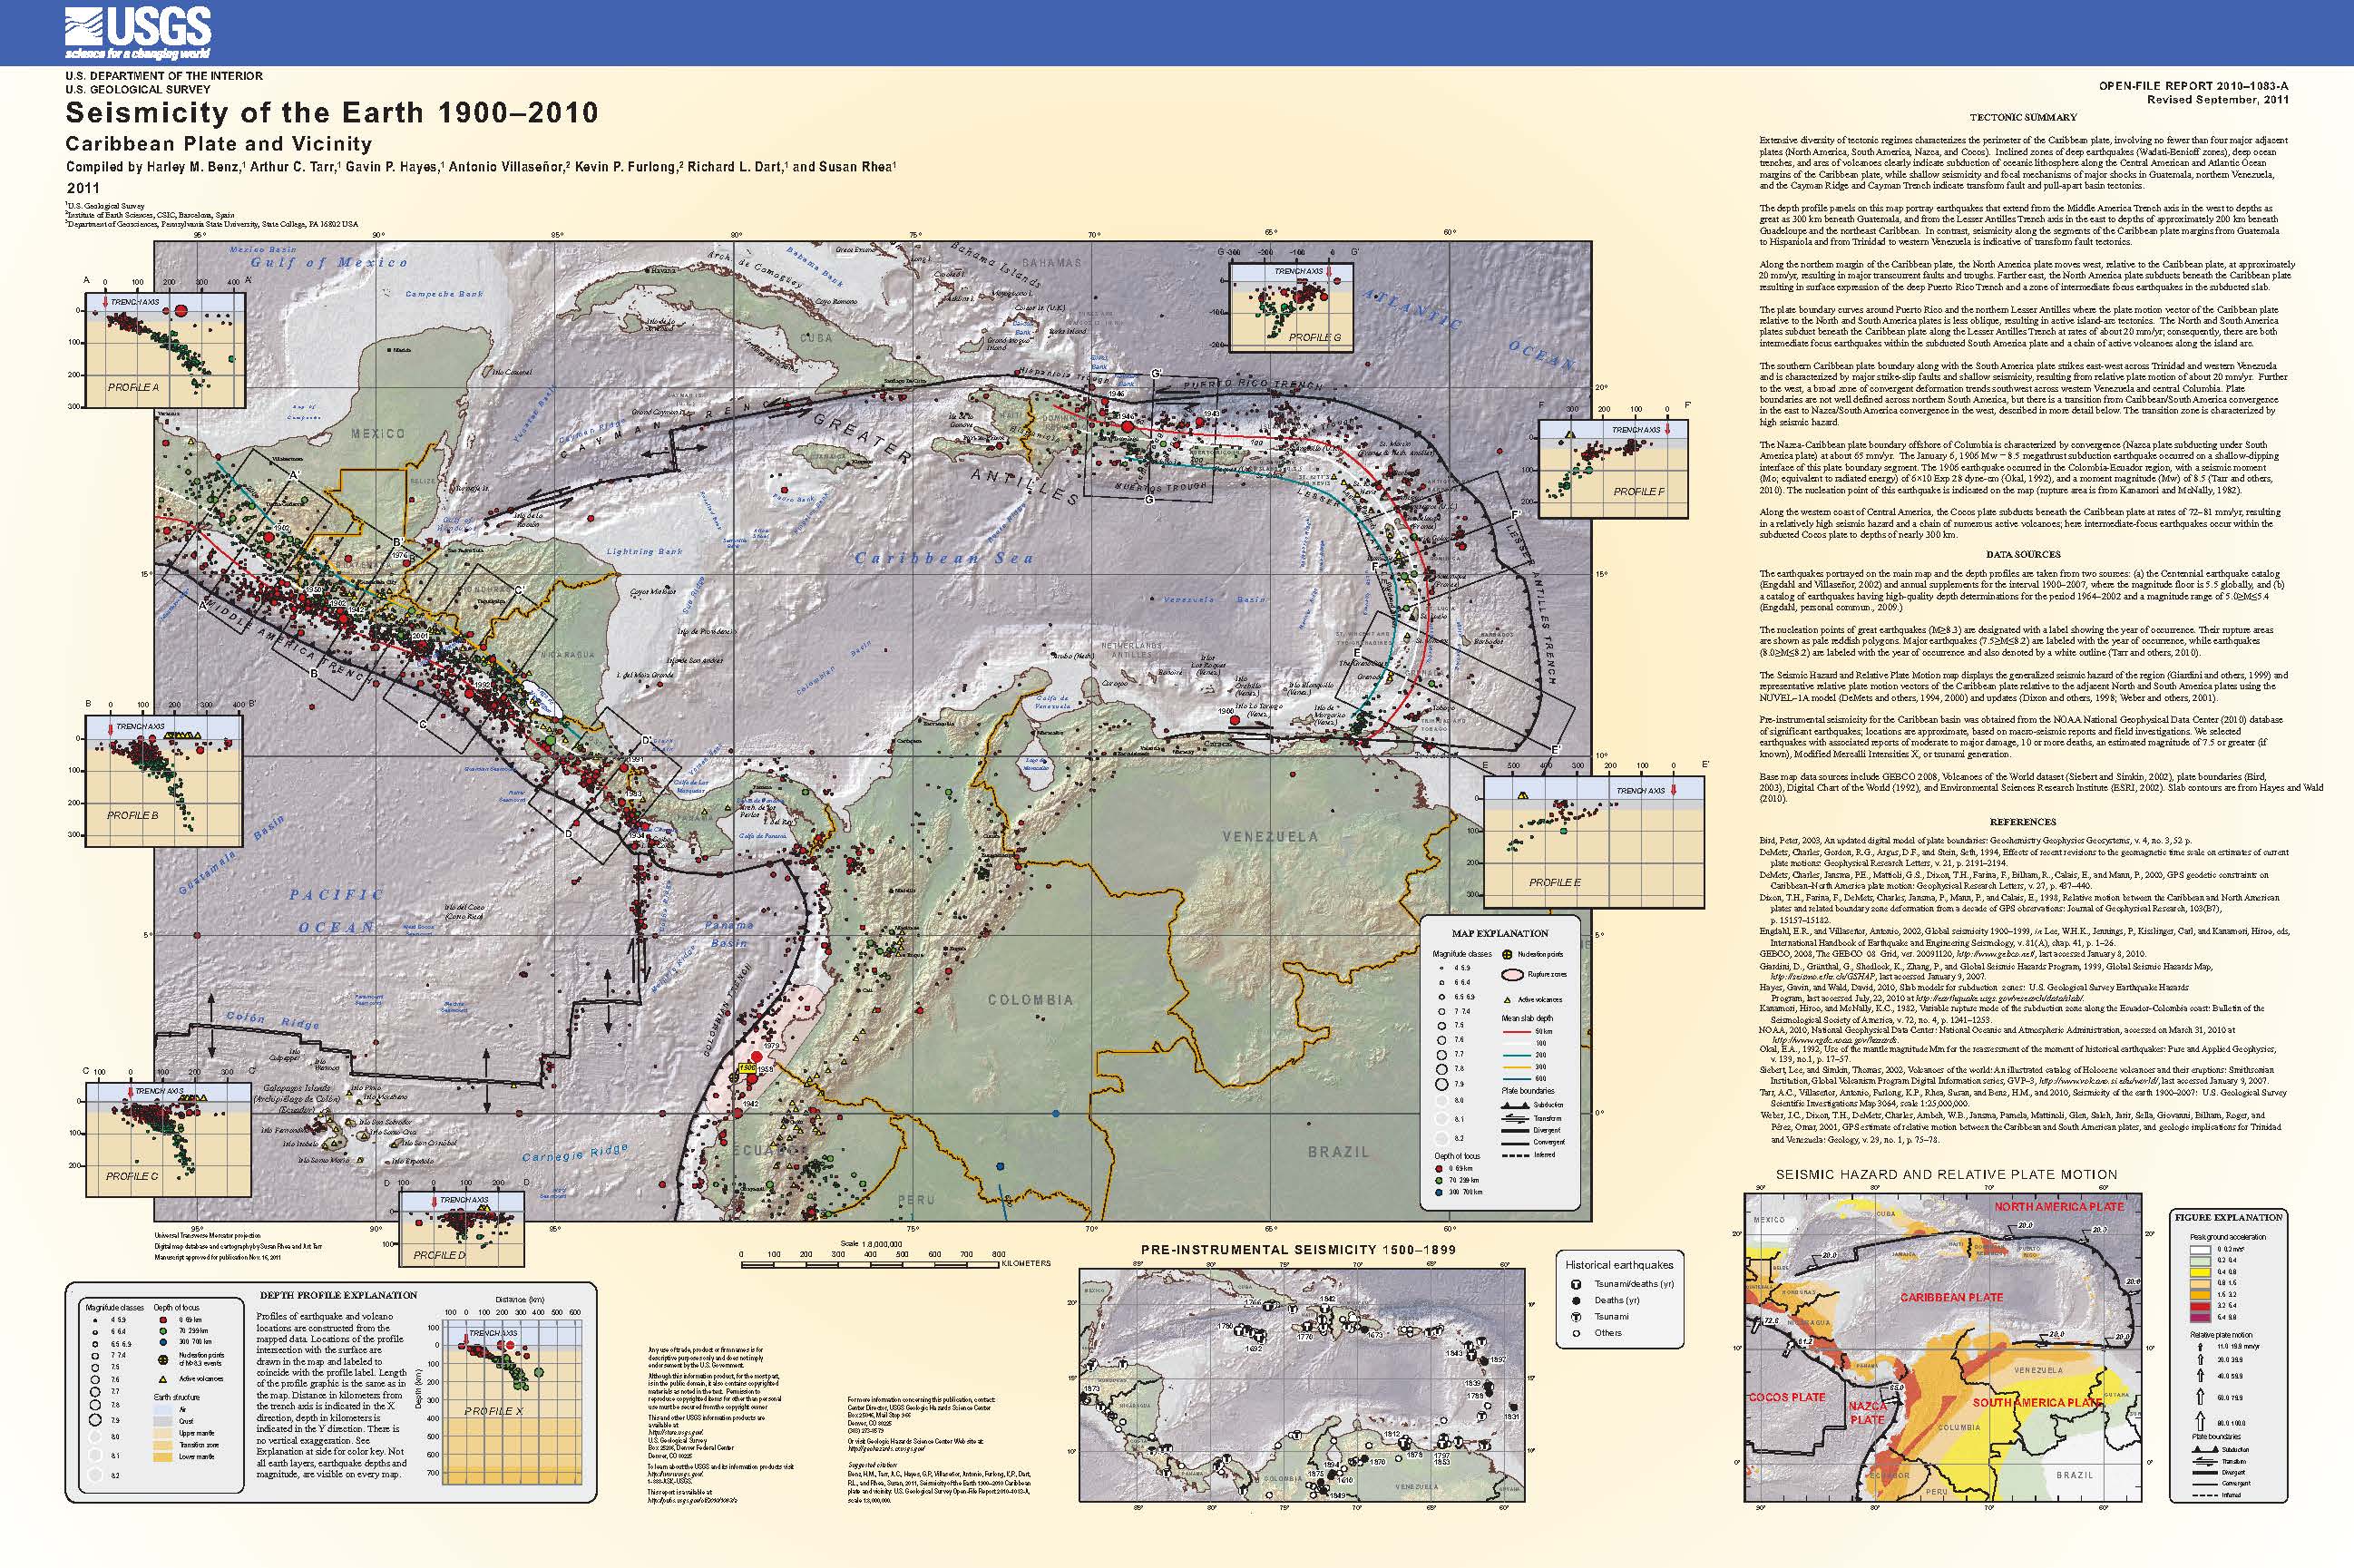
- Here is the “seismicity of the Earth” USGS series poster for this region. Click on the thumbnail below for the pdf version (13 MB pdf).
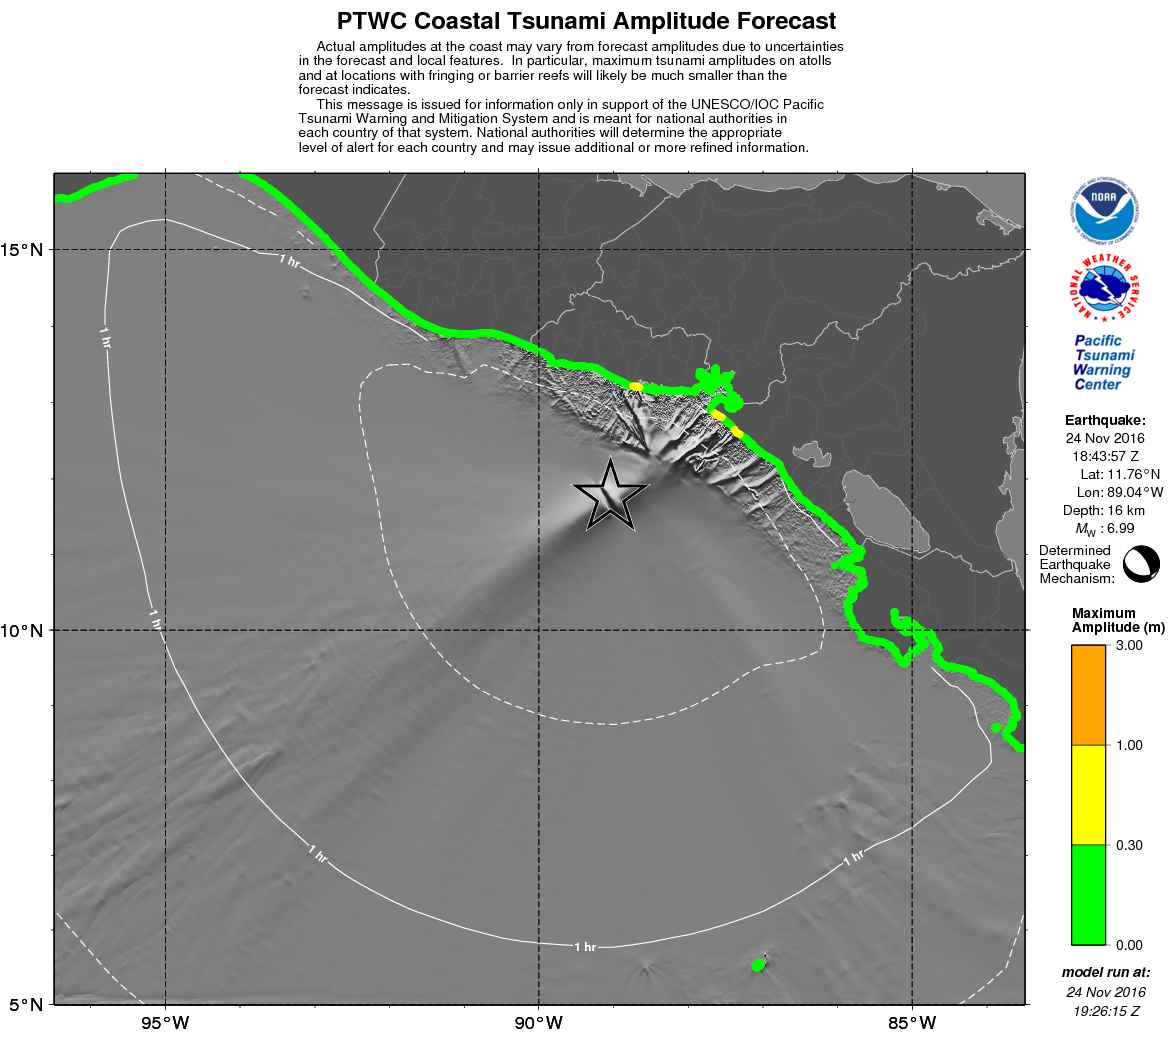
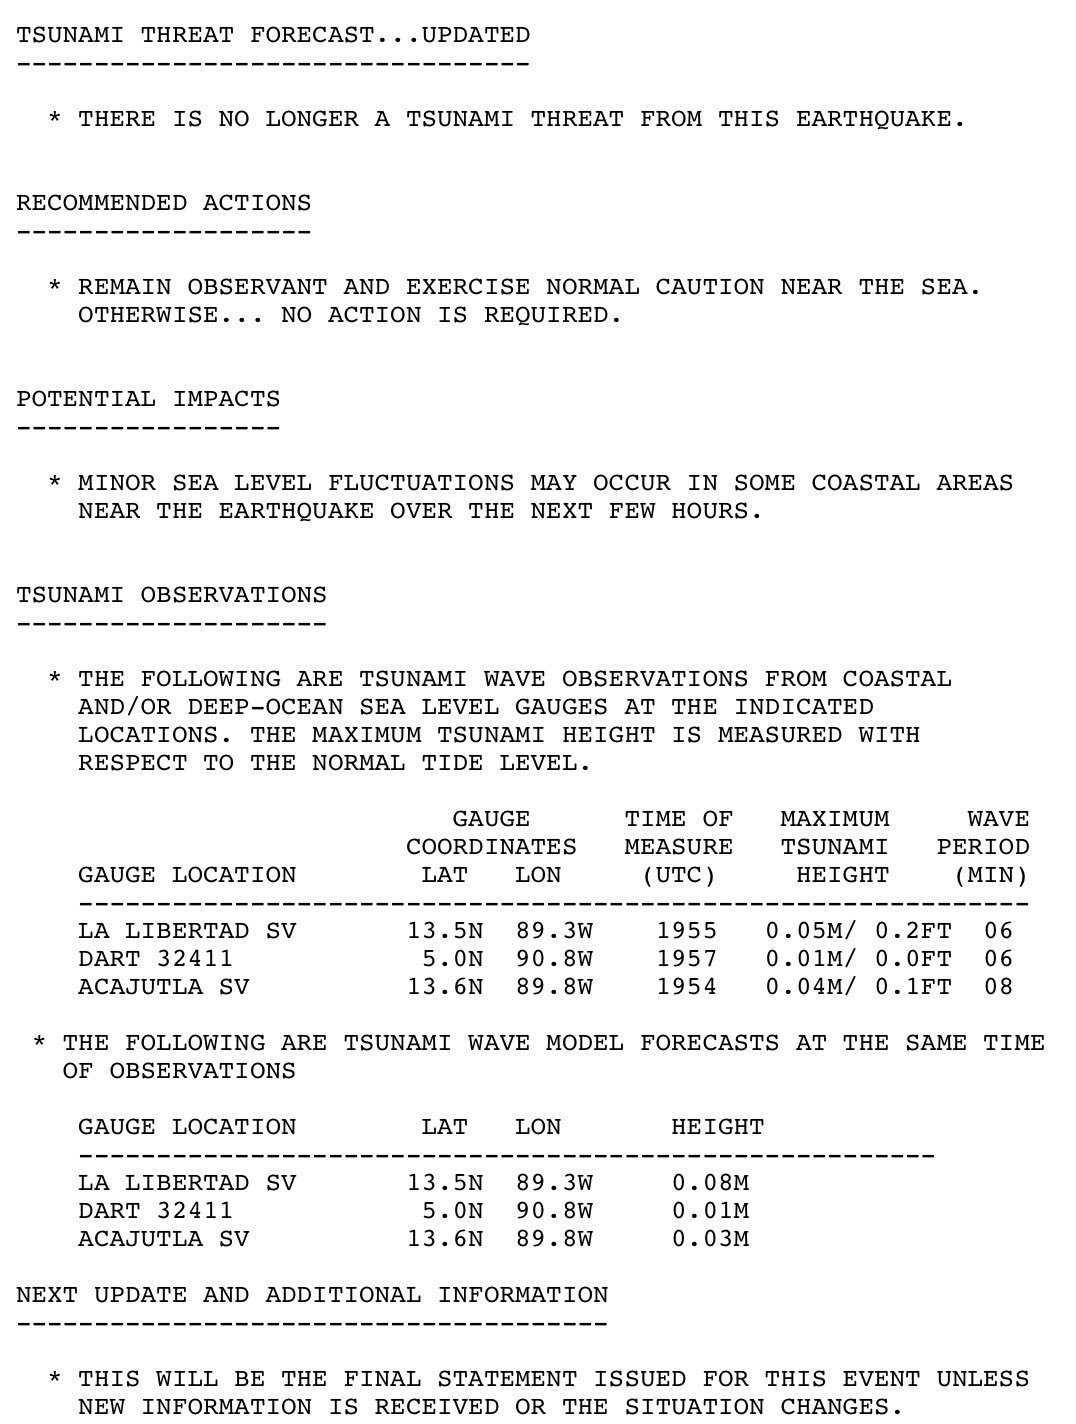
- Here are the tsunami model results from the Pacific Tsunami Warning Center. Note how the observations in the text report below are generally consistent with this forecast.
- Here is the National Tsunami Warning Center (NTWC) tsunami travel-time map.

- Here are the tsunami observations.
-
References:
- Benz, H.M., Tarr, A.C., Hayes, G.P., Villaseñor, Antonio, Furlong, K.P., Dart, R.L., and Rhea, Susan, 2011, Seismicity of the Earth 1900–2010 Caribbean plate and vicinity: U.S. Geological Survey Open-File Report 2010–1083-A, scale 1:8,000,000.
- Funk, J., Mann, P., McIntosh, K., and Stephens, J., 2009. Cenozoic tectonics of the Nicaraguan depression, Nicaragua, and Median Trough, El Salvador, based on seismic-reflection profiling and remote-sensing data in GSA Bulletin, v. 121, no. 11/12, p. 1491-1521.
- Martínez-Díaz, J.A., Álvarez-Gómez, J.A., Benito, B., and Hernández, D., 2004. Triggering of destructive earthquakes in El Salvador in GSA Bulletin, v. 32., no. 1, p. 65-68.
Your efforts are highly appreciated for providing the information about the earthquakes occurred in El Salvador in 2001.