Between my trip to southern Oregon for a talk on Cascadia subduction zone earthquake and tsunami hazards and preparing for a talk on the tectonic contribution to sea-level rise, there were two earthquakes. The first one, which I will write about later, was a M 4.5 in northern California. The second earthquake was a M 7.1 along the Romanche fracture zone (RFZ), a transform plate boundary that offsets the Mid Atlantic Ridge (MAR). Here is the USGS webpage for this M 7.1 earthquake.
-
There have been a number of M 7 earthquakes in this region in the past century and I have reported on some elsewhere along the MAR. Below are some Earthquake Reports for some of these earthquakes.
- 2015.02.13 M 7.1
- 2015.05.24 M 6.3
- 2015.06.17 M 7.0
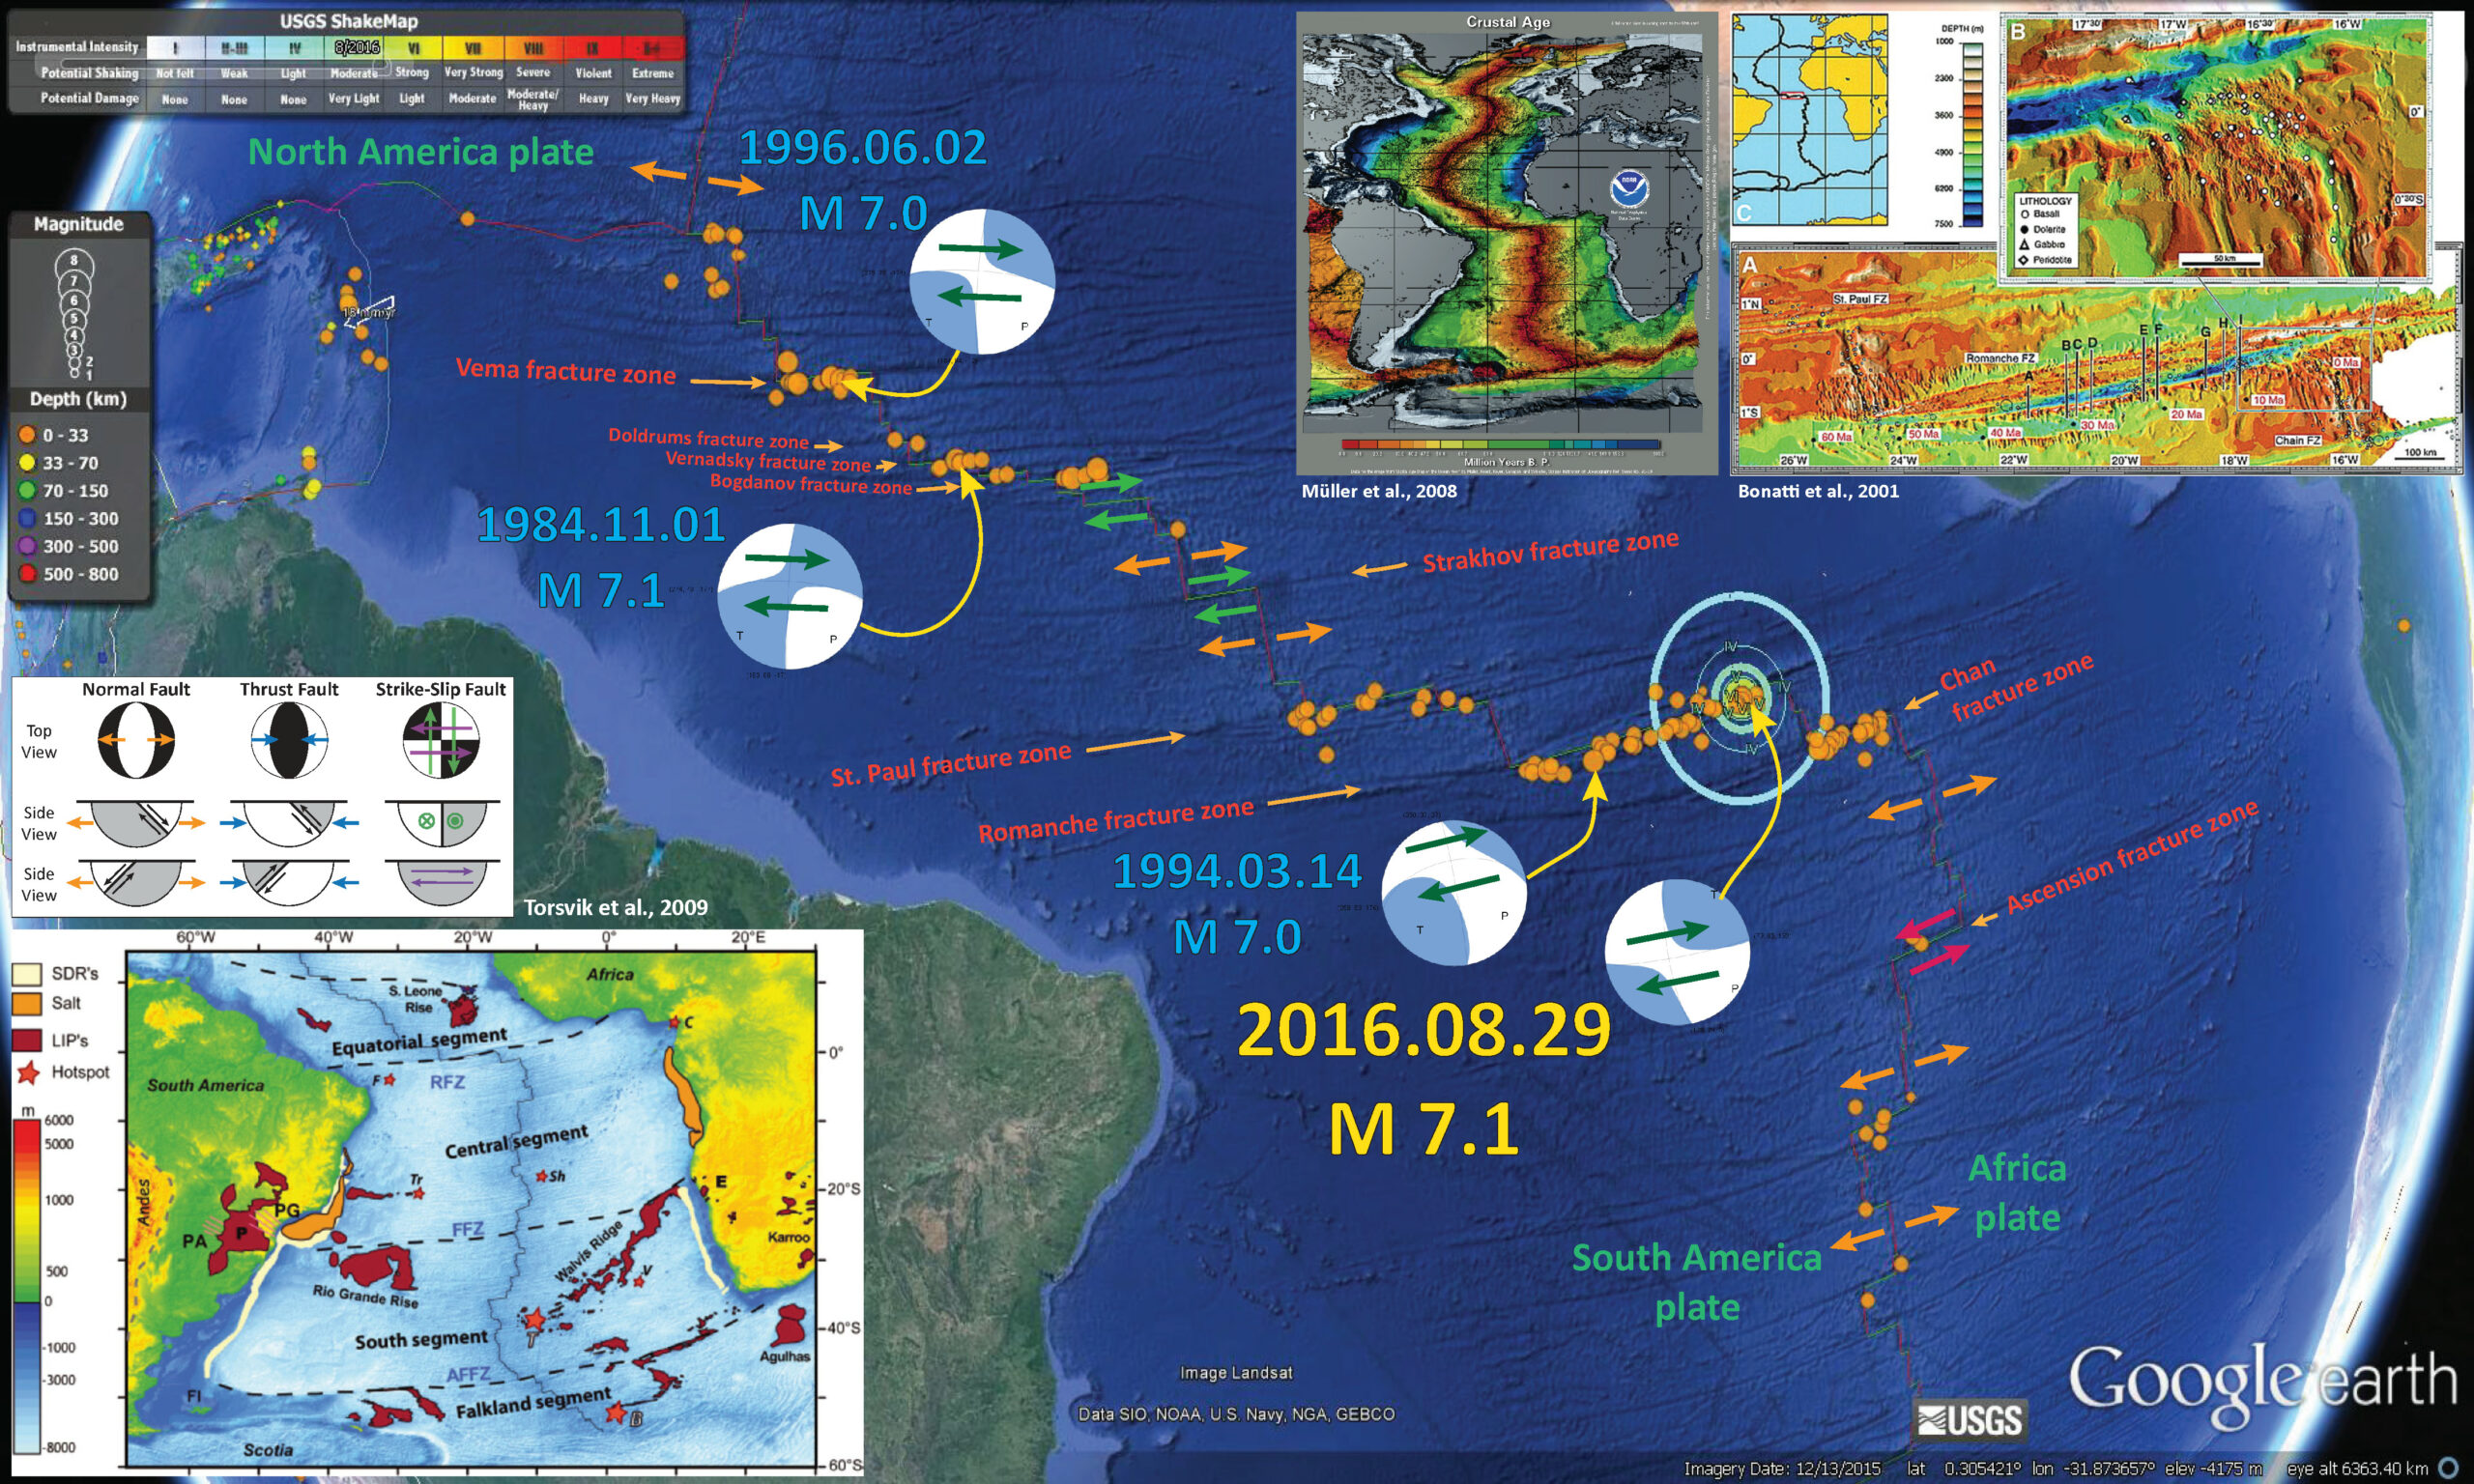
Below is my interpretive poster for this M 7.1 earthquake from yesterday morning (my time).
Below is my interpretive map that shows the epicenter, along with the shaking intensity contours. These contours use the Modified Mercalli Intensity (MMI) scale. The MMI is a qualitative measure of shaking intensity. More on the MMI scale can be found here and here. This is based upon a computer model estimate of ground motions, different from the “Did You Feel It?” estimate of ground motions that is actually based on real observations.
I placed a moment tensor / focal mechanism legend on the poster. There is more material from the USGS web sites about moment tensors and focal mechanisms (the beach ball symbols). Both moment tensors and focal mechanisms are solutions to seismologic data that reveal two possible interpretations for fault orientation and sense of motion. One must use other information, like the regional tectonics, to interpret which of the two possibilities is more likely. Based upon the location of this earthquake along the RFZ, I interpret this to have been a right lateral strike-slip earthquake.
-
I have included some inset figures.
- In the upper right corner, I include a map that shows the detailed bathymetry (the shape of the sea floor) for this region from Bonatti et al. (2001). In the lower panel (A) one may observe how the RFZ offsets the MAR. Ages of the oceanic lithosphere is plotted in red letters with 0 Ma (mega annum) at the MAR on the right and 60 Ma just to the west of the MAR on the left. We can calculate the slip-rate on the RFZ by using these age data and the distance that the MAR has been offset. Note the scale in the lower right corner.
- To the left of the Bonatti et al. (2001) map is a map that shows the age of the oceanic crust in Million Years B.P. (before present). The MAR is highlighted because it is of about zero age, so is shown as red (Müller et al., 2008).
- In the lower left corner is a map that shows a revised interpretation of the timing and orientations of the initial breakup and formation of the MAR and the Atlantic Ocean from Torsvik et al. (2009)

- Here is the Bonatti et al. (2001) figure from the interpretive poster above. I include the figure caption as a blockquote below.
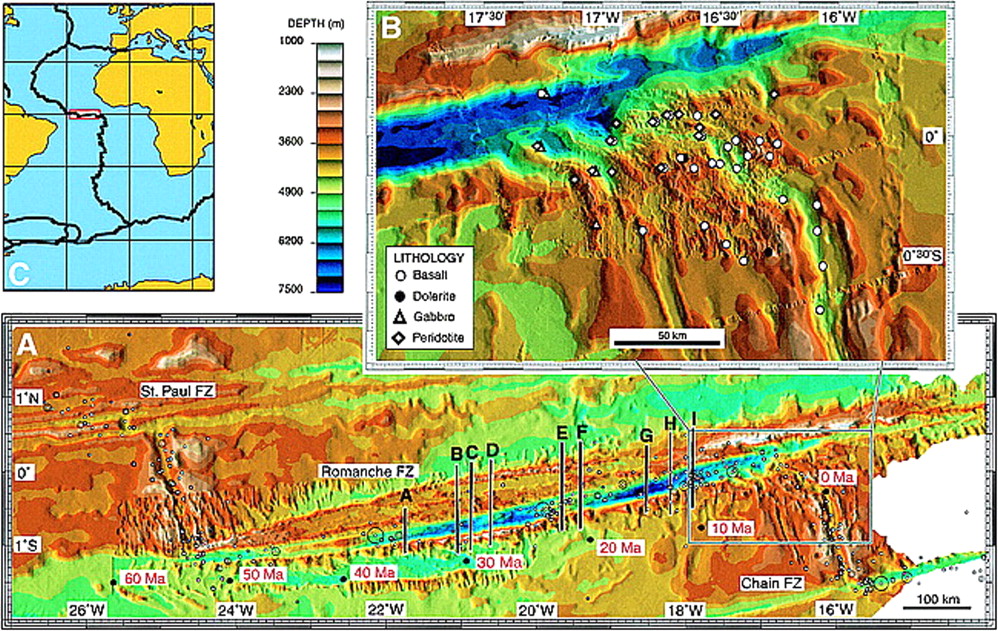
A: Multibeam topography of Romanche region, showing north-south profiles where sampling was carried out. Black dots and red numbers indicate estimated age (in million years) of lithosphere south of Romanche Transform, assuming spreading half-rate of 17 mm/yr within present-day ridge and transform geometry. White dots indicate epicenters of teleseismically recorded 1970–1995 events (magnitude . 4). FZ is fracture zone. B: Topography and petrology at eastern intersection of Romanche Fracture Zone with Mid-Atlantic Ridge. Data were obtained during expeditions S-16, S-19, and G-96 (Bonatti et al., 1994, 1996). C: Location of A along Mid-Atlantic Ridge.
- Here is the Müller et al. (2008) figure from the interpretive poster above.

- Here is the Torsvik et al. (2009) figure from the interpretive poster above. I include the figure caption as a blockquote below.
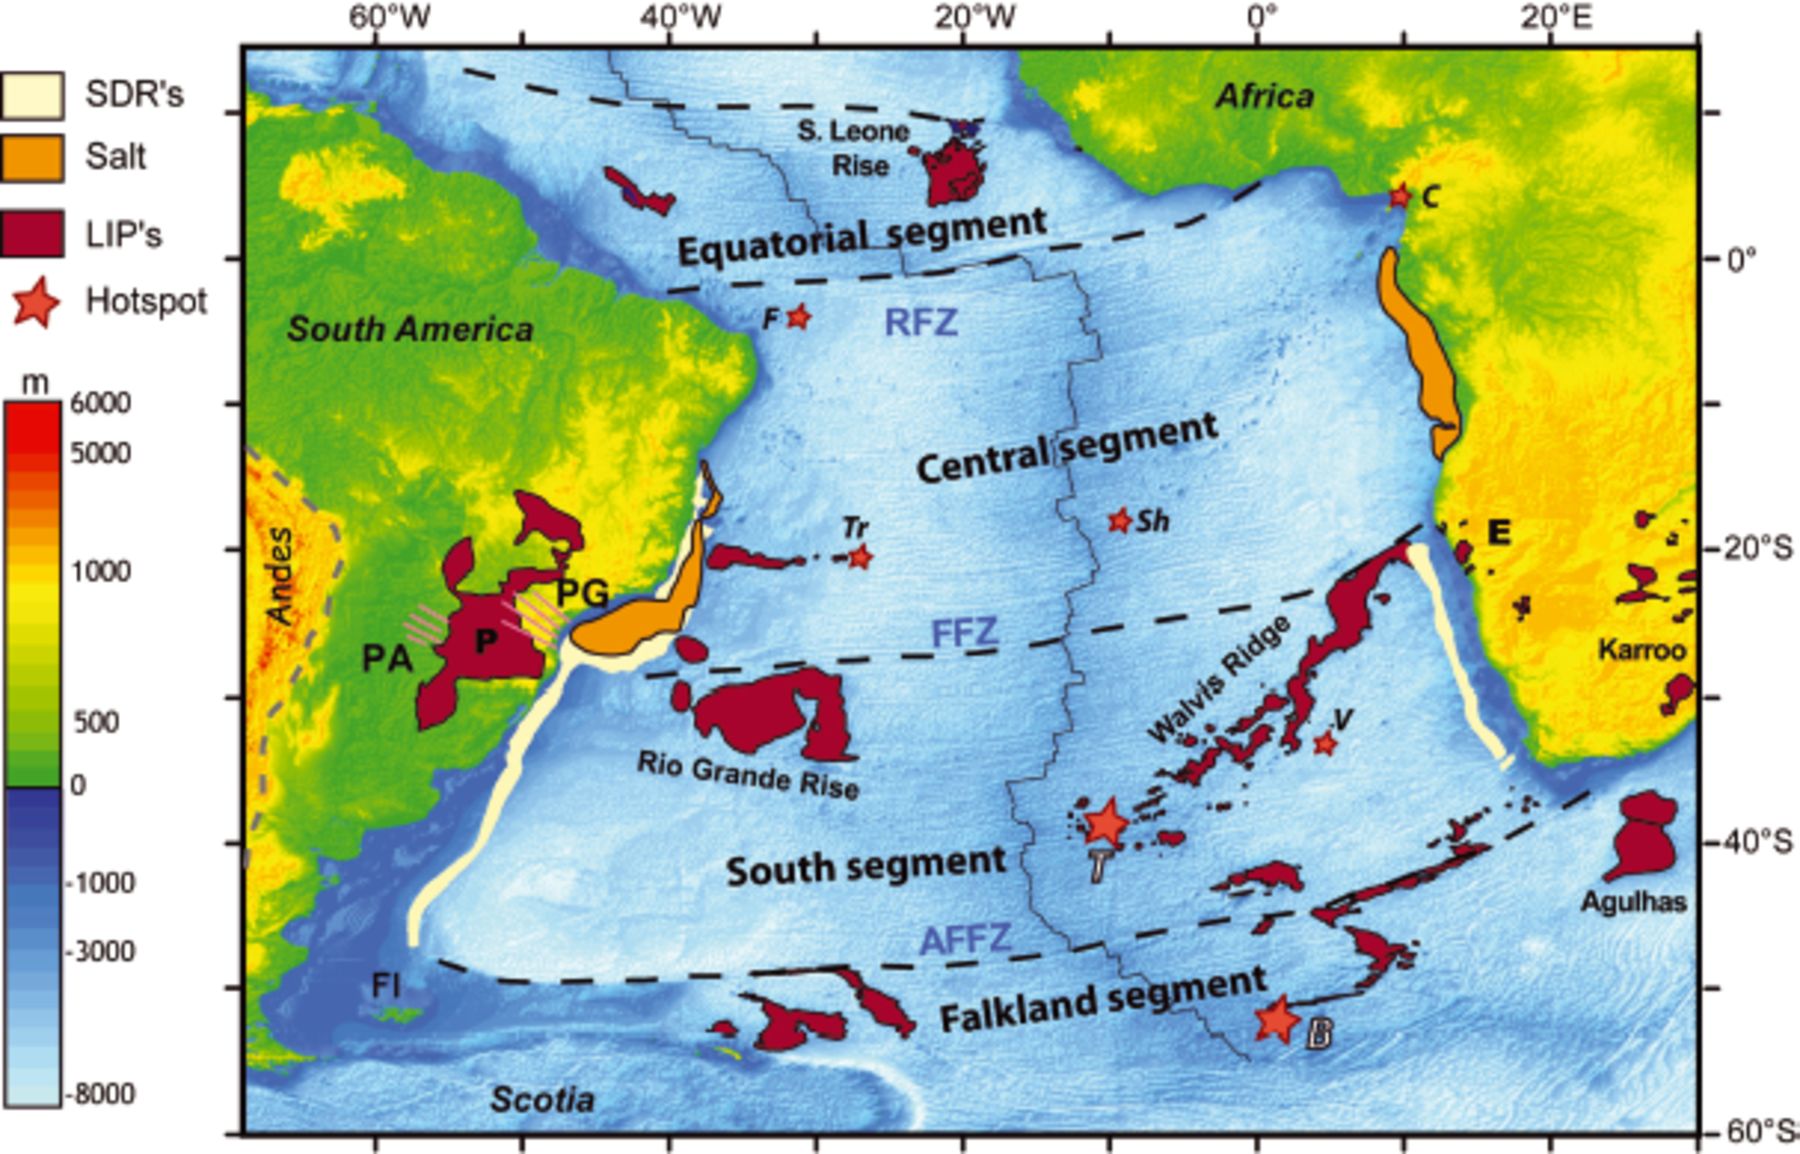
General structural map of the South Atlantic Ocean draped on topographic/bathymetric map from GTOPO 30. Boundaries between the four segments (Equatorial, Central, South and Falkland) are shown by dotted lines (RFZ, Romanche Fracture Zone; FFZ, Florianopolis Fracture Zone; AFFZ, Agulhas– Falkland Fracture Zone). Aptian salt basins (orange), LIPs (P, Parana; E, Etendeka; Karroo, Sierra Leone Rise and Agulhas), Seaward Dipping Reflectors (SDRs, white) and active hotspots (F, Fernando; C, Cameroon; Tr, Trinidade; Sh, St Helena; T, Tristan; V, Vema; B, Bouvet (Meteor) are also shown. Of these hotspots, only Tristan (responsible for the Parana-Etendeka LIP and Rio Grande Rise–Walvis Ridge) is classically considered as a deep plume in the literature (see Torsvik et al. 2006). However, Bouvet (Meteor) possibly responsible for Agulhas, and Maud Rise (East Antarctica) and Madagascar Ridge volcanism could possibly also have a deep plume origin (Section 6). PG, Ponta Grossa Dyke System; PA, Paraguay Dyke system; FI, Falkland Islands.
- I created an animation that shows the seismicity for this region of the MAR from 1900-2016.08.29. The animation includes earthquakes of magnitudes M ≥ 6.0. Here is the kml that I created from the USGS website. Below is a map of all the earthquakes plotted, with the animation below.
- Here is a link to the video embedded below (4 MB mp4)

Here are a couple Earthquake Report interpretive posters for earthquakes from the past couple of years.
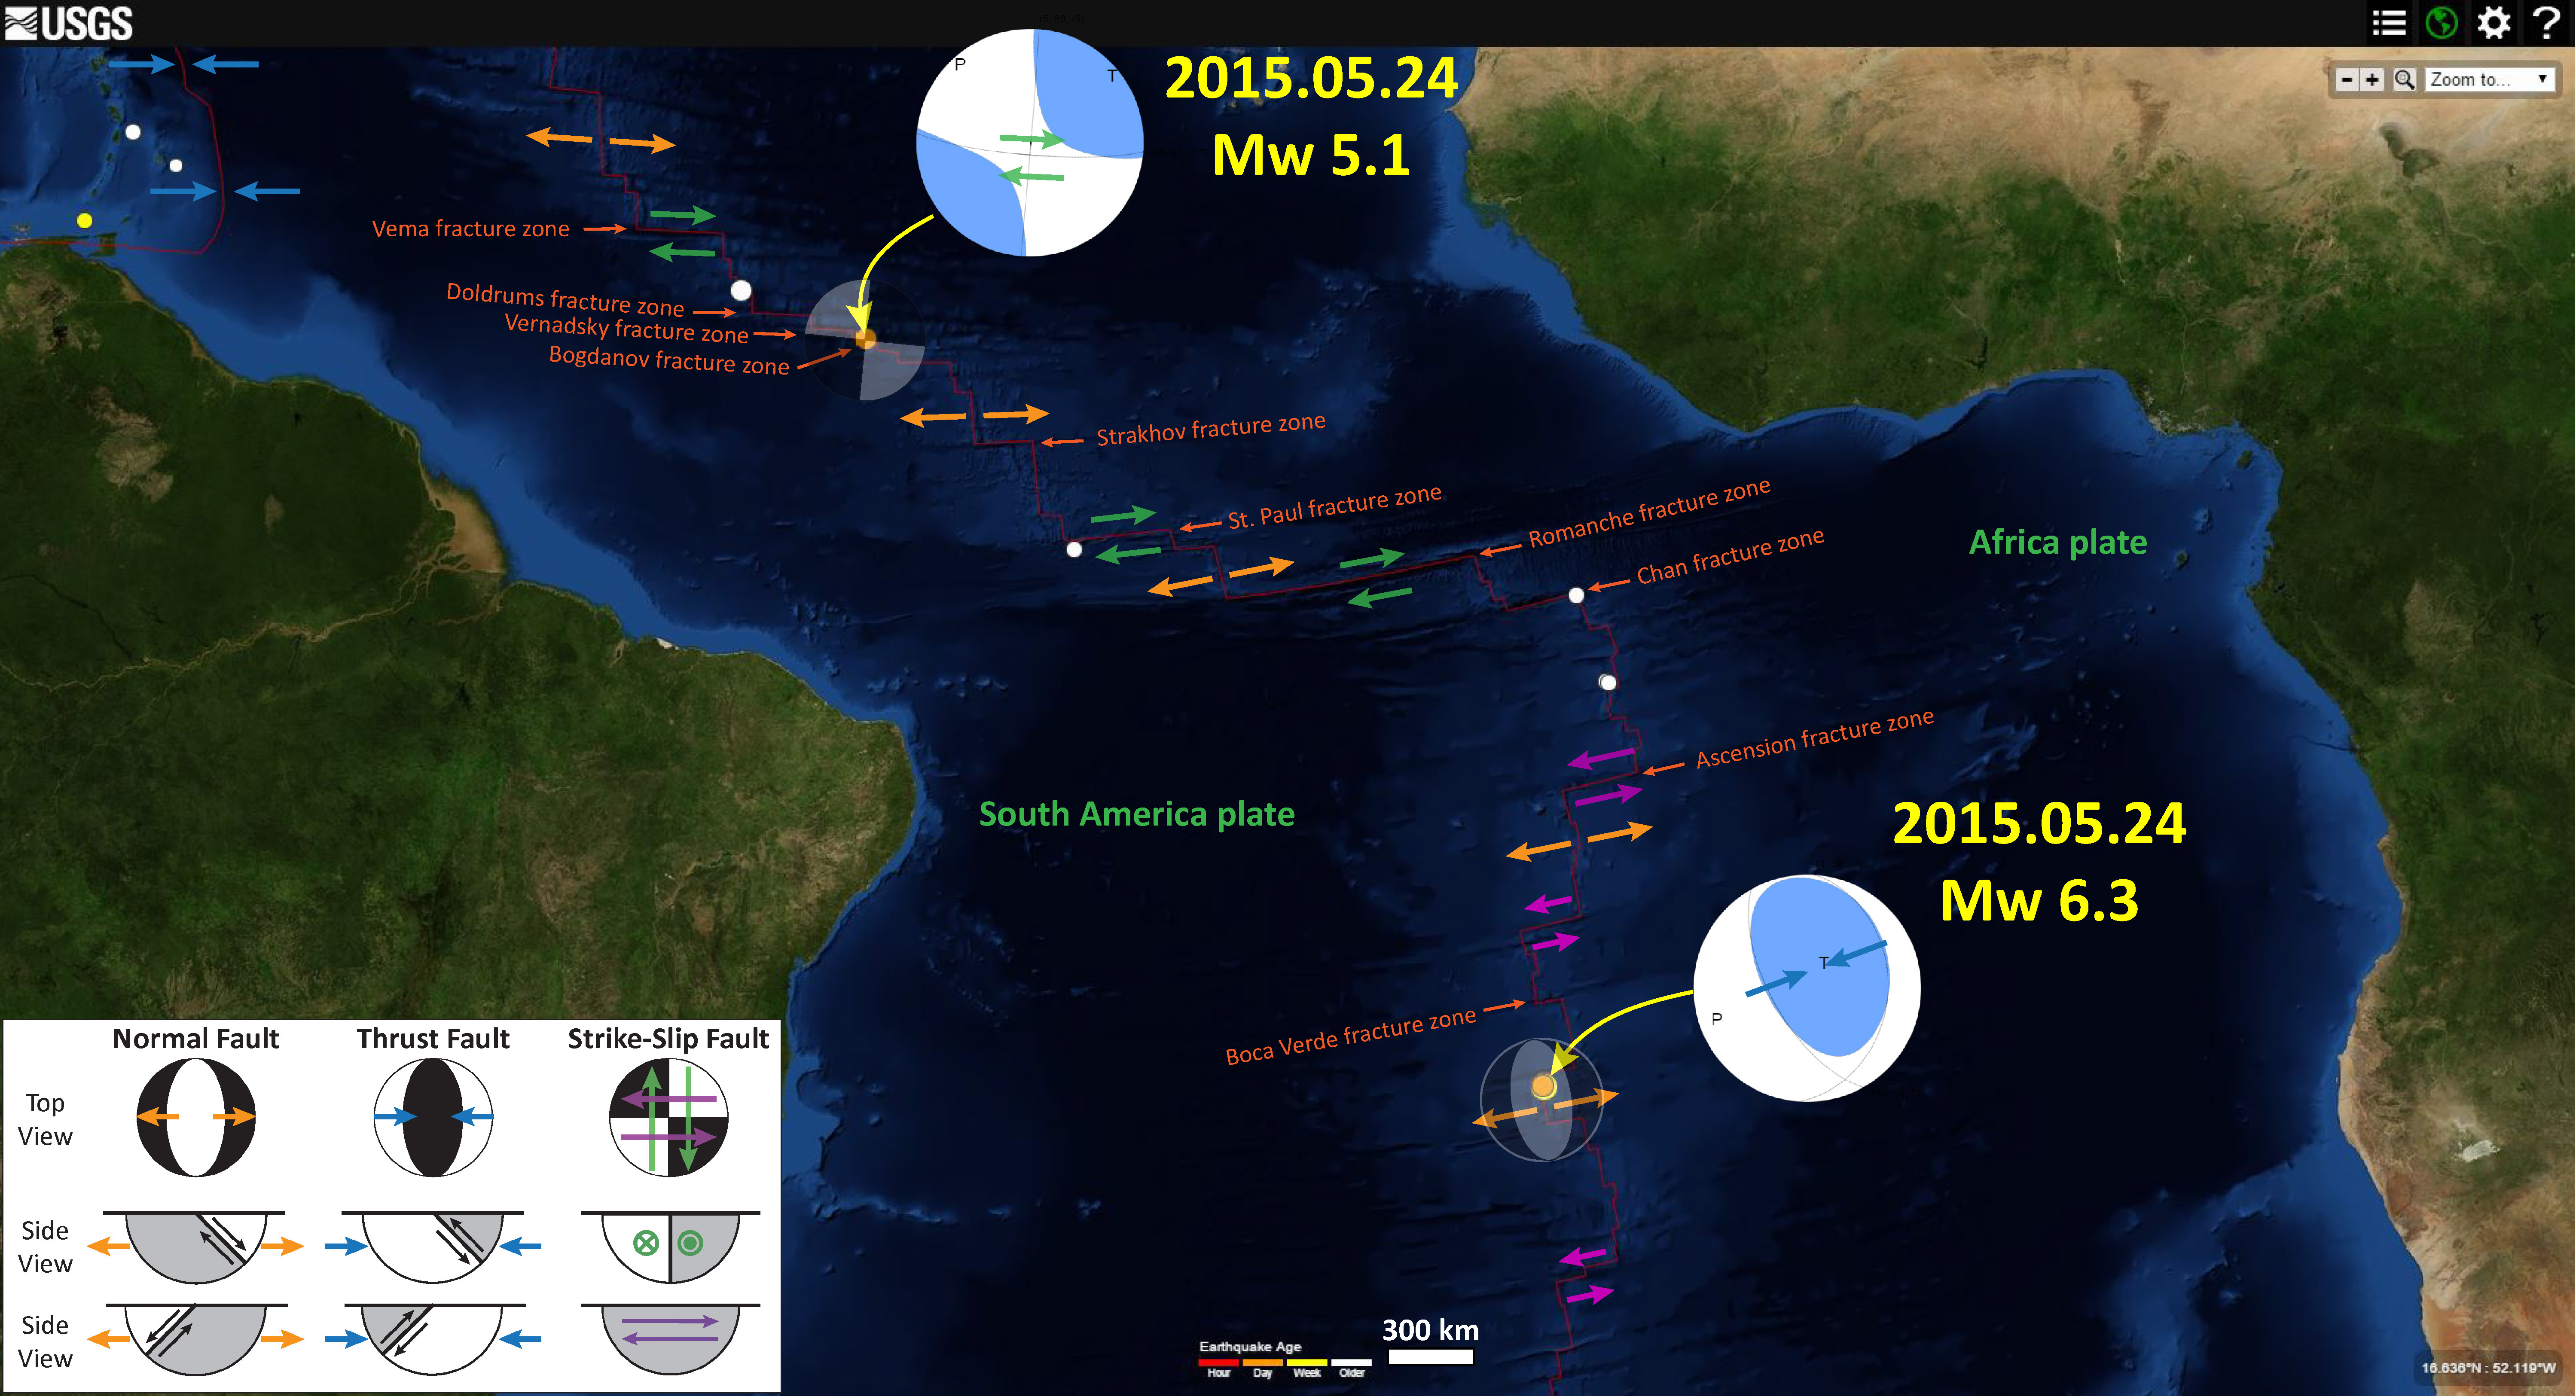
Here is a map that shows the 2015.06.17 Mw 7.0 earthquake, as well as the 2015.05.24 M = 6.3 earthquake (which has a compressional moment tensor). This occurred along an unnamed fracture zone.
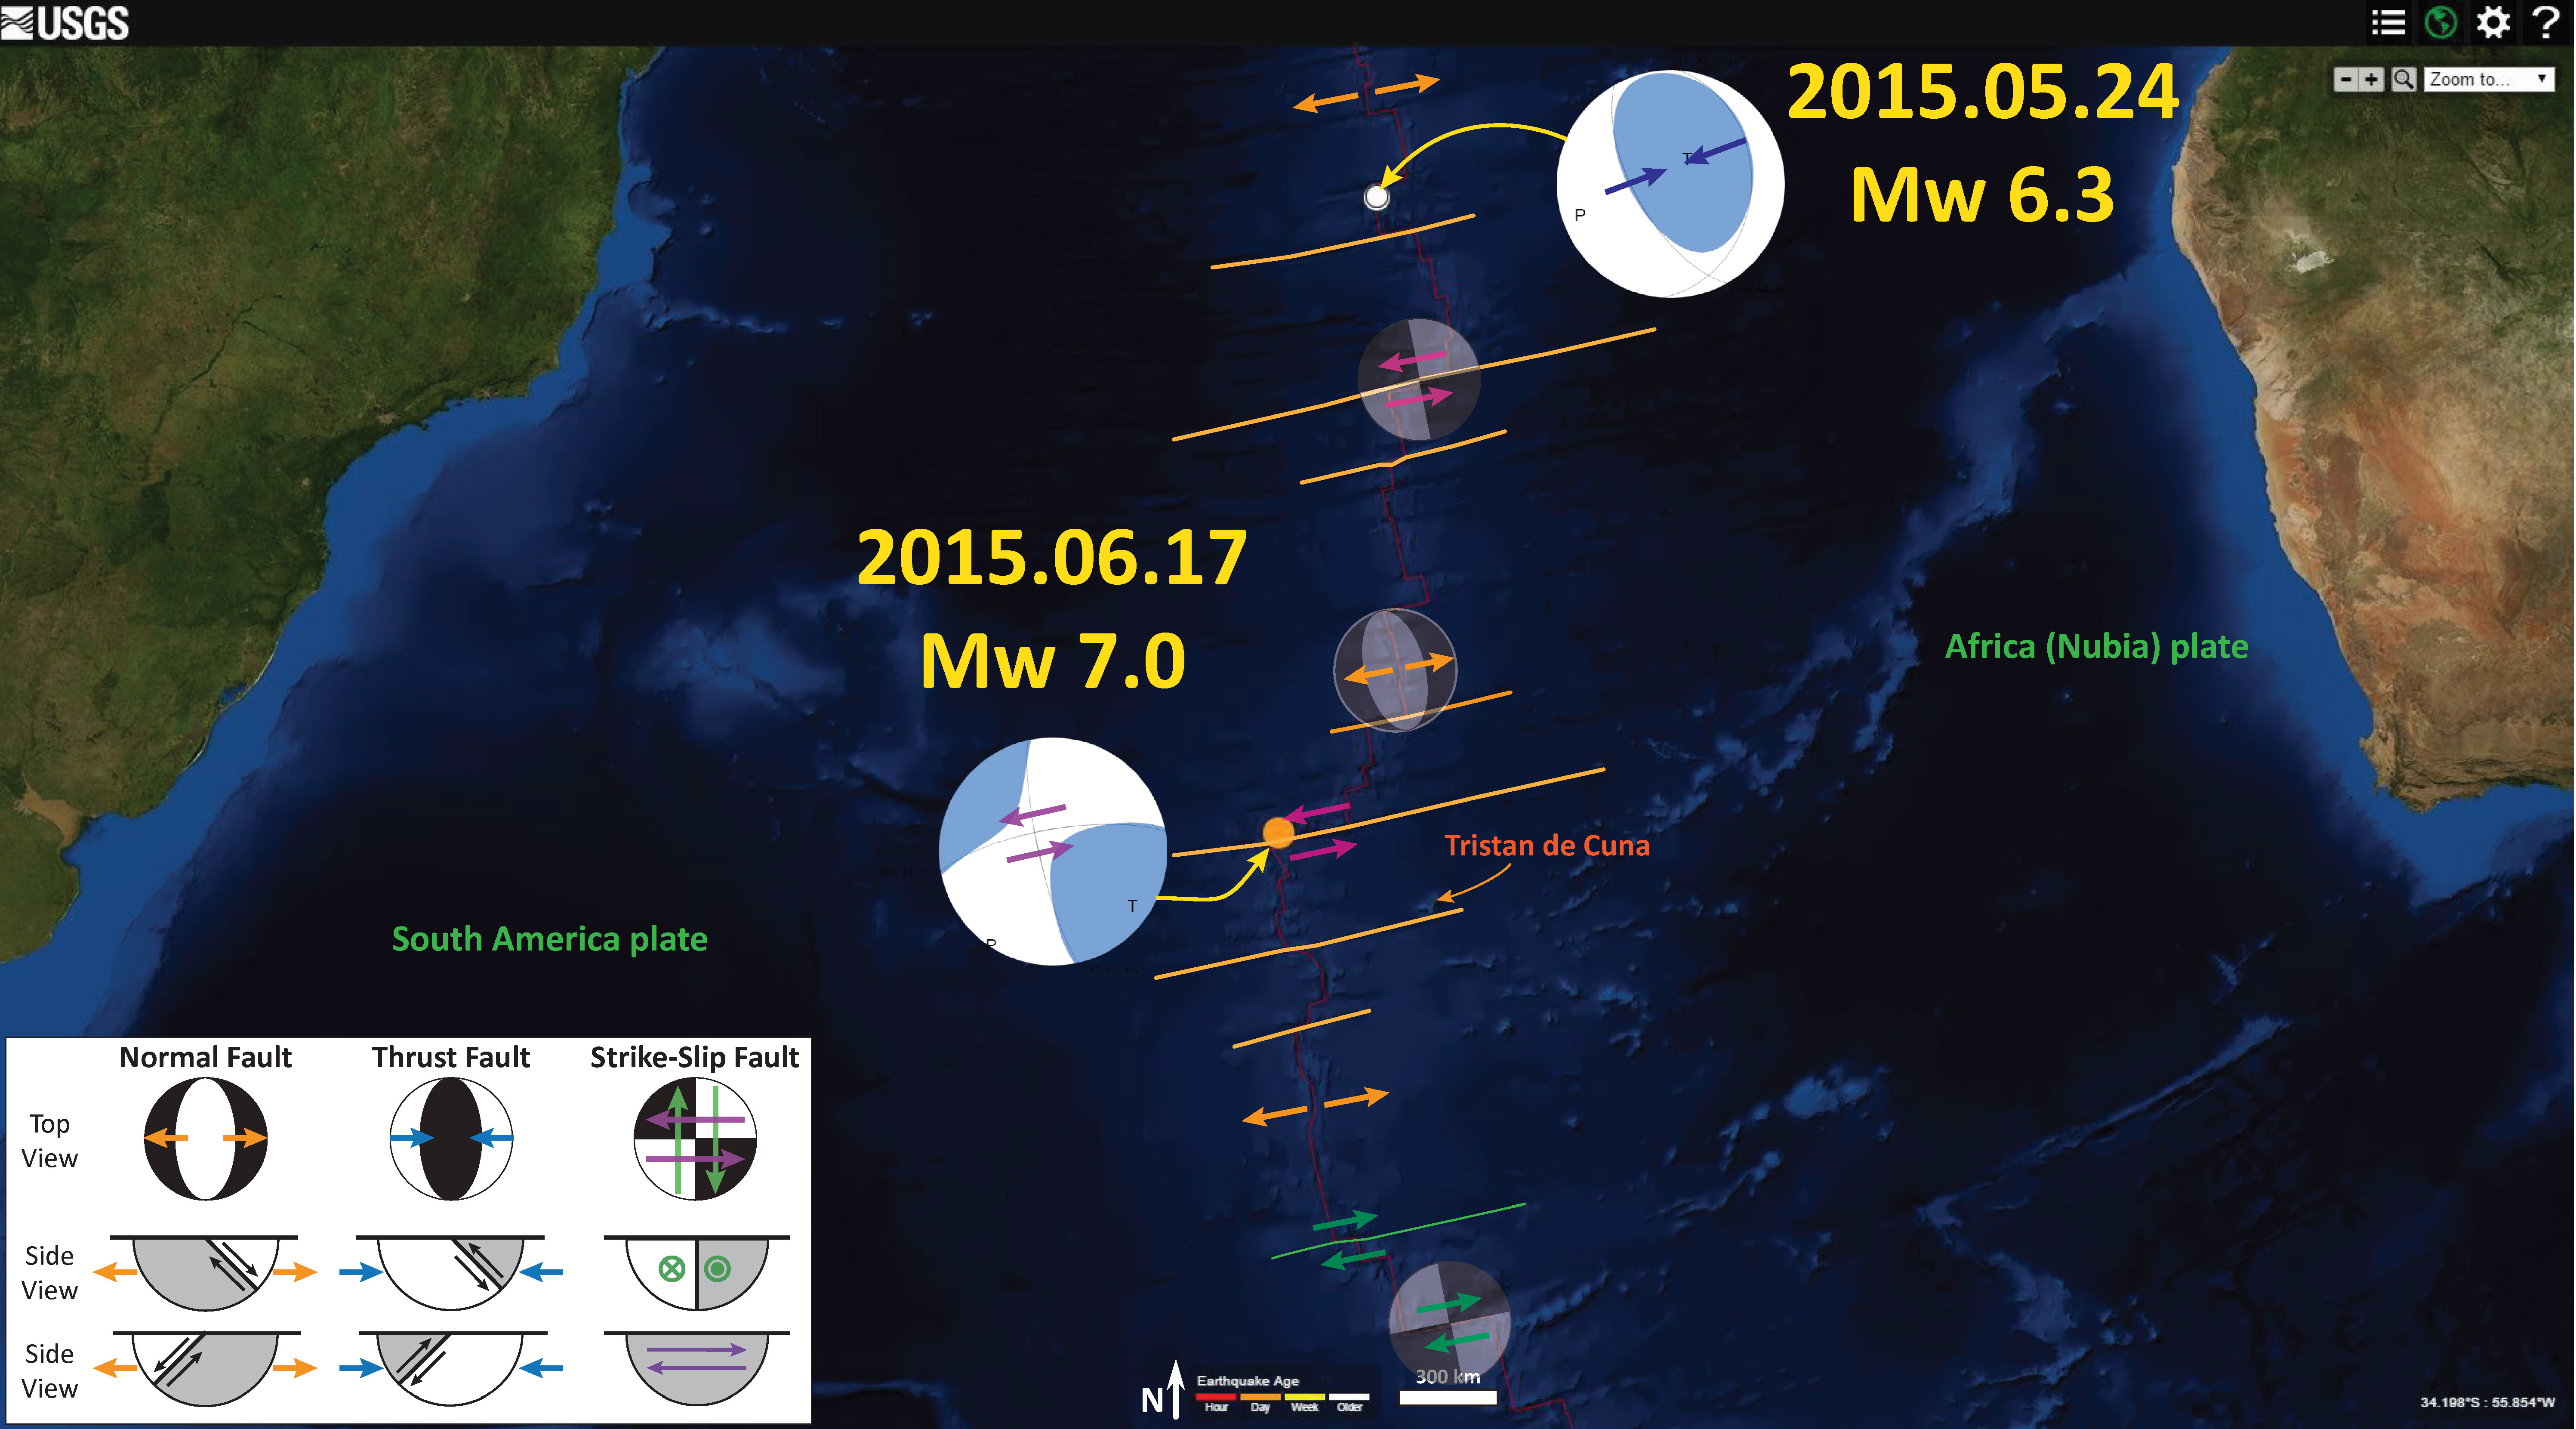
Here is a map that shows the fracture zones and recent (2015) seismicity to the north of the M 6.3 earthquake.
-
References:
- Bonatti, E., Brunelli, D., Fabretti, P., Ligi, M., Portaro, R.A., and Seyler, M., 2001. Steady-state creation of crust-free lithosphere at cold spots in mid-ocean ridges in Geology, v. 29, no. 11, p. 979-982.
- Müller, R.D., Sdrolias, M., Gaina, C., and Roest, W.R., 2008. Age, spreading rates and spreading symmetry of the world’s ocean crust in Geochem. Geophys. Geosyst., 9, Q04006, doi:10.1029/2007GC001743
- Torsvik, T.H., Tousse, S., Labaila, C., and Smethurst, M.A., 2009. A new scheme for the opening of the South Atlantic Ocean and the dissection of an Aptian salt basin in Geophysical Journal INternational, v. 177, p. 1315-1333.