Pavlof Volcano (PV) is erupting. PV is located near Sand Point Alaska, along the eastern Aleutian Magmatic Arc. The Alaska Volcano Observatory placed the PV into alert level “warning” and aviation color code red. Below is the description of the current conditions in blockquote:
Pavlof Volcano began erupting abruptly this afternoon, sending an ash cloud to 20,000 ft ASL as reported by a pilot. As of 4:18 pm AKDT (00:18 UTC), ash was reportedly moving northward from the volcano. Seismicity began to increase from background levels at about 3:53 pm (23:53 UTC) with quick onset of continuous tremor, which remains at high levels. AVO is raising the Aviation Color Code to RED and the Volcano Alert Level to WARNING.
Here is the AVO page for Pavlof.
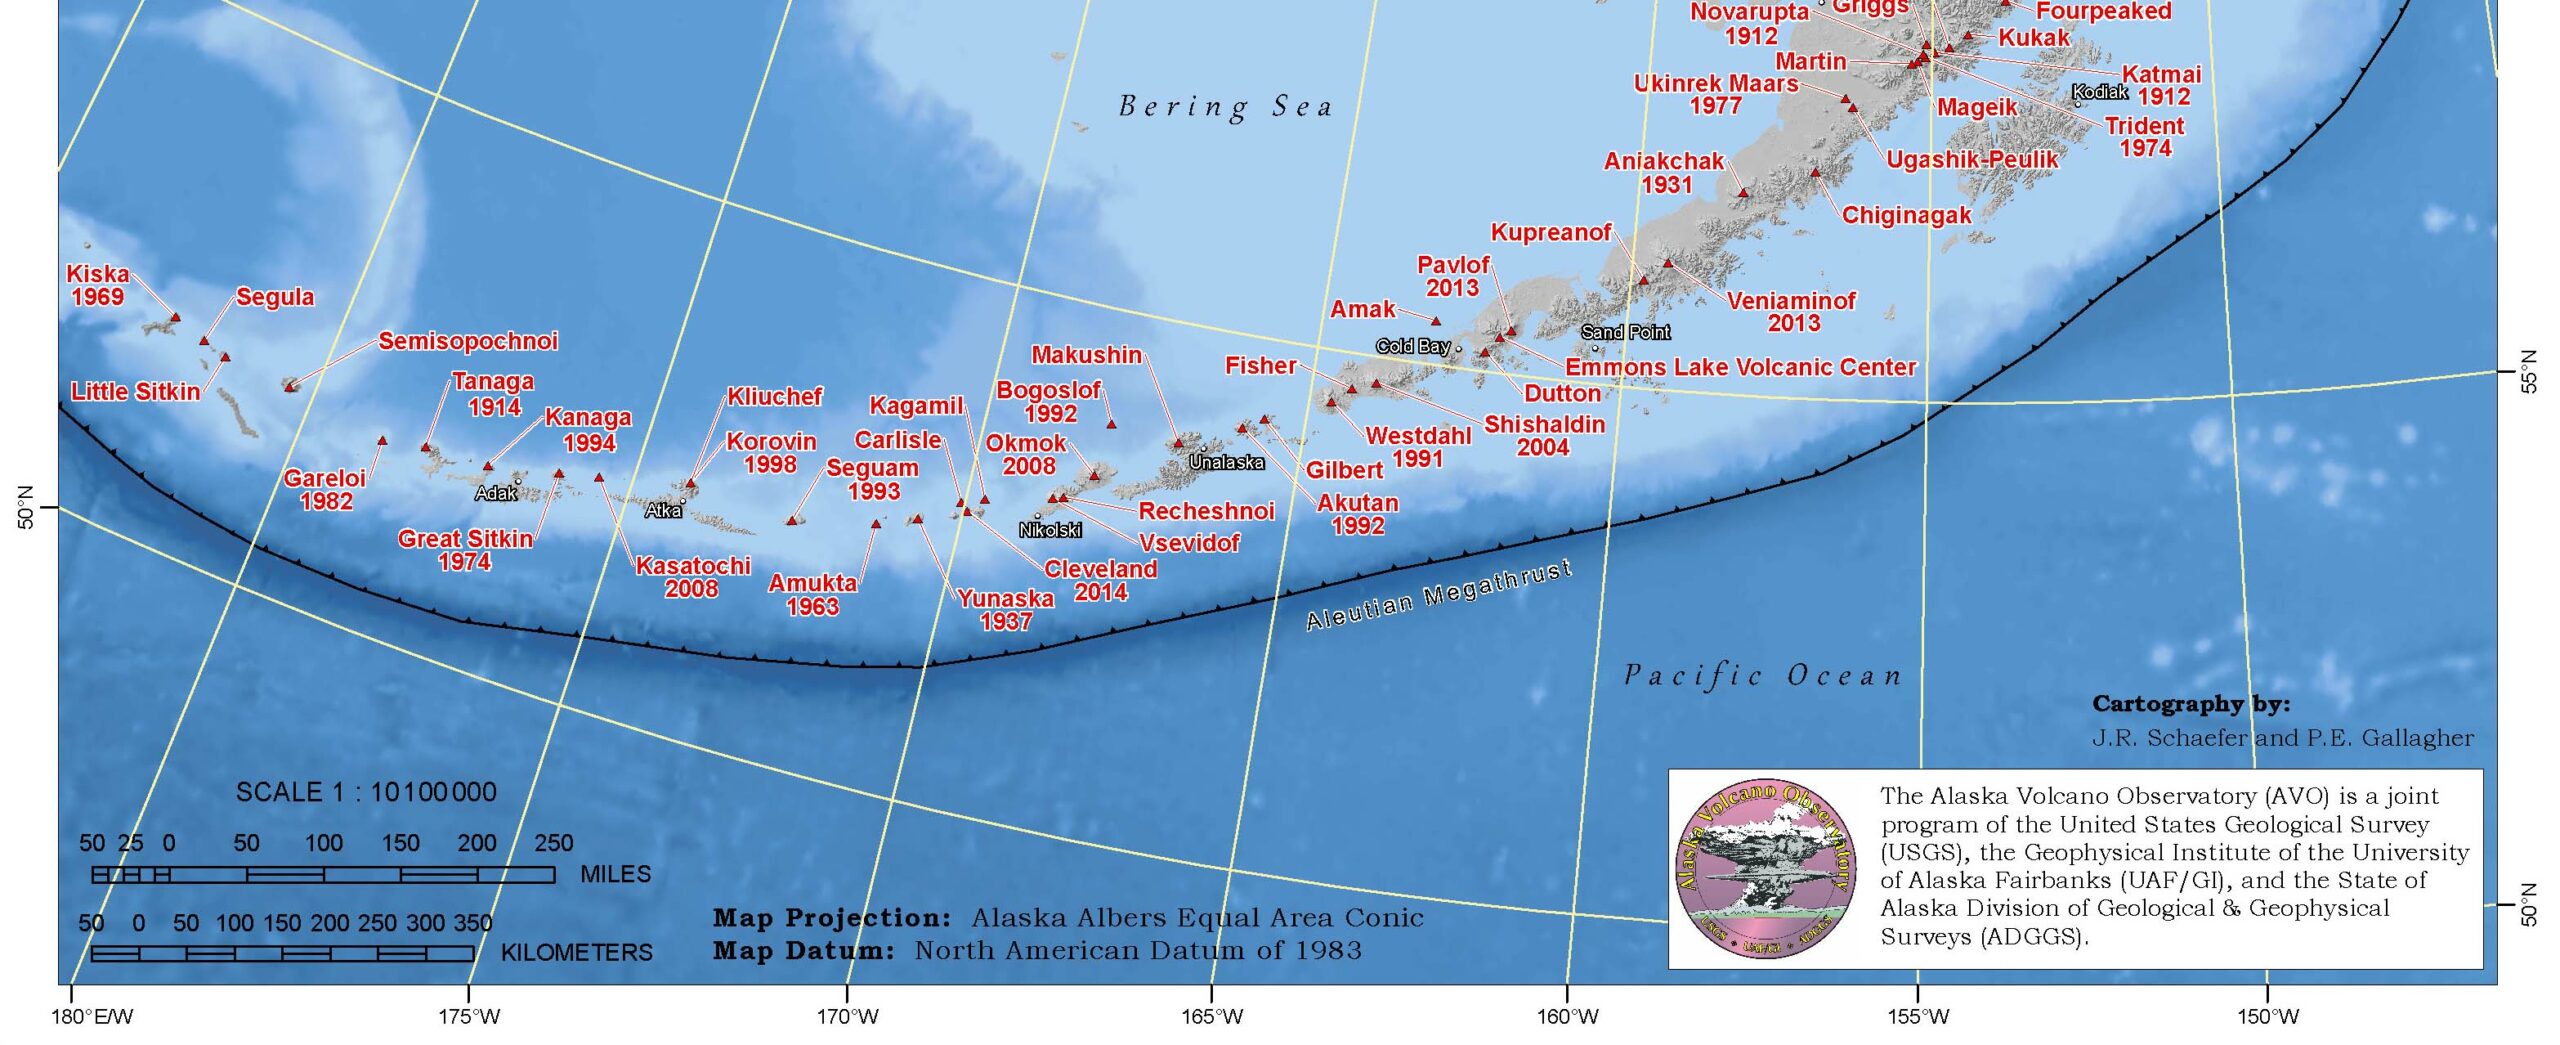
This is a map that shows the Volcanoes in this region (Schaefer et al., 2014). Here is a link to a larger sized, higher resolution version of the map (34 MB pdf).

This is a screen shot showing the alert status and the definition of “red.” This page is dynamic, so if you click on the above link to the AVO page, it will have different content. I include images from the Forecast parts of the page below.

Pavlof Volcano Description
From the AVO:
Pavlof Volcano is a snow- and ice-covered stratovolcano located on the southwestern end of the Alaska Peninsula about 953 km (592 mi) southwest of Anchorage. The volcano is about 7 km (4.4 mi) in diameter and has active vents on the north and east sides close to the summit. With over 40 historic eruptions, it is one of the most consistently active volcanoes in the Aleutian arc. Eruptive activity is generally characterized by sporadic Strombolian lava fountaining continuing for a several-month period. Ash plumes as high as 49,000 ft ASL have been generated by past eruptions of Pavlof, and during the 2013 eruption, ash plumes as high as 27,000 feet above sea level extending as much as 500 km (310 mi) beyond the volcano were generated. The nearest community, Cold Bay, is located 60 km (37 miles) to the southwest of Pavlof.
- Ashfall Forecast
- This and all following ashfall graphics is the output of a mathematical model of volcanic ash transport and deposition on the ground (Ash3D, USGS).
- This model shows expected ashfall accumulation (deposit thickness) for actual or hypothetical eruptions.
- AVO produces this graphic when a volcano is restless by assuming a reasonable hypothetical eruption, in order to provide a pre-eruptive forecast of areas likely to be affected. During an eruption, AVO updates the forecast with actual observations (eruption start time and duration, plume height) as they become available.
- Colored contour lines represent points of equal ash thickness on the ground. Small accumulations of ash may occur beyond the “Trace” contour. Actual deposit thickness may vary from the forecast as the modelled points are based on our best estimates. Thickness terms are explained here.
- This graphic does not show ash cloud movement in the atmosphere; please refer to the other graphics for ash cloud forecasts. Click here to return to other models output.
- Ash Cloud Height Forecast
- This model shows expected movement of an ash cloud in the atmosphere for actual or hypothetical eruptions.
- AVO produces this graphic when a volcano is restless by assuming a reasonable hypothetical eruption, in order to provide a pre-eruptive forecast of airspace likely to be affected. During an eruption, AVO updates the forecast with actual observations (eruption start time and duration, plume height) as they become available.
- Colors represent the height of the top of the ash cloud, in feet above sea level, as it drifts downwind.
- This graphic does not show ashfall deposition on the ground; go here for ashfall graphic. Note that it is possible for ash clouds to move overhead with little or no fallout on the ground.
- For more information about ASH3D, see USGS Open-File Report 2013-1122.
- Ash Cloud Load Forecast
- This model shows expected load (amount) of ash in the atmosphere for actual or hypothetical eruptions.
- AVO produces this graphic when a volcano is restless by assuming a reasonable hypothetical eruption, in order to provide a pre-eruptive forecast of airspace likely to be affected. During an eruption, AVO updates the forecast with actual observations (eruption start time and duration, plume height) as they become available.
- Colors represent amounts of ash in the atmosphere, summed from the bottom to the top of the cloud. Warmer colors represent areas of greater ash; colder colors mean less ash.
This graphic does not show ashfall deposition on the ground; go here for ashfall graphic. Note that it is possible for ash clouds to move overhead with little or no fallout on the ground. - Puff Cloud Height Forecast
- This model shows expected movement of an ash cloud in the atmosphere for actual or hypothetical eruptions.
- AVO produces this graphic when a volcano is restless by assuming a reasonable hypothetical eruption, in order to provide a pre-eruptive forecast of airspace likely to be affected. During an eruption, AVO will update the forecast with actual observations (eruption start time and duration, plume height) as they become available.
- Colored dots represent the estimated height of the top of the ash cloud, in feet above sea level, as it drifts downwind. [Change the color bar legend to “Height of top of ash cloud”]
- This graphic does not show ashfall deposition on the ground; go here for ashfall graphic. Note that it is possible for ash clouds to move overhead with little or no fallout on the ground.
- For more information about Puff, see http://pafc.arh.noaa.gov/puff/index.html.
- Trajectory Forecast
- This trajectory graphic is the output of a mathematical model showing wind direction and speed at different altitudes above sea level (HYSPLIT, NOAA). It does not contain information about ash emissions from the volcano.
- Colored lines show the direction an ash cloud emanating from a point source (the volcano) would travel at different altitudes in feet above ground level. A given eruption cloud may not reach all altitudes shown.
- Symbols are spaced one hour apart and reflect the forecast speed of the ash cloud.
- This model is updated every 6 hours.
- 0000 UTC = 4:00 PM AKDT on the previous day as UTC
- 0600 UTC = 10:00 PM AKDT on the previous day as UTC
- 1200 UTC = 4:00 AM AKDT on the same day as UTC
- 1800 UTC= 10:00 AM AKDT on the same day as UTC
- For more information about HYSPLIT see: http://www.arl.noaa.gov/ready/traj_alaska.html.
Forecasts


-
UTC to AKDT conversion (Alaska Daylight Time):

- Interesting that to the west there have been a few earthquakes recently. Here is a map that shows those regions, along with the volcano locations. Note Pavlof is along the eastern part of this map, approximately 900 km east of the Amlia fracture zone (which is just east of the largest cluster of earthquakes.
- 2016.03.12 M 6.3 Aleutians
- 2016.03.27 M 5.7 Aleutians
Earthquakes Also
Here are my earthquake reports for these earthquakes:

- In 2014/11/12 Pavlof Volcano began erupting. The report from the Global Volcanism Project for that eruption is here.
- 2014/11/16 07:02 AM UTC – NASA EO-1 Advanced Land Imager image high temperature flowage deposit on the northwest flank of Pavlof Volcano. This shortwave infrared image is sensitive to very high temperatures. This flowage deposit likely contains both new lava and hot rock debris, but the distribution has not yet been determined. The deposit extends for about 3.3 miles (5.4 km) from the vent.
- 2016/11/15 21:46 PM UTC – Satellite image from the USGS/NASA Landsat-8 satellite showing the eruption cloud at Pavlof Volcano on November 15 at 12:46 pm AKST (21:46 UTC). This is just a portion of the eruption cloud, which extended for more than 250 miles to the northwest at the time this image was collected. In this image, the distance from the erupting vent to the upper left corner of the image is 45 miles (70 km). The shadow of the eruption cloud on the underlying meteorological clouds can be seen in this image. Pilots reported the height of the cloud at 35,000 ft (10.7 km) above sea level.
Images from the 2014/11/12-16 eruption


-
References:
- Global Volcanism Program, 2015. Report on Pavlof (United States). In: wunderman, R (ed.), Bulletin of the Global Volcanism Network, 40:4. Smithsonian Institution. http://dx.doi.org/10.5479/si.GVP.BGVN201504-312030.
- Schaefer, J.R., Cameron, C.E., and Nye, C.J., 2014, Historically active volcanoes of Alaska, in Schaefer, J.R., Cameron, C.E., and Nye, C.J., Historically active volcanoes of Alaska: Alaska Division of Geological & Geophysical Surveys Miscellaneous Publication 133 v. 1.2, 1 sheet, scale 1:3,000,000. doi:10.14509/20181