This morning we had a series of earthquakes along the Aleutian trench near Atka and the Amlia fracture zone. This is a very active part of this plate boundary and I summarize some of this below. The USGS has a great review of the tectonics of the Aluetian Arc in an Open File report here.
-
Here are the USGS web pages for the larger earthquakes in this region today, in order of occurrence:
- 2016.03.12 11:55 M 4.6
- 2016.03.12 13:23 M 5.4
- 2016.03.12 14:15 M 4.0 (out board of trench)
- 2016.03.12 18:01 M 4.6
- 2016.03.12 18:06 M 6.3
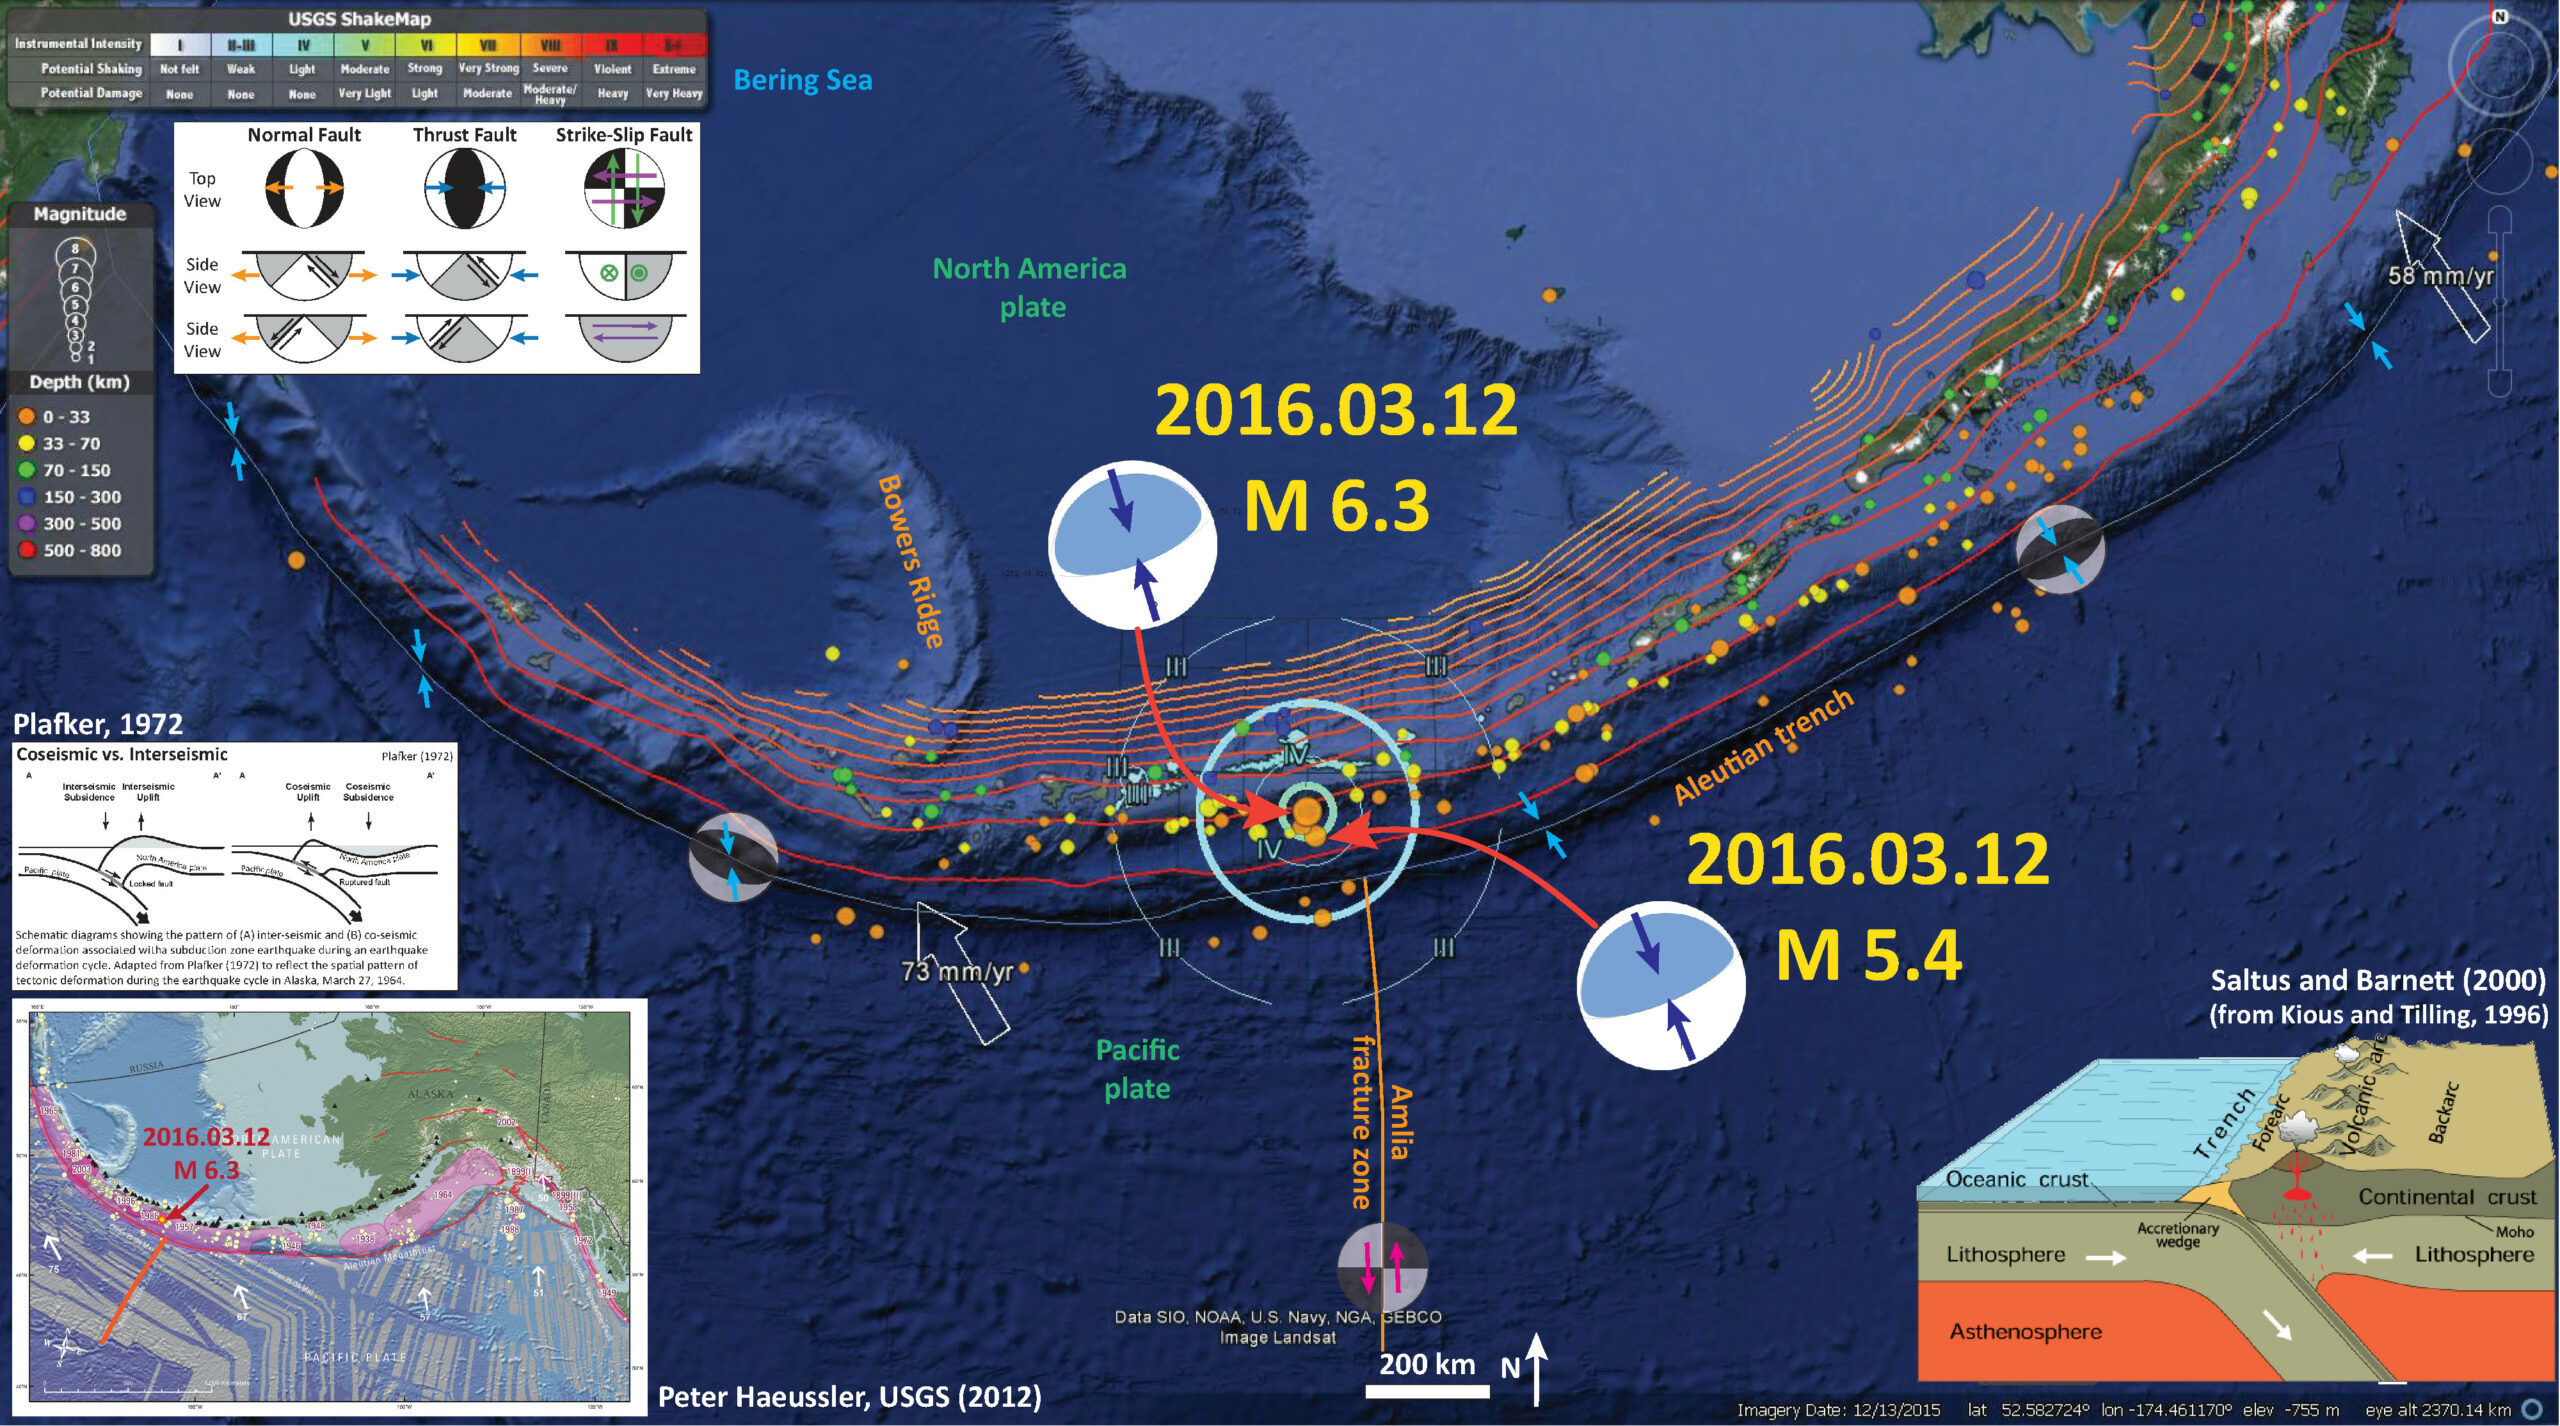
Below is my interpretive map where I use Google Earth and the kml (keyhole markup language) files from the USGS to plot epicenters, Modified Mercalli Intensity Scale (MMI) contours, and the subduction zone slab contours for this region (Hayes et al., 2012). I also place the USGS moment tensors for the two largest earthquakes (M 5.4 and M 6.3). The MMI is a qualitative measure of shaking intensity. More on the MMI scale can be found here and here.
There is a legend that shows how moment tensors can be interpreted. Moment tensors are graphical solutions of seismic data that show two possible fault plane solutions. One must use local tectonics, along with other data, to be able to interpret which of the two possible solutions is correct. The legend shows how these two solutions are oriented for each example (Normal/Extensional, Thrust/Compressional, and Strike-Slip/Shear). There is more about moment tensors and focal mechanisms at the USGS.
These earthquakes are the result of north-northwest compression from the subduction of the Pacific plate underneath the North America plate to the north. These earthquakes occurred in the region of the subduction zone west of where the Amlia fracture zone is aligned. The AMZ is a left lateral strike slip oriented fracture zone, which displaces crust of unequal age, beneath the megathrust. The difference in age results in a variety of factors that may contribute to differences in fault stress across the fracture zone (buoyancy, thermal properties, etc). For example, older crust is colder and denser, so it sinks lower into the mantle and exerts a different tectonic force upon the overriding plate.
The red-orange-yellow lines are slab contour lines from Hayes et al. (2012). These lines are a best estimate for the depth to the subduction zone fault. These are based largely upon seismicity and there is currently an effort to update these contours to integrate other data types.
-
I include some inset figures.
- The lower right figure from Saltus and Barnett (2000) shows an oblique cross section of the Aleutian subduction zone that is a part of the “Eastern Aleutian Volcanic Arc Digital Model.’
- In the lower left corner, I place a map created by Peter Haeussler, USGS, which shows the historic earthquakes along the Alaska and Aleutian subduction zones.
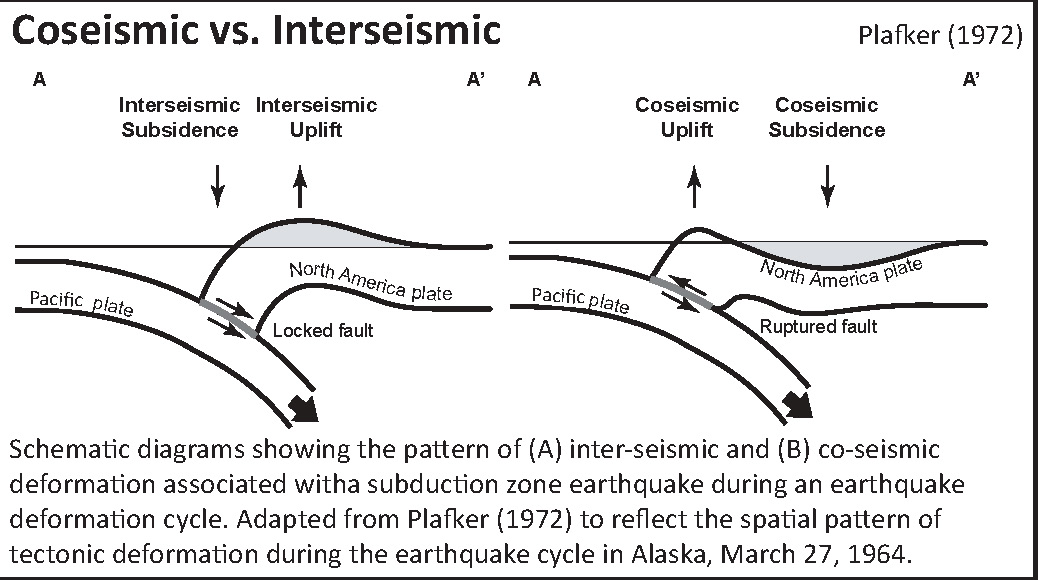
- Above Hauessler’s map, I show a cross section of a subduction zone through the two main parts of the earthquake cycle. The interseismic part (in-between earthquakes) and the coseismic part (during earthquakes). This was developed by George Plafker and published in his 1972 paper on the Good Friday Earthquake.

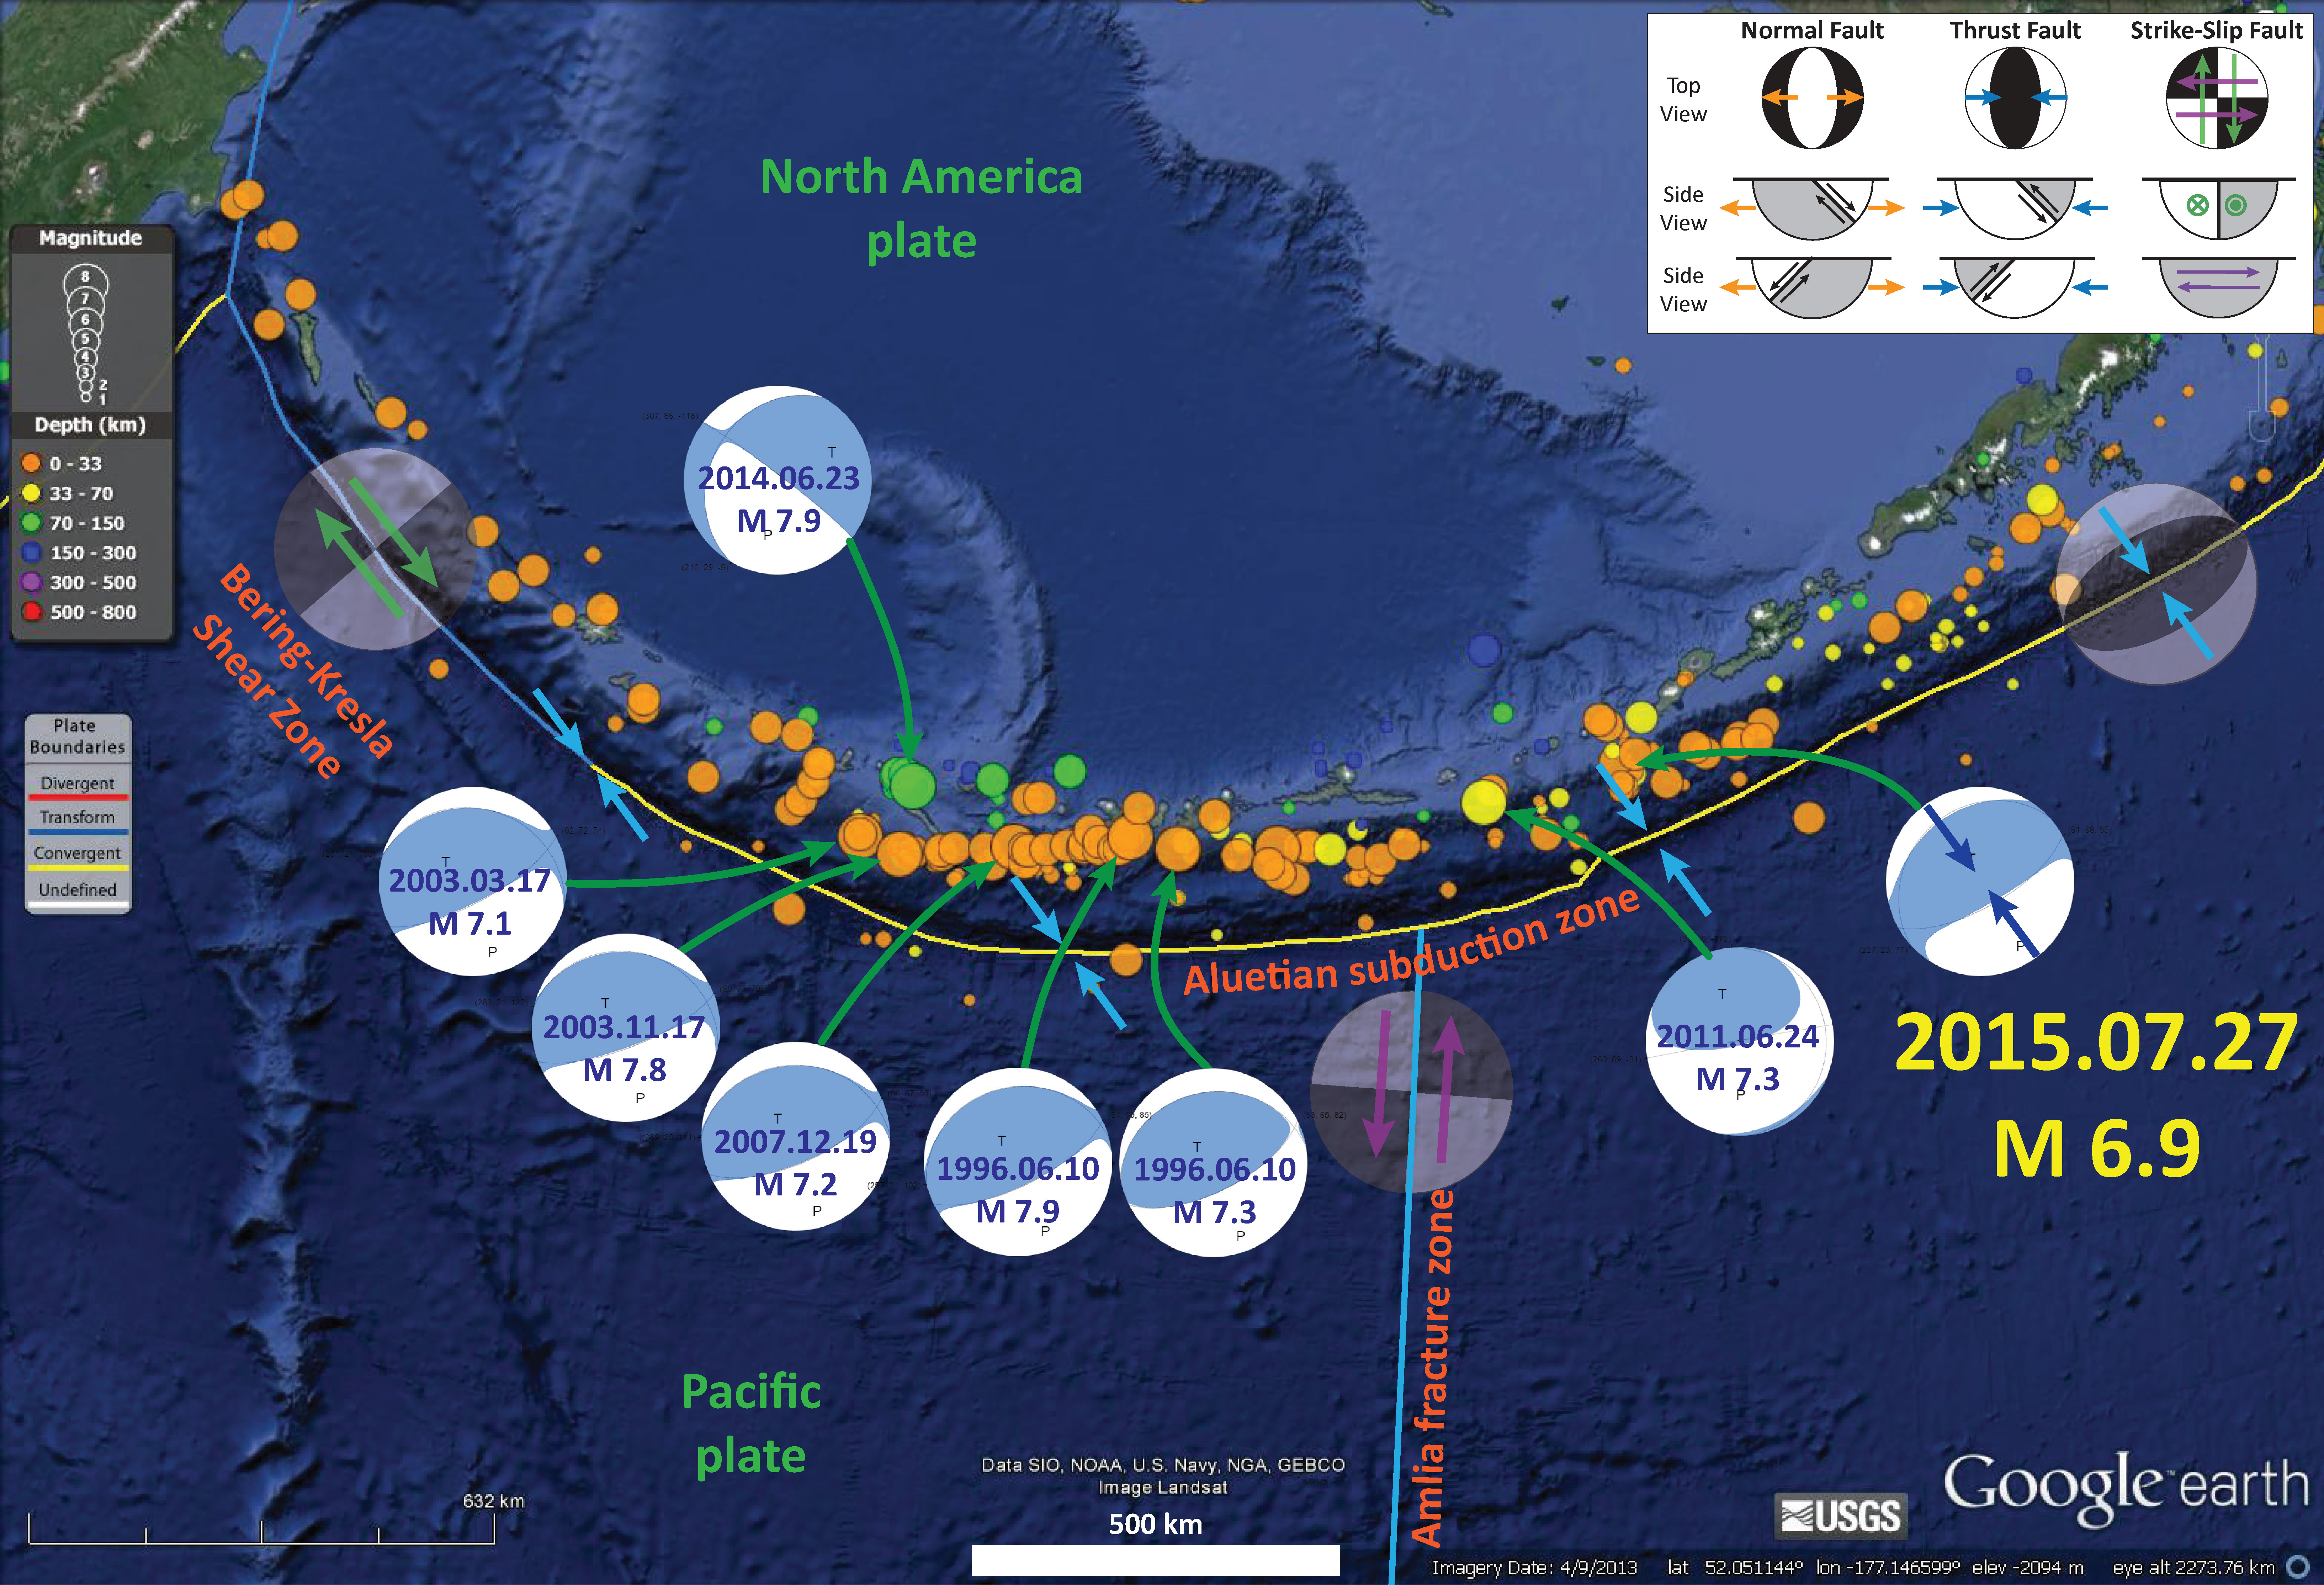
In July 2015, just to the east, there were some earthquakes near the Fox Islands. Here is my earthquake report for those earthquakes. Below is a map showing my interpretation.
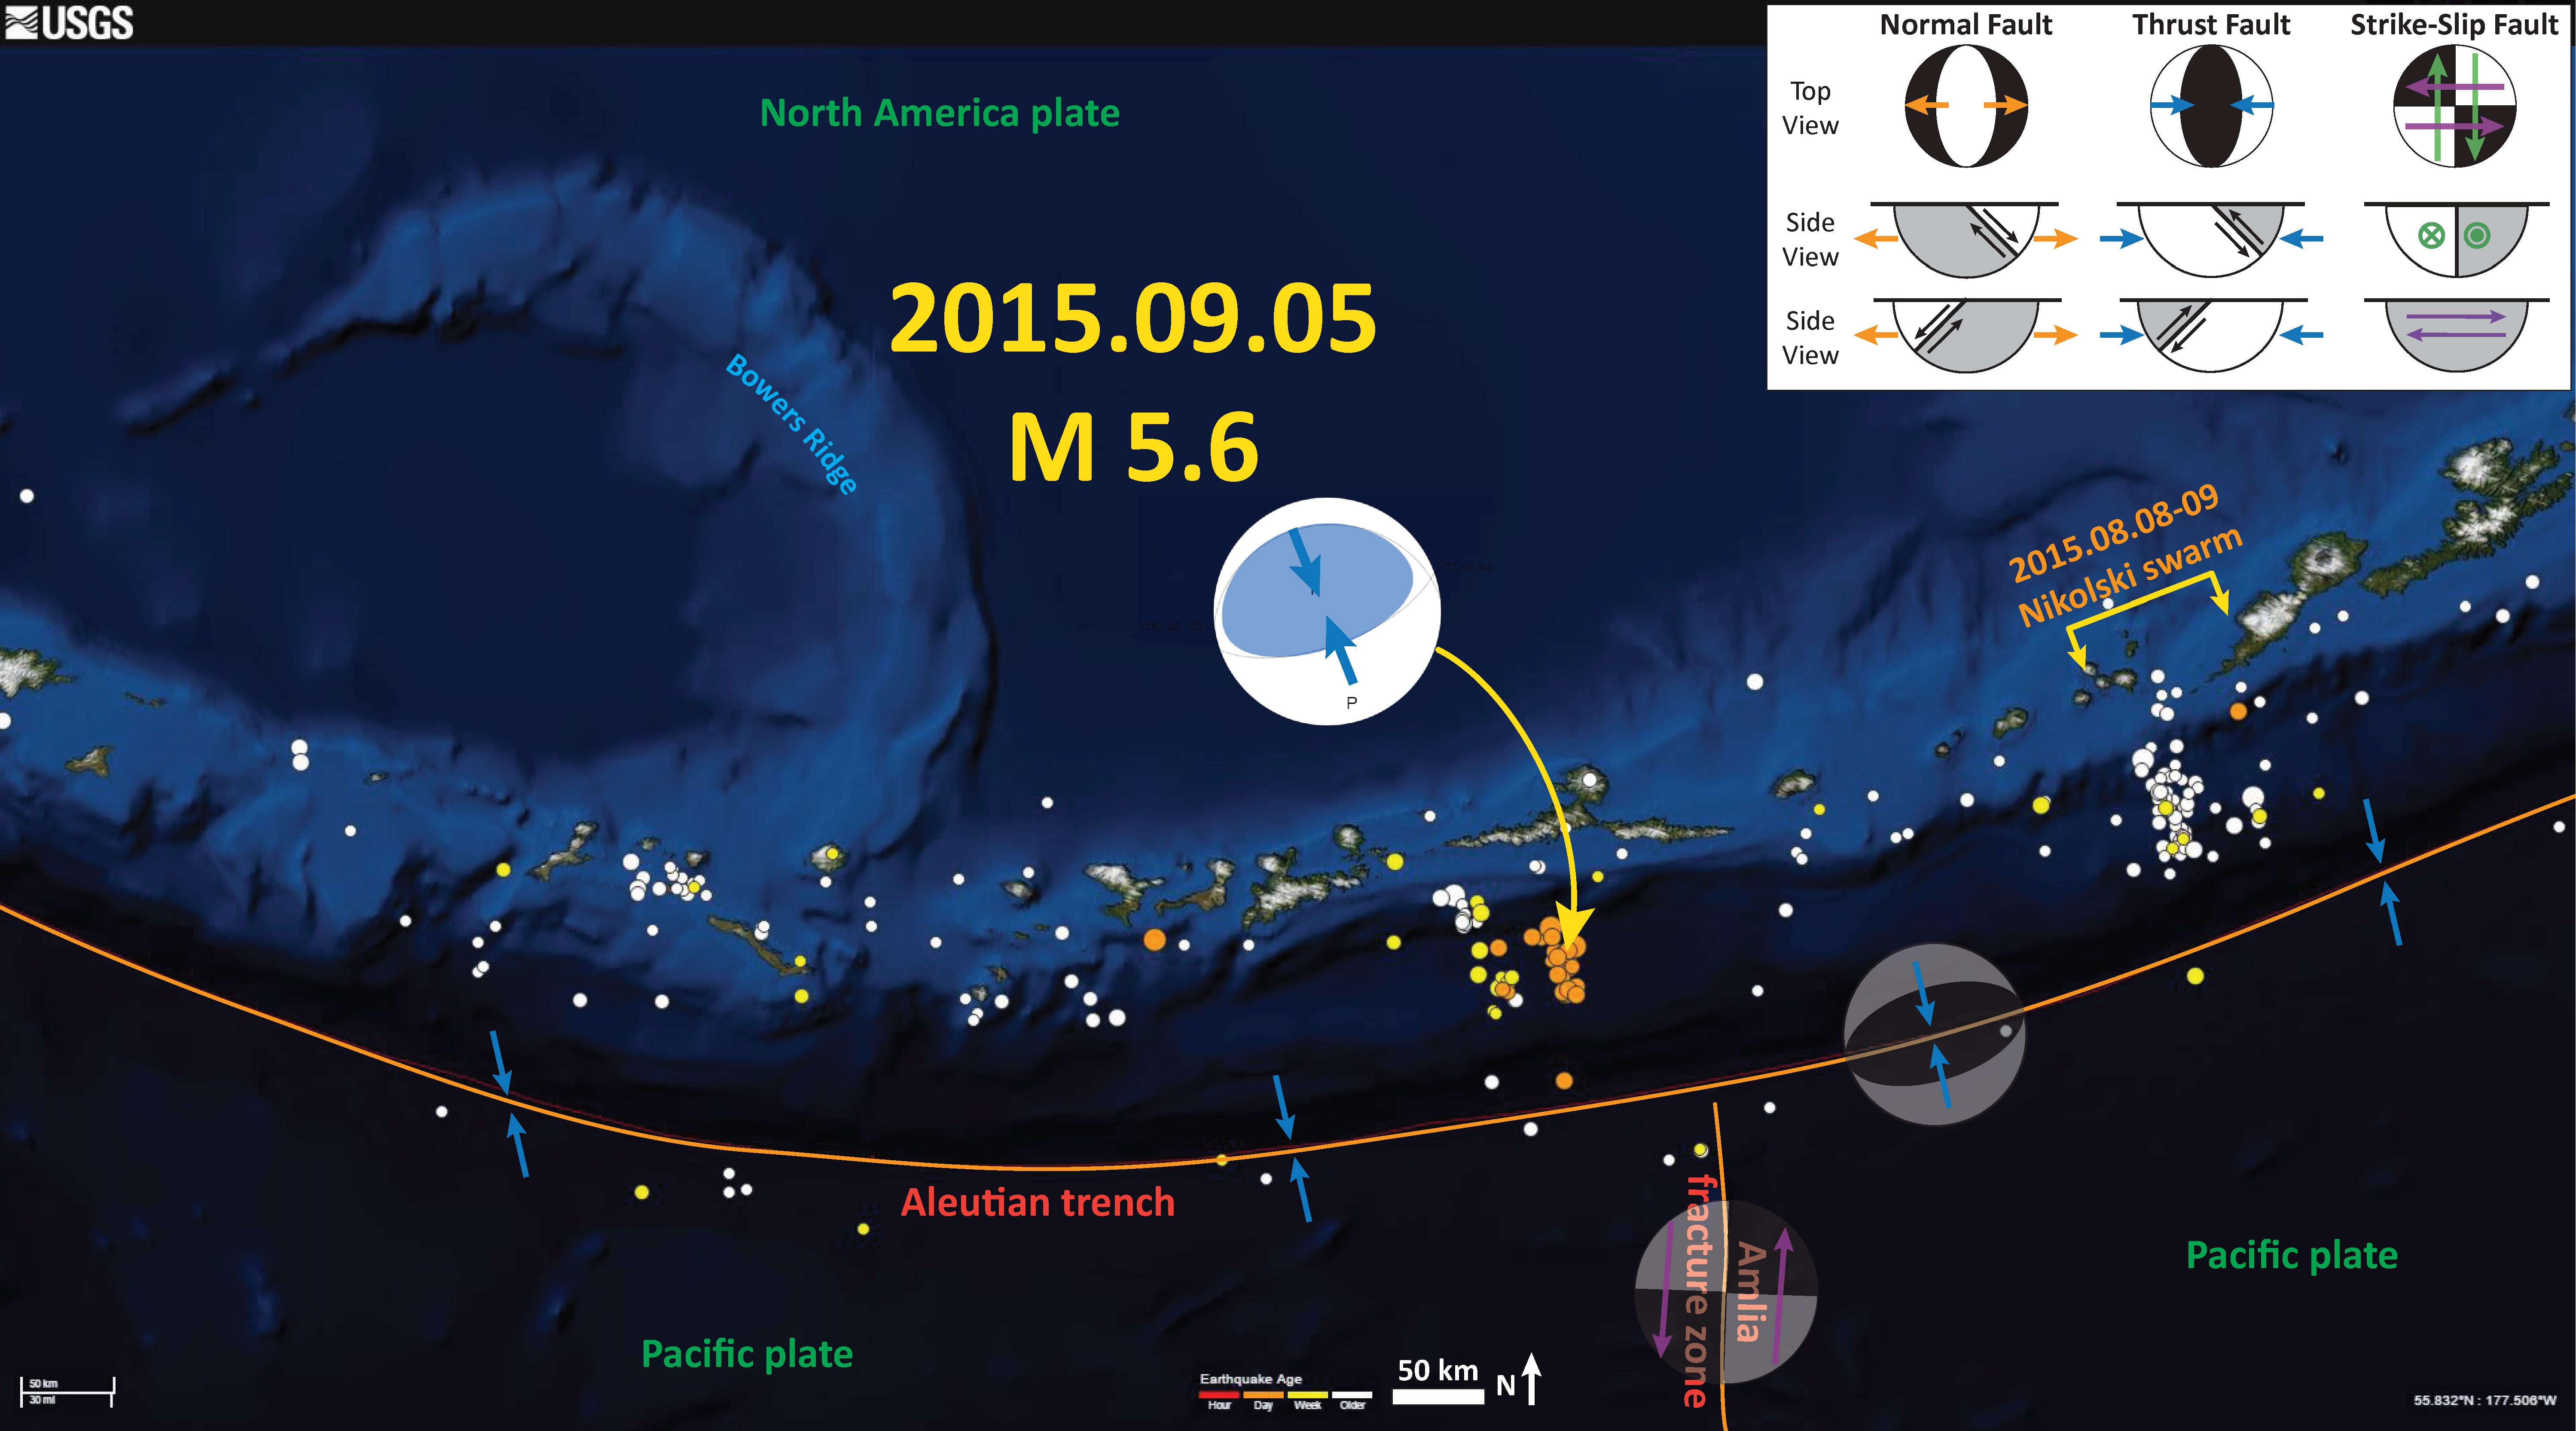
The region near the Amlia fracture zone was active in September of 2015 also. Here is my earthquake report from that series of earthquakes. Below is a map from this 2015/09 report that shows some late 20th and early 21st century earthquakes and their moment tensors for this region of the Aleutian subduction zone.
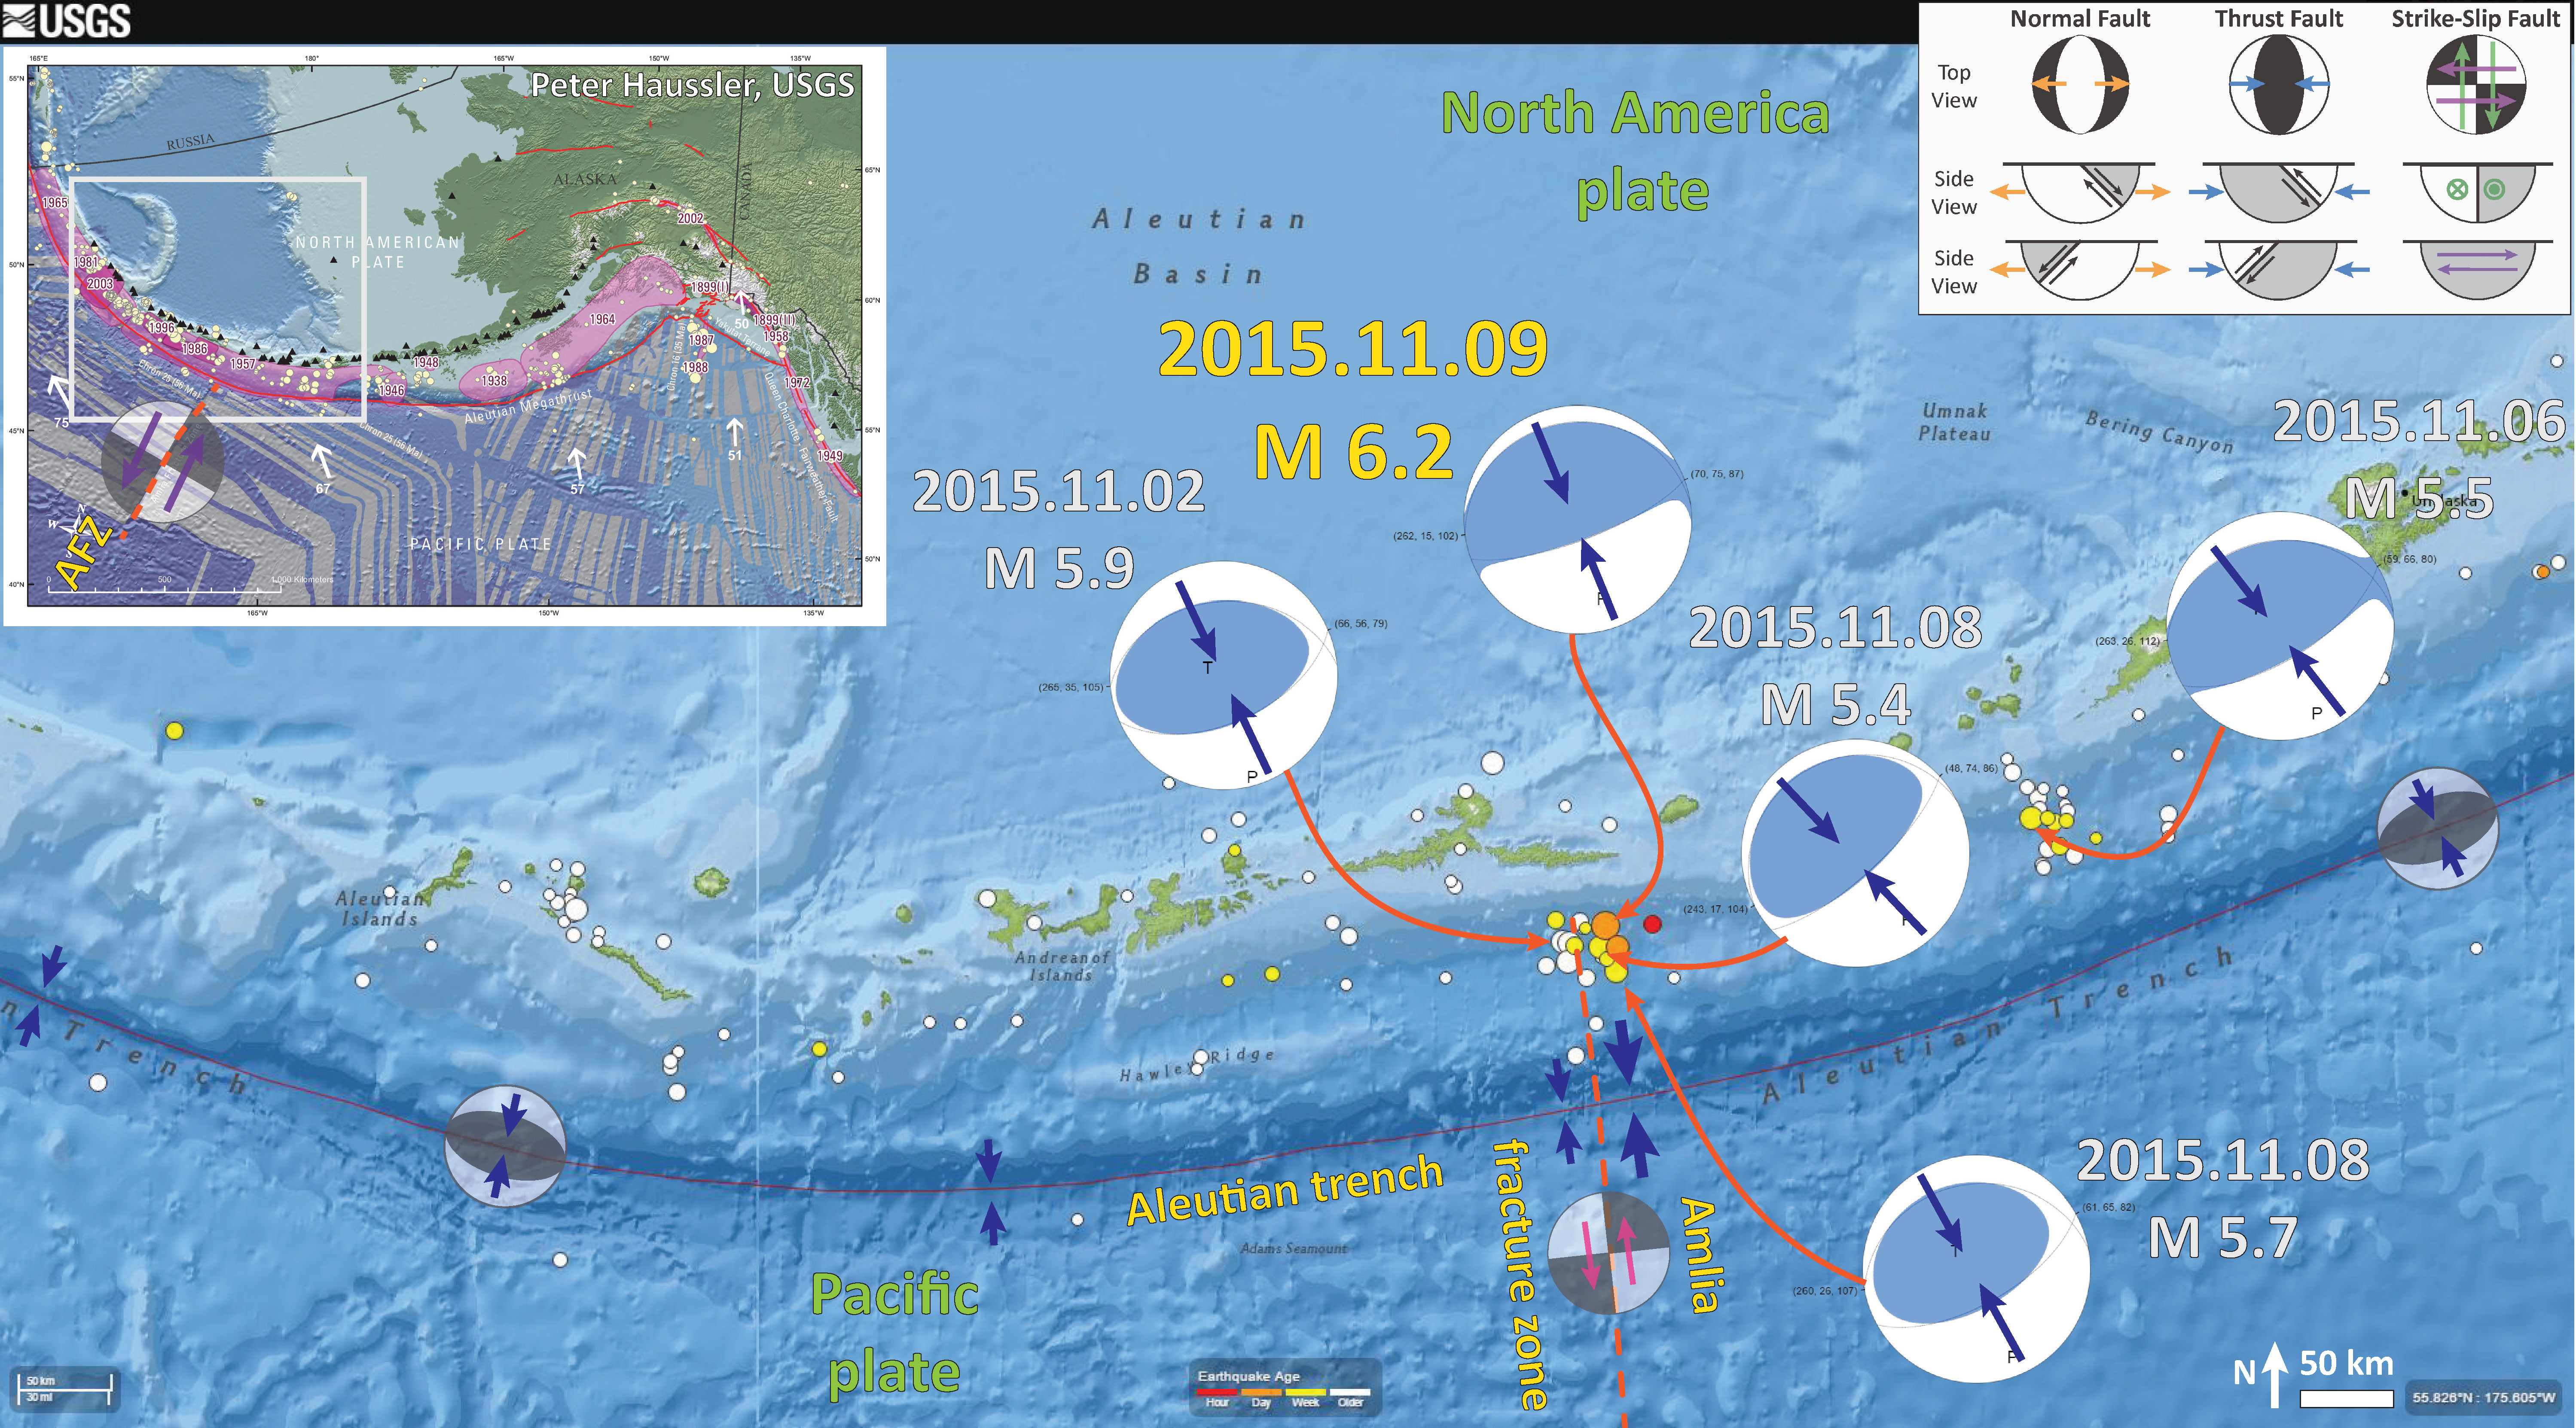
Shortly after, in November 2015, there was more activity in this region. Here is my summary report on those earthquakes. Below is a map that shows earthquake epicenters and moment tensors from November 2015.
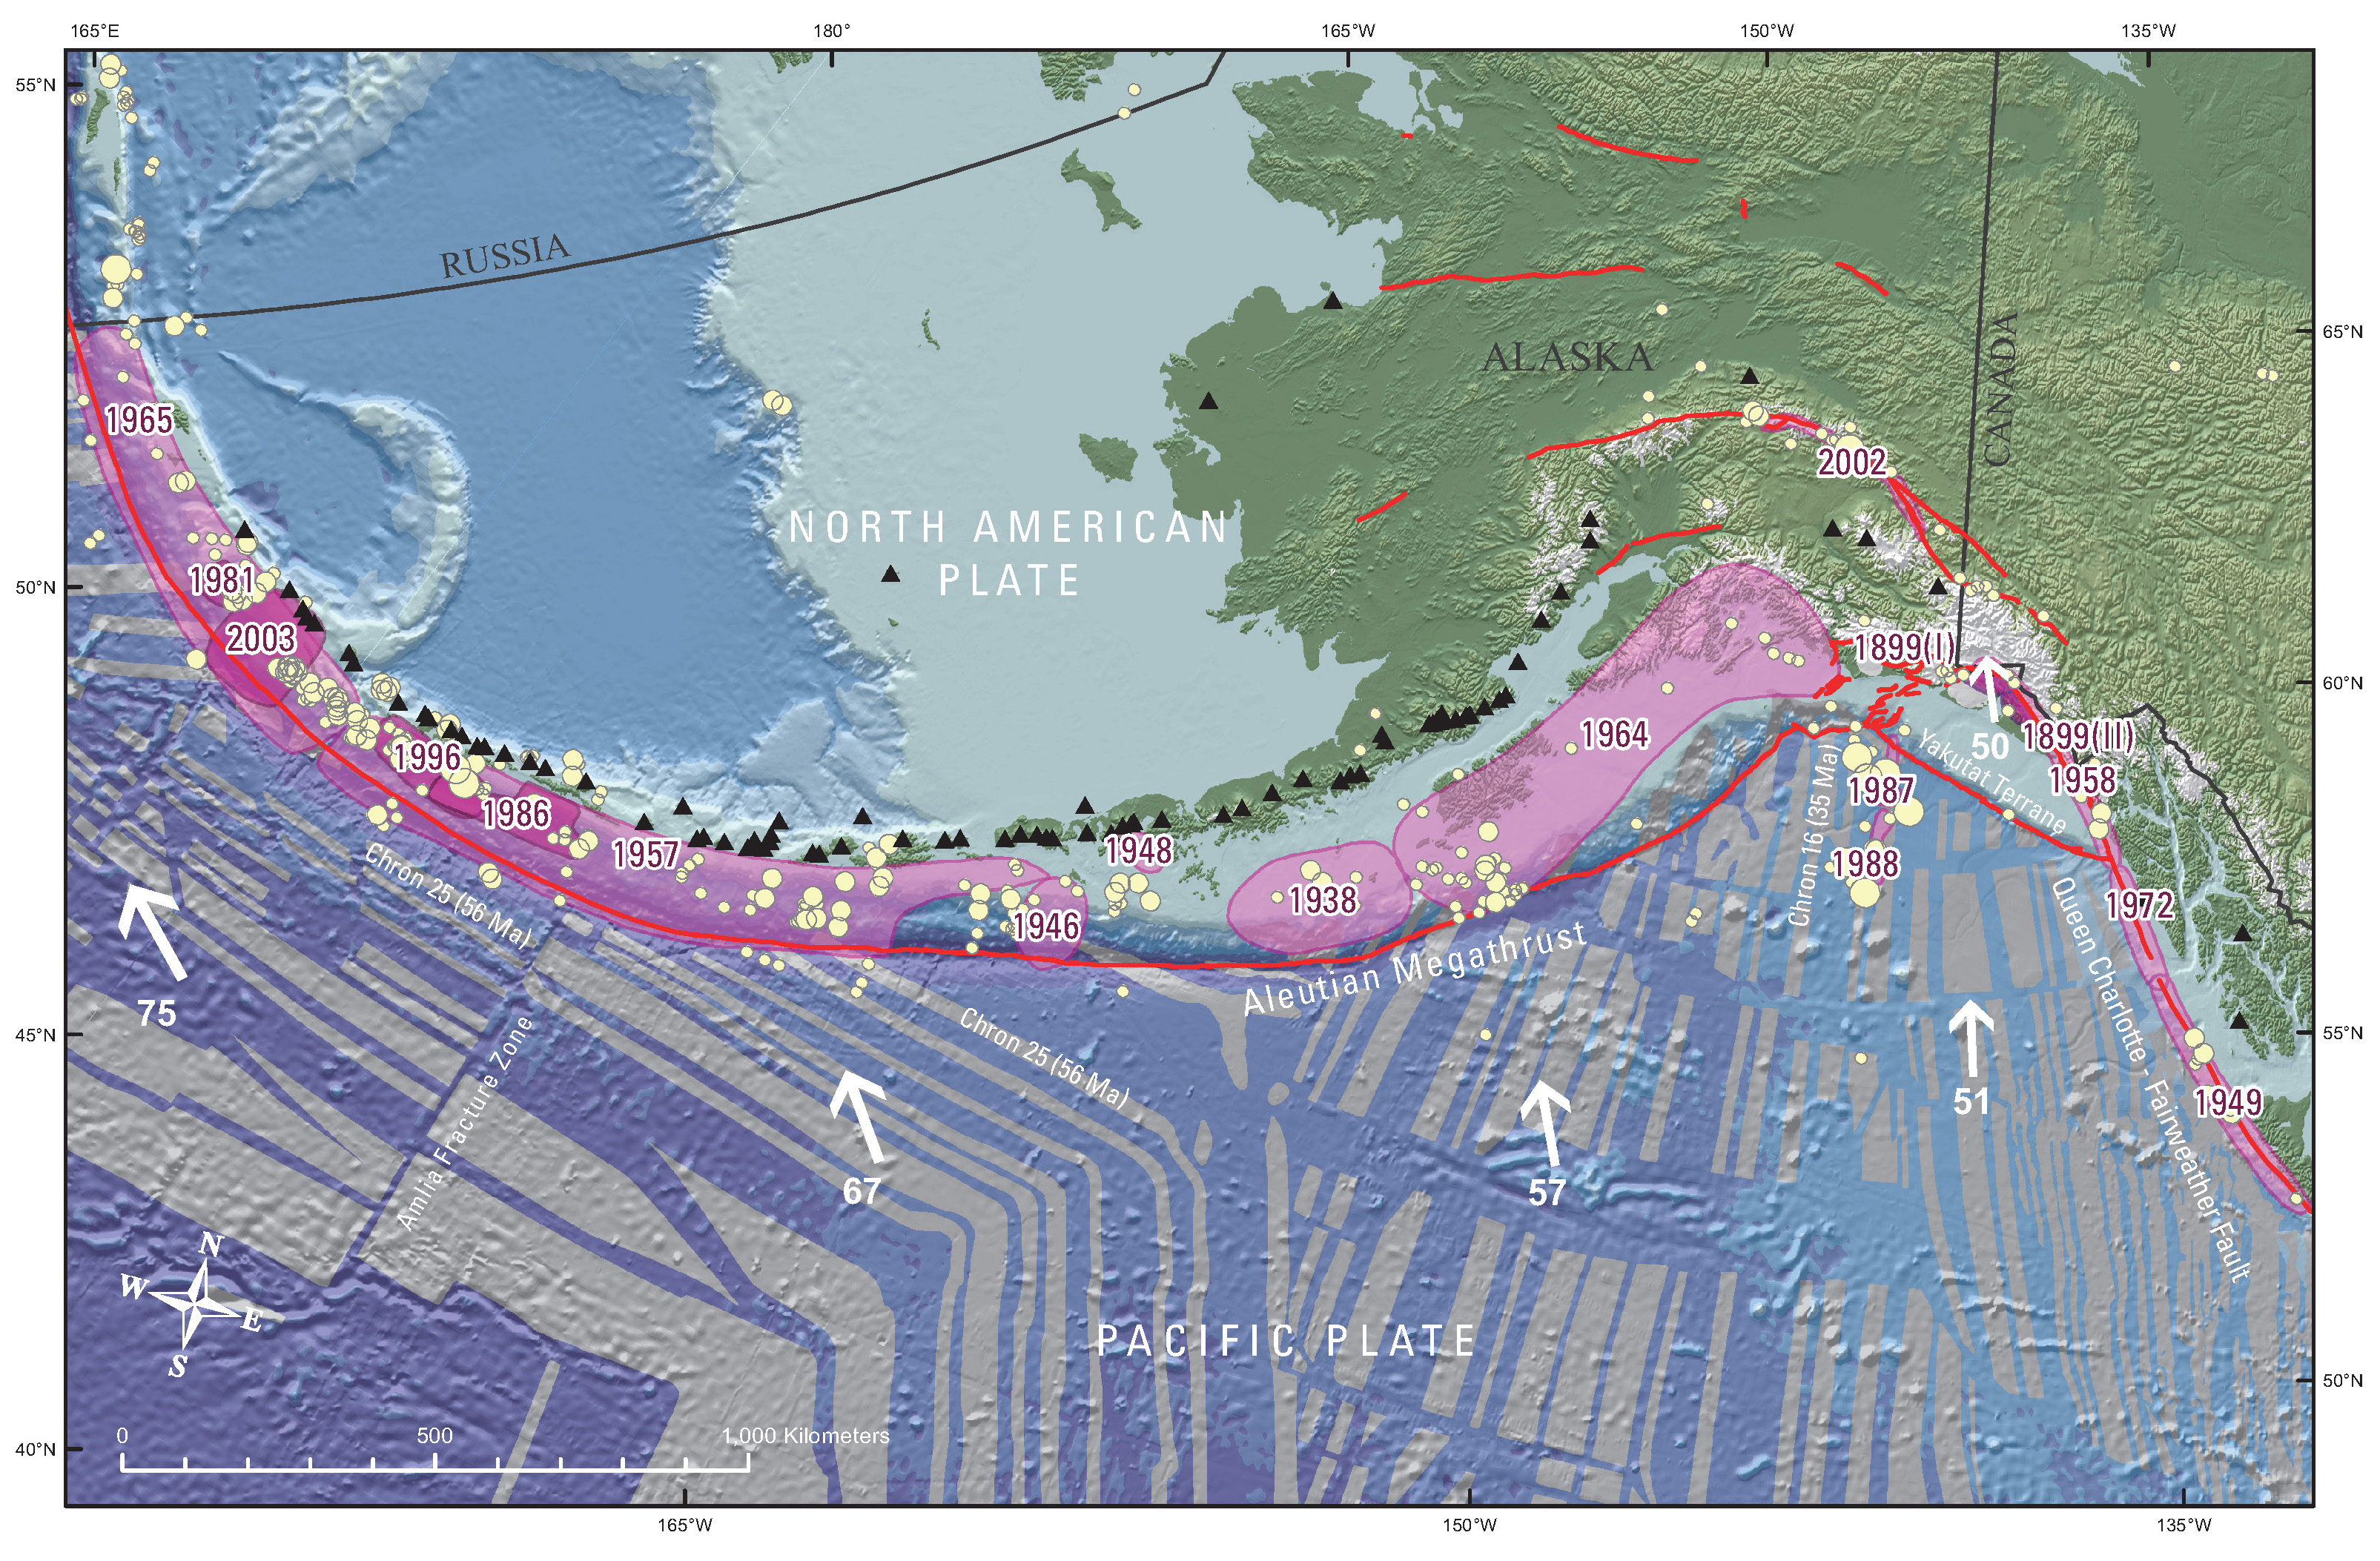
This map is particularly useful on its own. This is the map that shows historic earthquake slip regions as pink polygons (Peter Haeussler, USGS). Dr. Haeussler also plotted the magnetic anomalies (grey regions), the arc volcanoes (black diamonds), and the plate motion vectors (mm/yr, NAP vs PP).
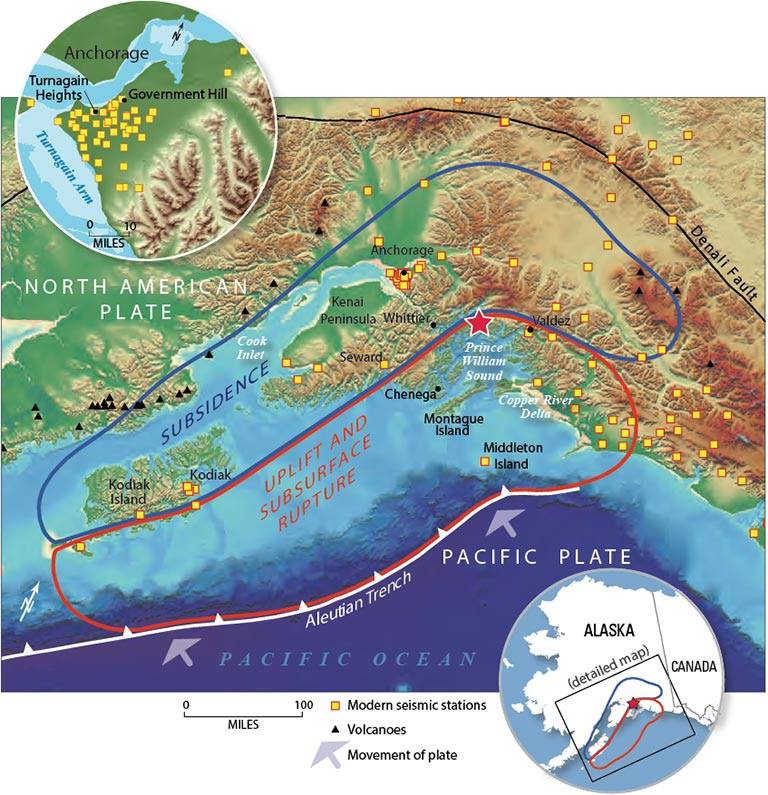
Speaking of the 1964 earthquake, here is a map that shows the regions of coseismic uplift and subsidence observed following that earthquake. The 27 March, 1964 M 9.2 earthquake is the second largest earthquake ever recorded on modern seismometers. This figure can be compared to the cross section below.
Here is the Plafker (1972)cross-section graphic on its own.
This figure shows a summary of the measured horizontal and vertical displacements from the Good Friday Earthquake. I include a figure caption from here below as a blockquote.
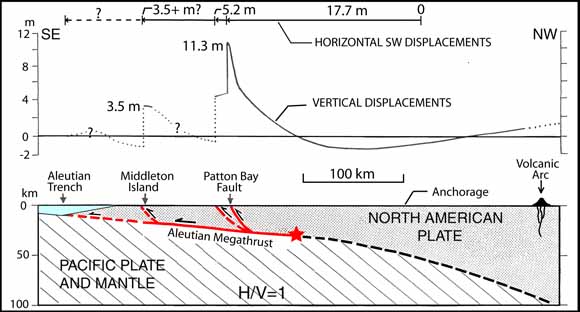
Profile and section of coseismic deformation associated with the 1964 Alaska earthquake across the Aleutian arc (oriented NW-SE through Middleton and Montague Islands). Profile of horizontal and vertical components of coseismic slip (above) and inferred slip partitioning between the megathrust and intraplate faults (below). From Plafker (1965, 1967; 1972)
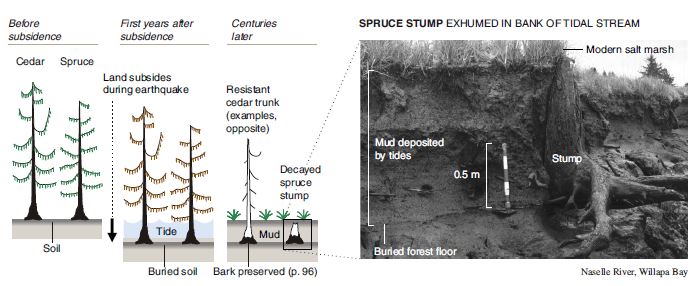
Here is a graphic showing the sediment-stratigraphic evidence of earthquakes in Cascadia, but the analogy works for Alaska also. Atwater et al., 2005. There are 3 panels on the left, showing times of (1) prior to earthquake, (2) several years following the earthquake, and (3) centuries after the earthquake. Before the earthquake, the ground is sufficiently above sea level that trees can grow without fear of being inundated with salt water. During the earthquake, the ground subsides (lowers) so that the area is now inundated during high tides. The salt water kills the trees and other plants. Tidal sediment (like mud) starts to be deposited above the pre-earthquake ground surface. This sediment has organisms within it that reflect the tidal environment. Eventually, the sediment builds up and the crust deforms interseismically until the ground surface is again above sea level. Now plants that can survive in this environment start growing again. There are stumps and tree snags that were rooted in the pre-earthquake soil that can be used to estimate the age of the earthquake using radiocarbon age determinations. The tree snags form “ghost forests.
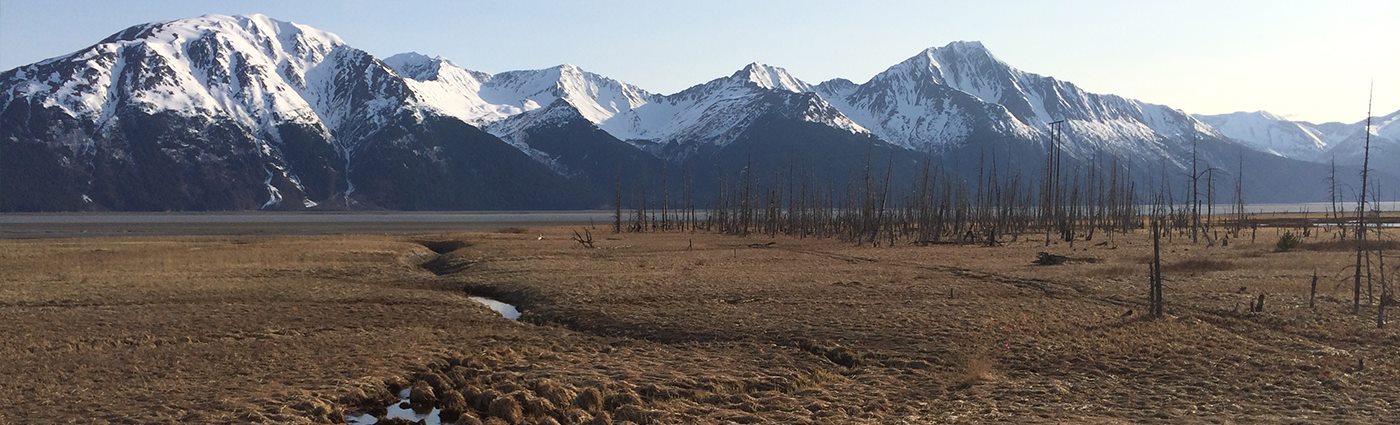
This is a photo that I took along the Seward HWY 1, that runs east of Anchorage along the Turnagain Arm. I attended the 2014 Seismological Society of America Meeting that was located in Anchorage to commemorate the anniversary of the Good Friday Earthquake. This is a ghost forest of trees that perished as a result of coseismic subsidence during the earthquake. Copyright Jason R. Patton (2014). (Please contact me for a higher resolution version of this image: quakejay at gmail.com)
Below is an educational video from the USGS that presents material about subduction zones and the 1964 earthquake and tsunami in particular.
Youtube Source IRIS
WMV file for downloading.
mp4 file for downloading.
-
Credits:
- Animation & graphics by Jenda Johnson, geologist
- Directed by Robert F. Butler, University of Portland
- U.S. Geological Survey consultants: Robert C. Witter, Alaska Science Center Peter J. Haeussler, Alaska Science Center
- Narrated by Roger Groom, Mount Tabor Middle School
-
References:
- Hayes, G.P., Wald, D.J., and Johnson, R.L., 2012. Slab1.0: A three-dimensional model of global subduction zone geometries in, J. Geophys. Res., 117, B01302, doi:10.1029/2011JB008524
- Plafker, G., 1972. Alaskan earthquake of 1964 and Chilean earthquake of 1960: Implications for arc tectonics in Journal of Geophysical Research, v. 77, p. 901-925.
- Saltus, R.W., and Barnett, A., 2000. Eastern Aleutian Volcanic Arc Digital Model – Version 1.0: U.S. Geological Survey Open-File Report 00
4 thoughts on “Earthquake Report: Aleutians, Atka (near Amlia fracture zone)!”