Here I summarize the global seismicity for 2015. I limit this summary to earthquakes with magnitude greater than or equal to M 7.0. I reported on all but one of these earthquakes.
- Here are all the annual summaries:
- Here are the annual summaries for the Cascadia region.
-
I include summaries of my earthquake reports in sorted into three categories. One may also search for earthquakes that may not have made it into these summary pages (use the search tool).
- Magnitude
- Region
- Year
-
Here are the USGS web pages for each of the earthquakes plotted in the map below. This is the USGS query that I used to create the map below.
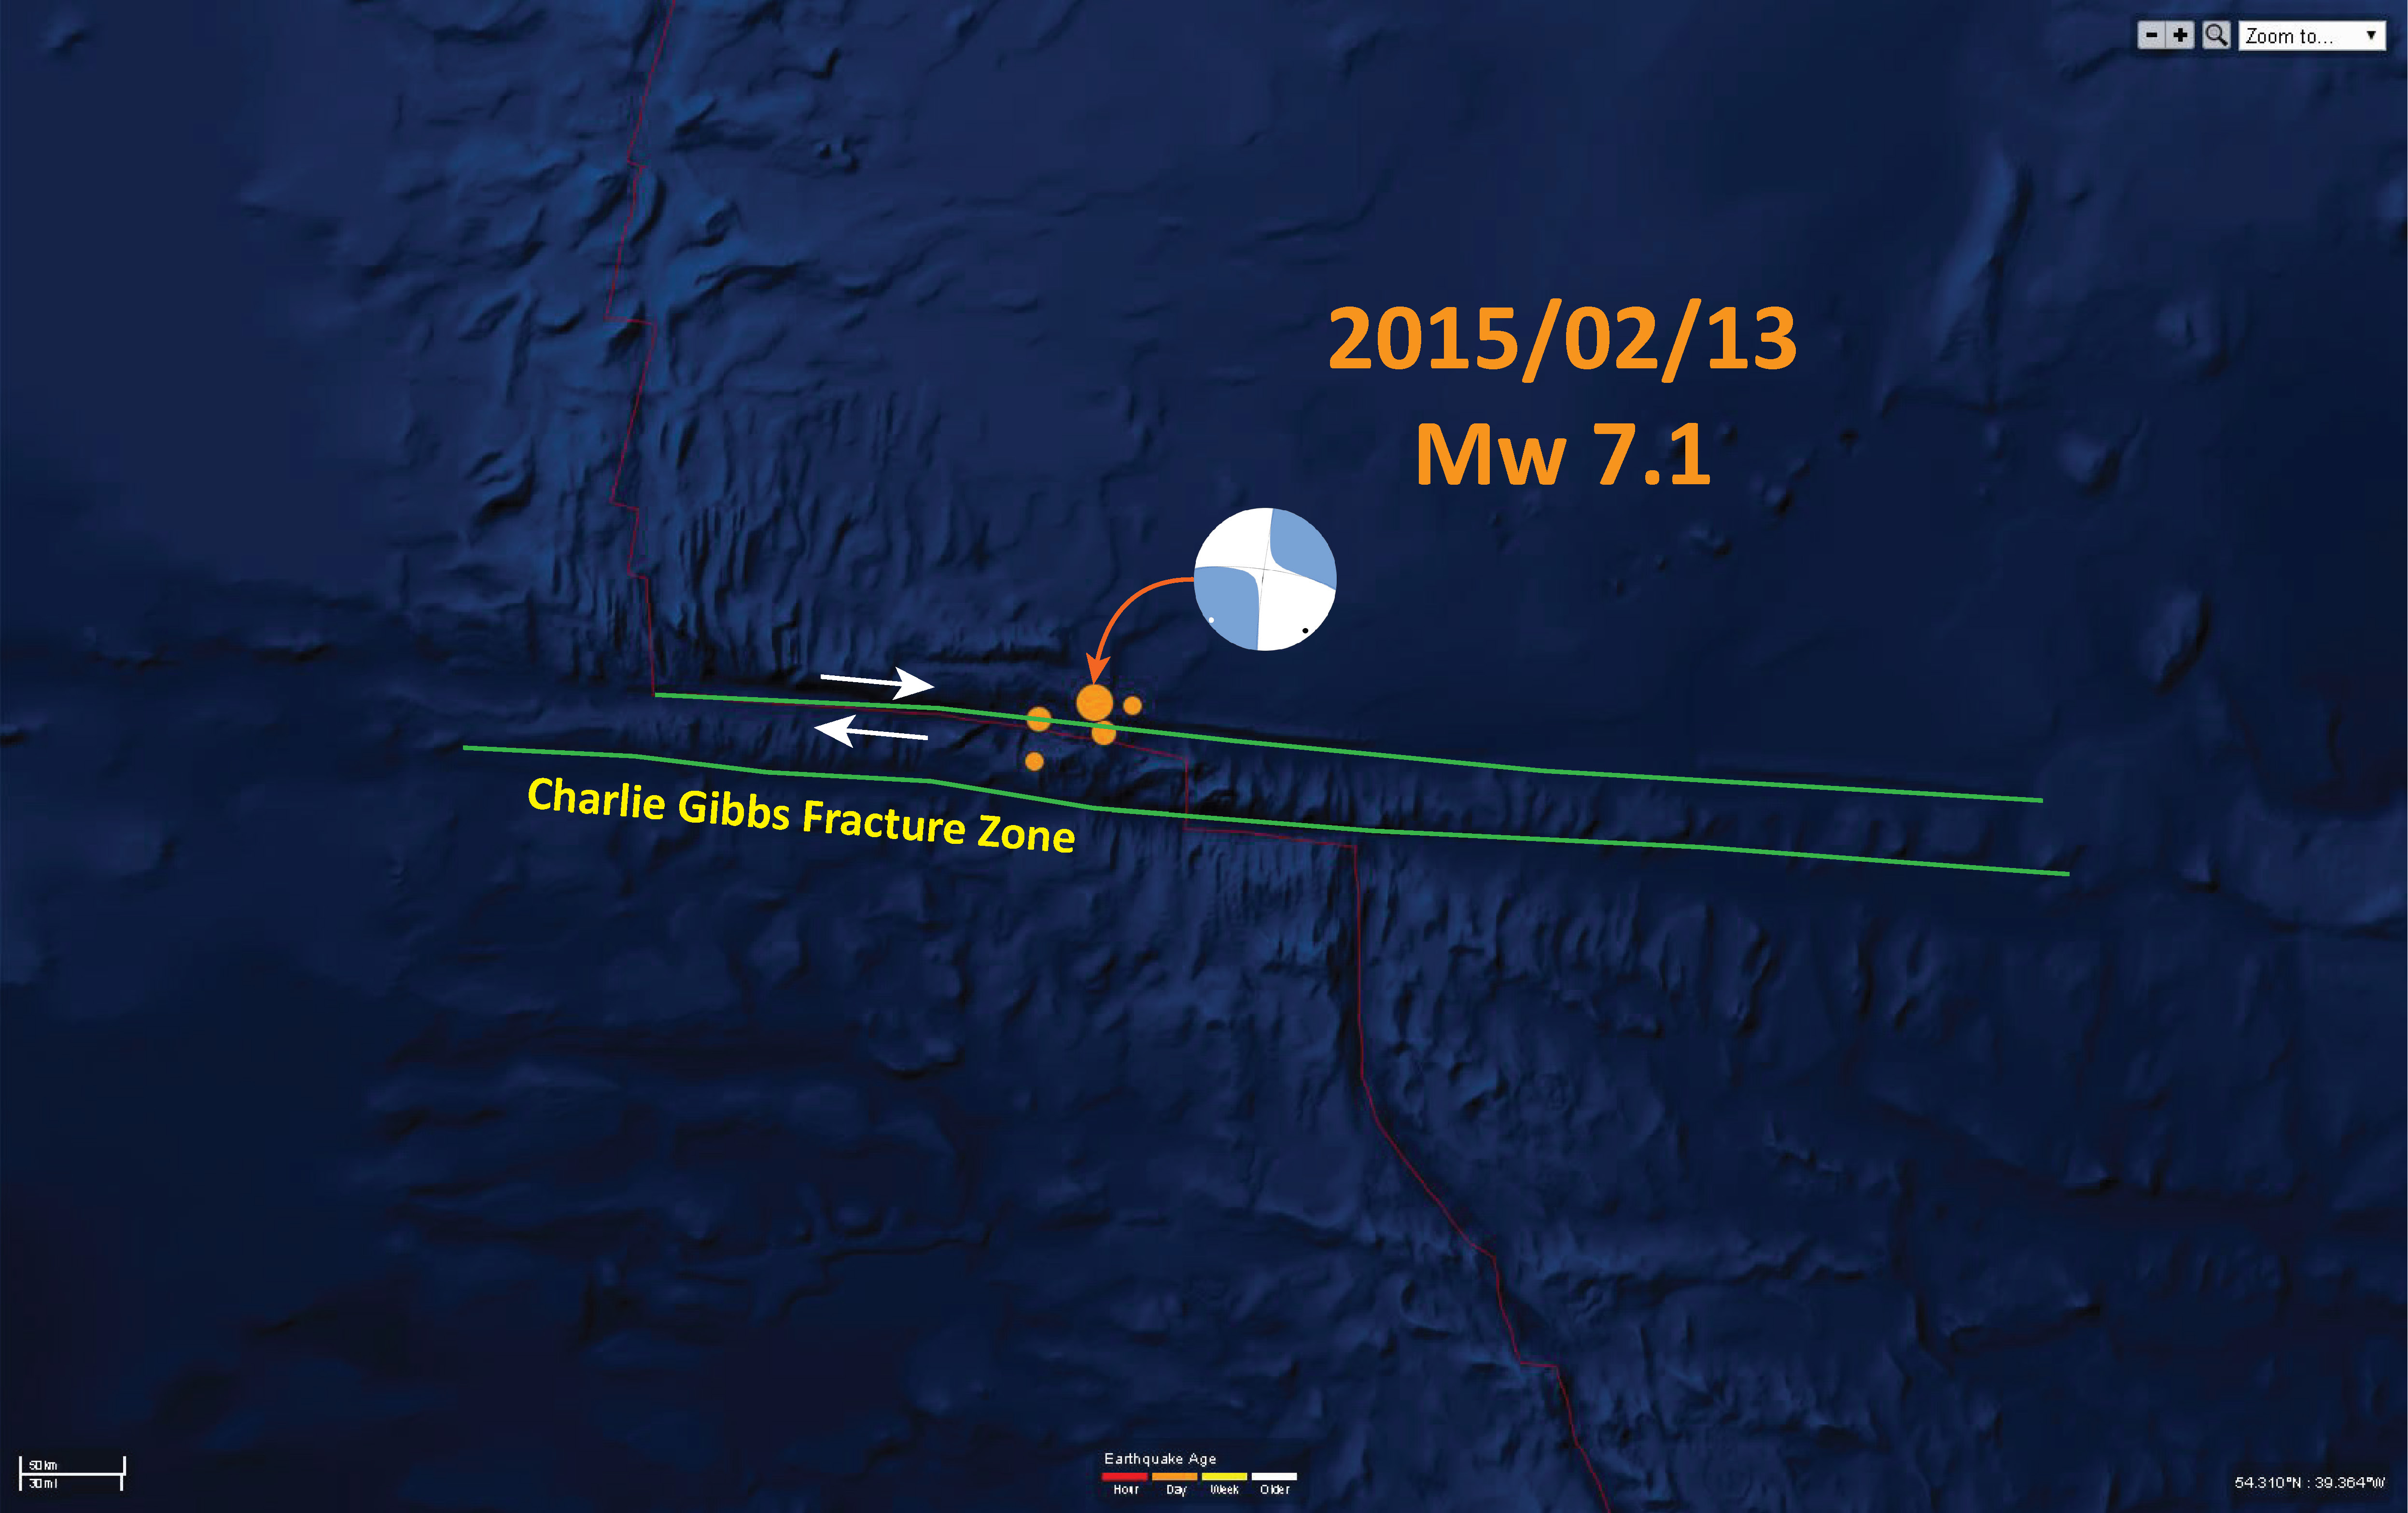
- 2015.02.13 M 7.1 northern Mid Atlantic Ridge
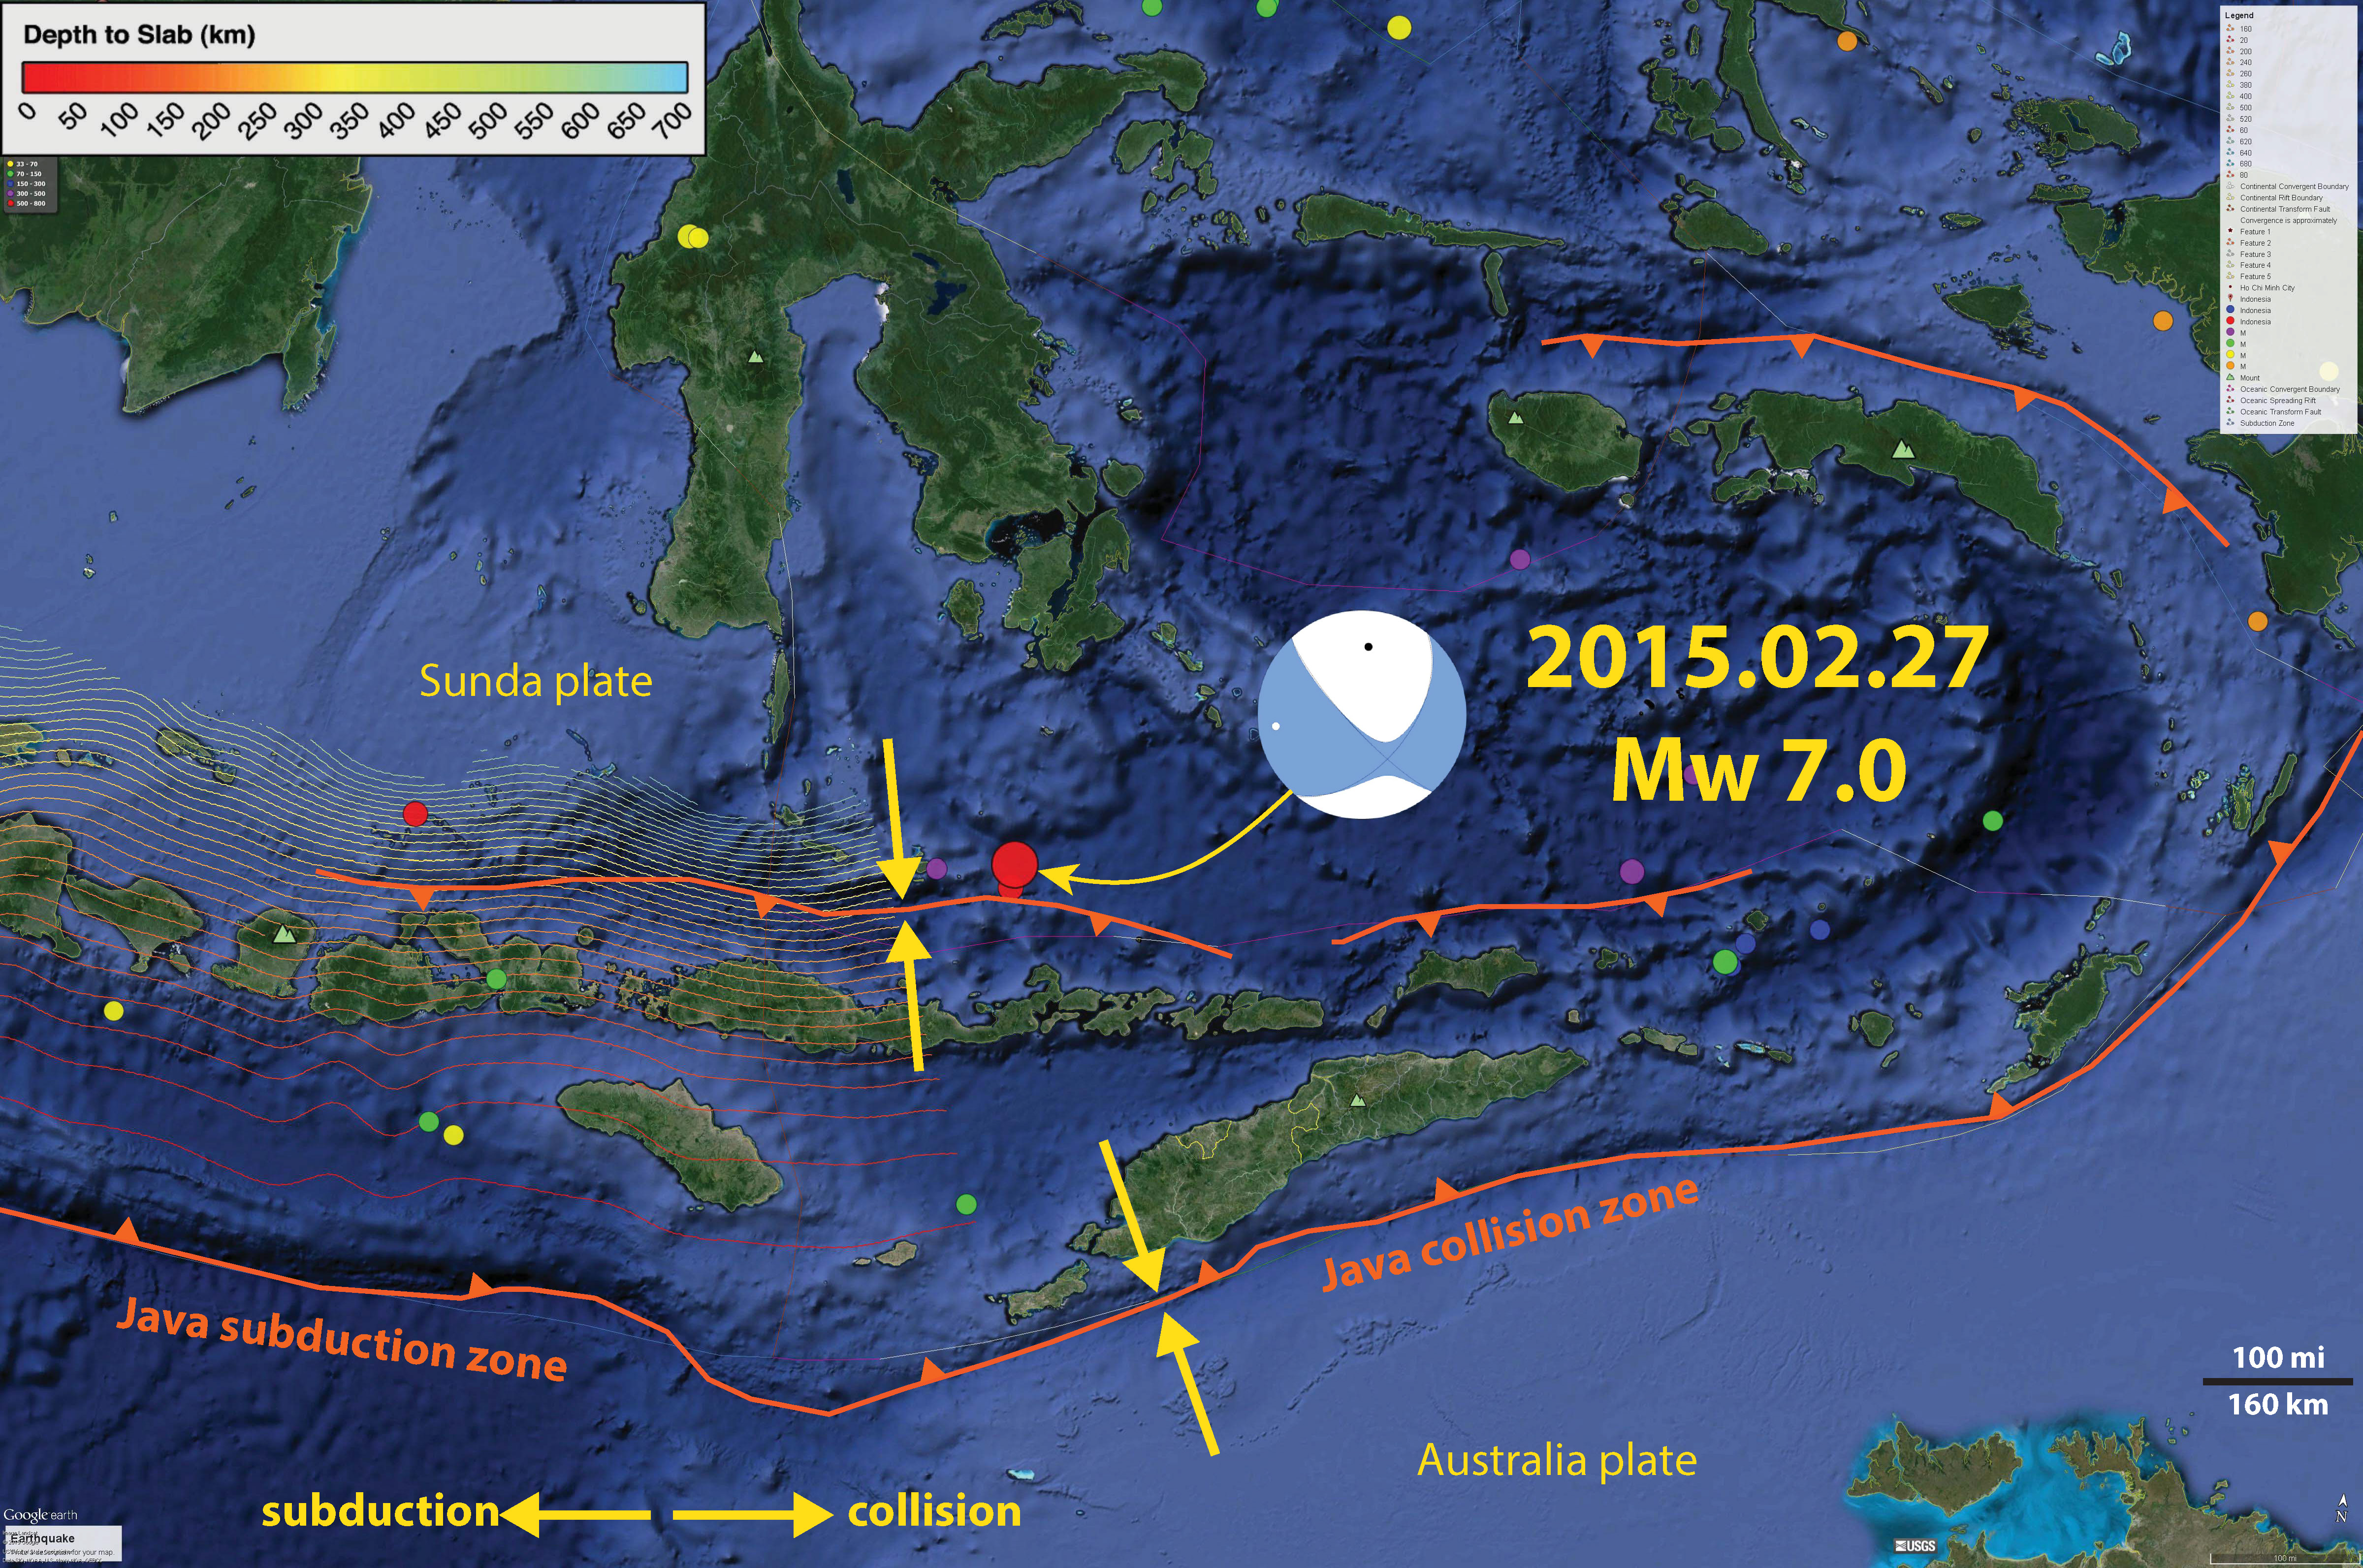
- 2015.02.27 M 7.1 Indonesia
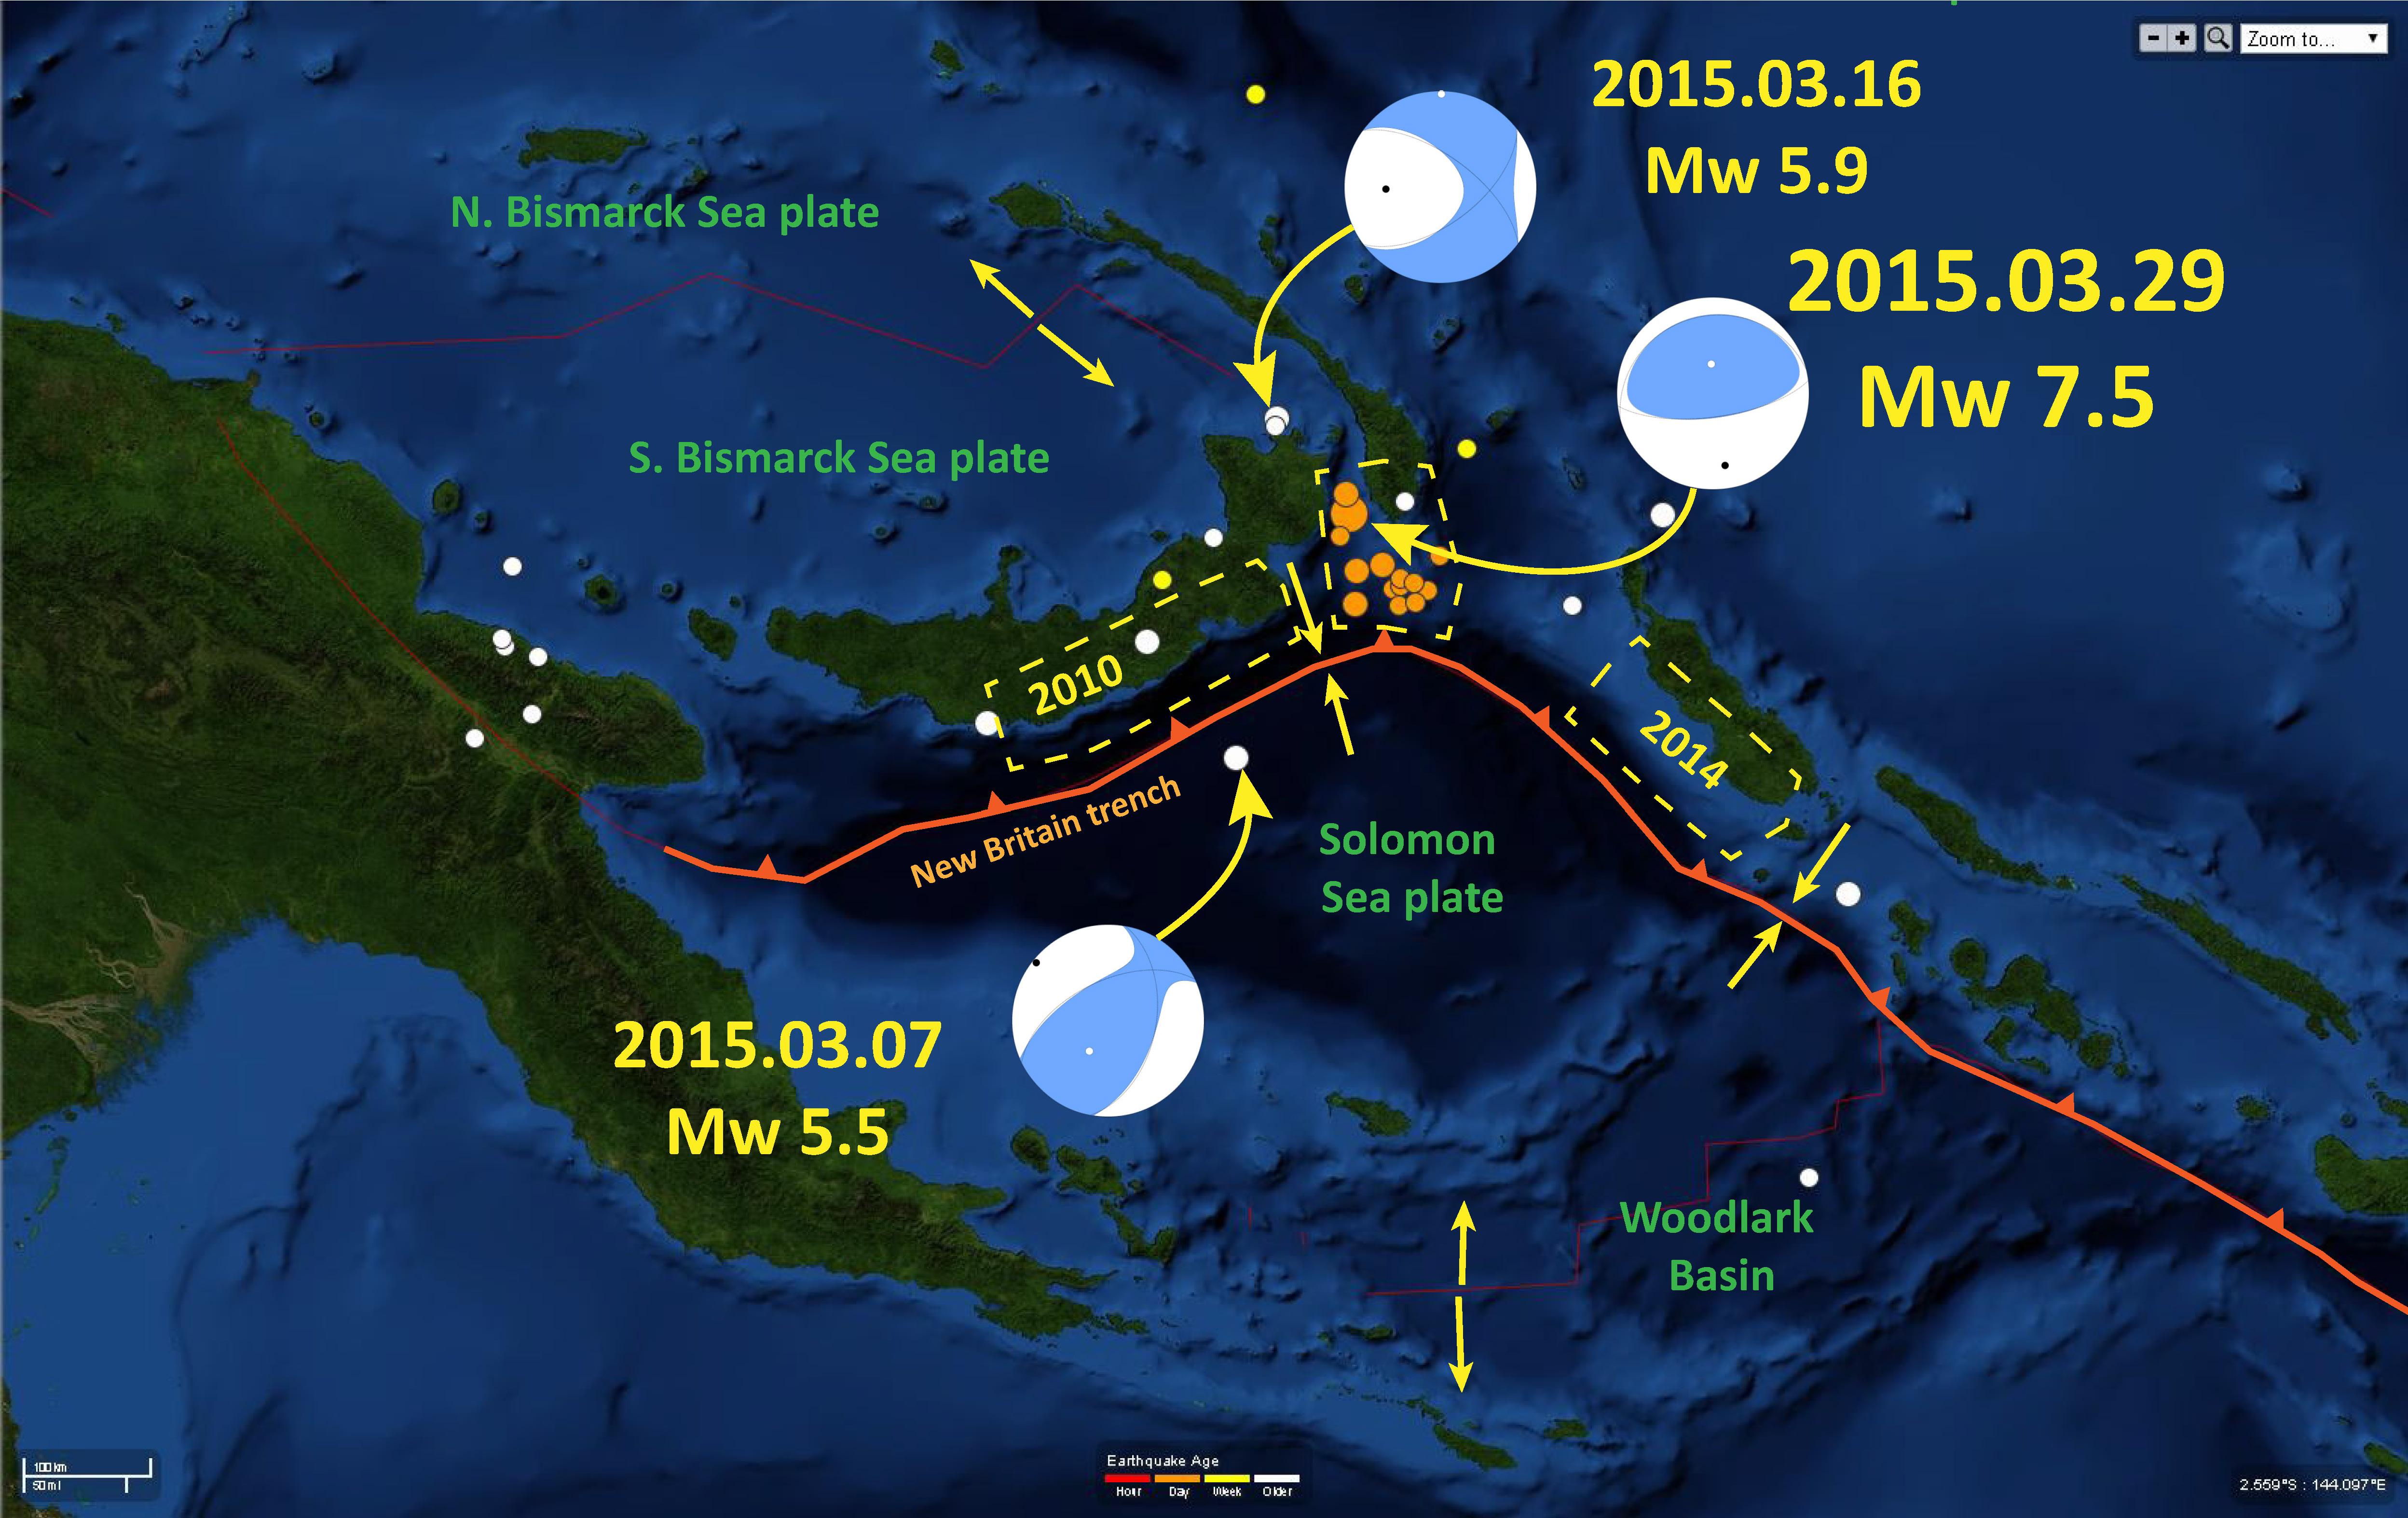
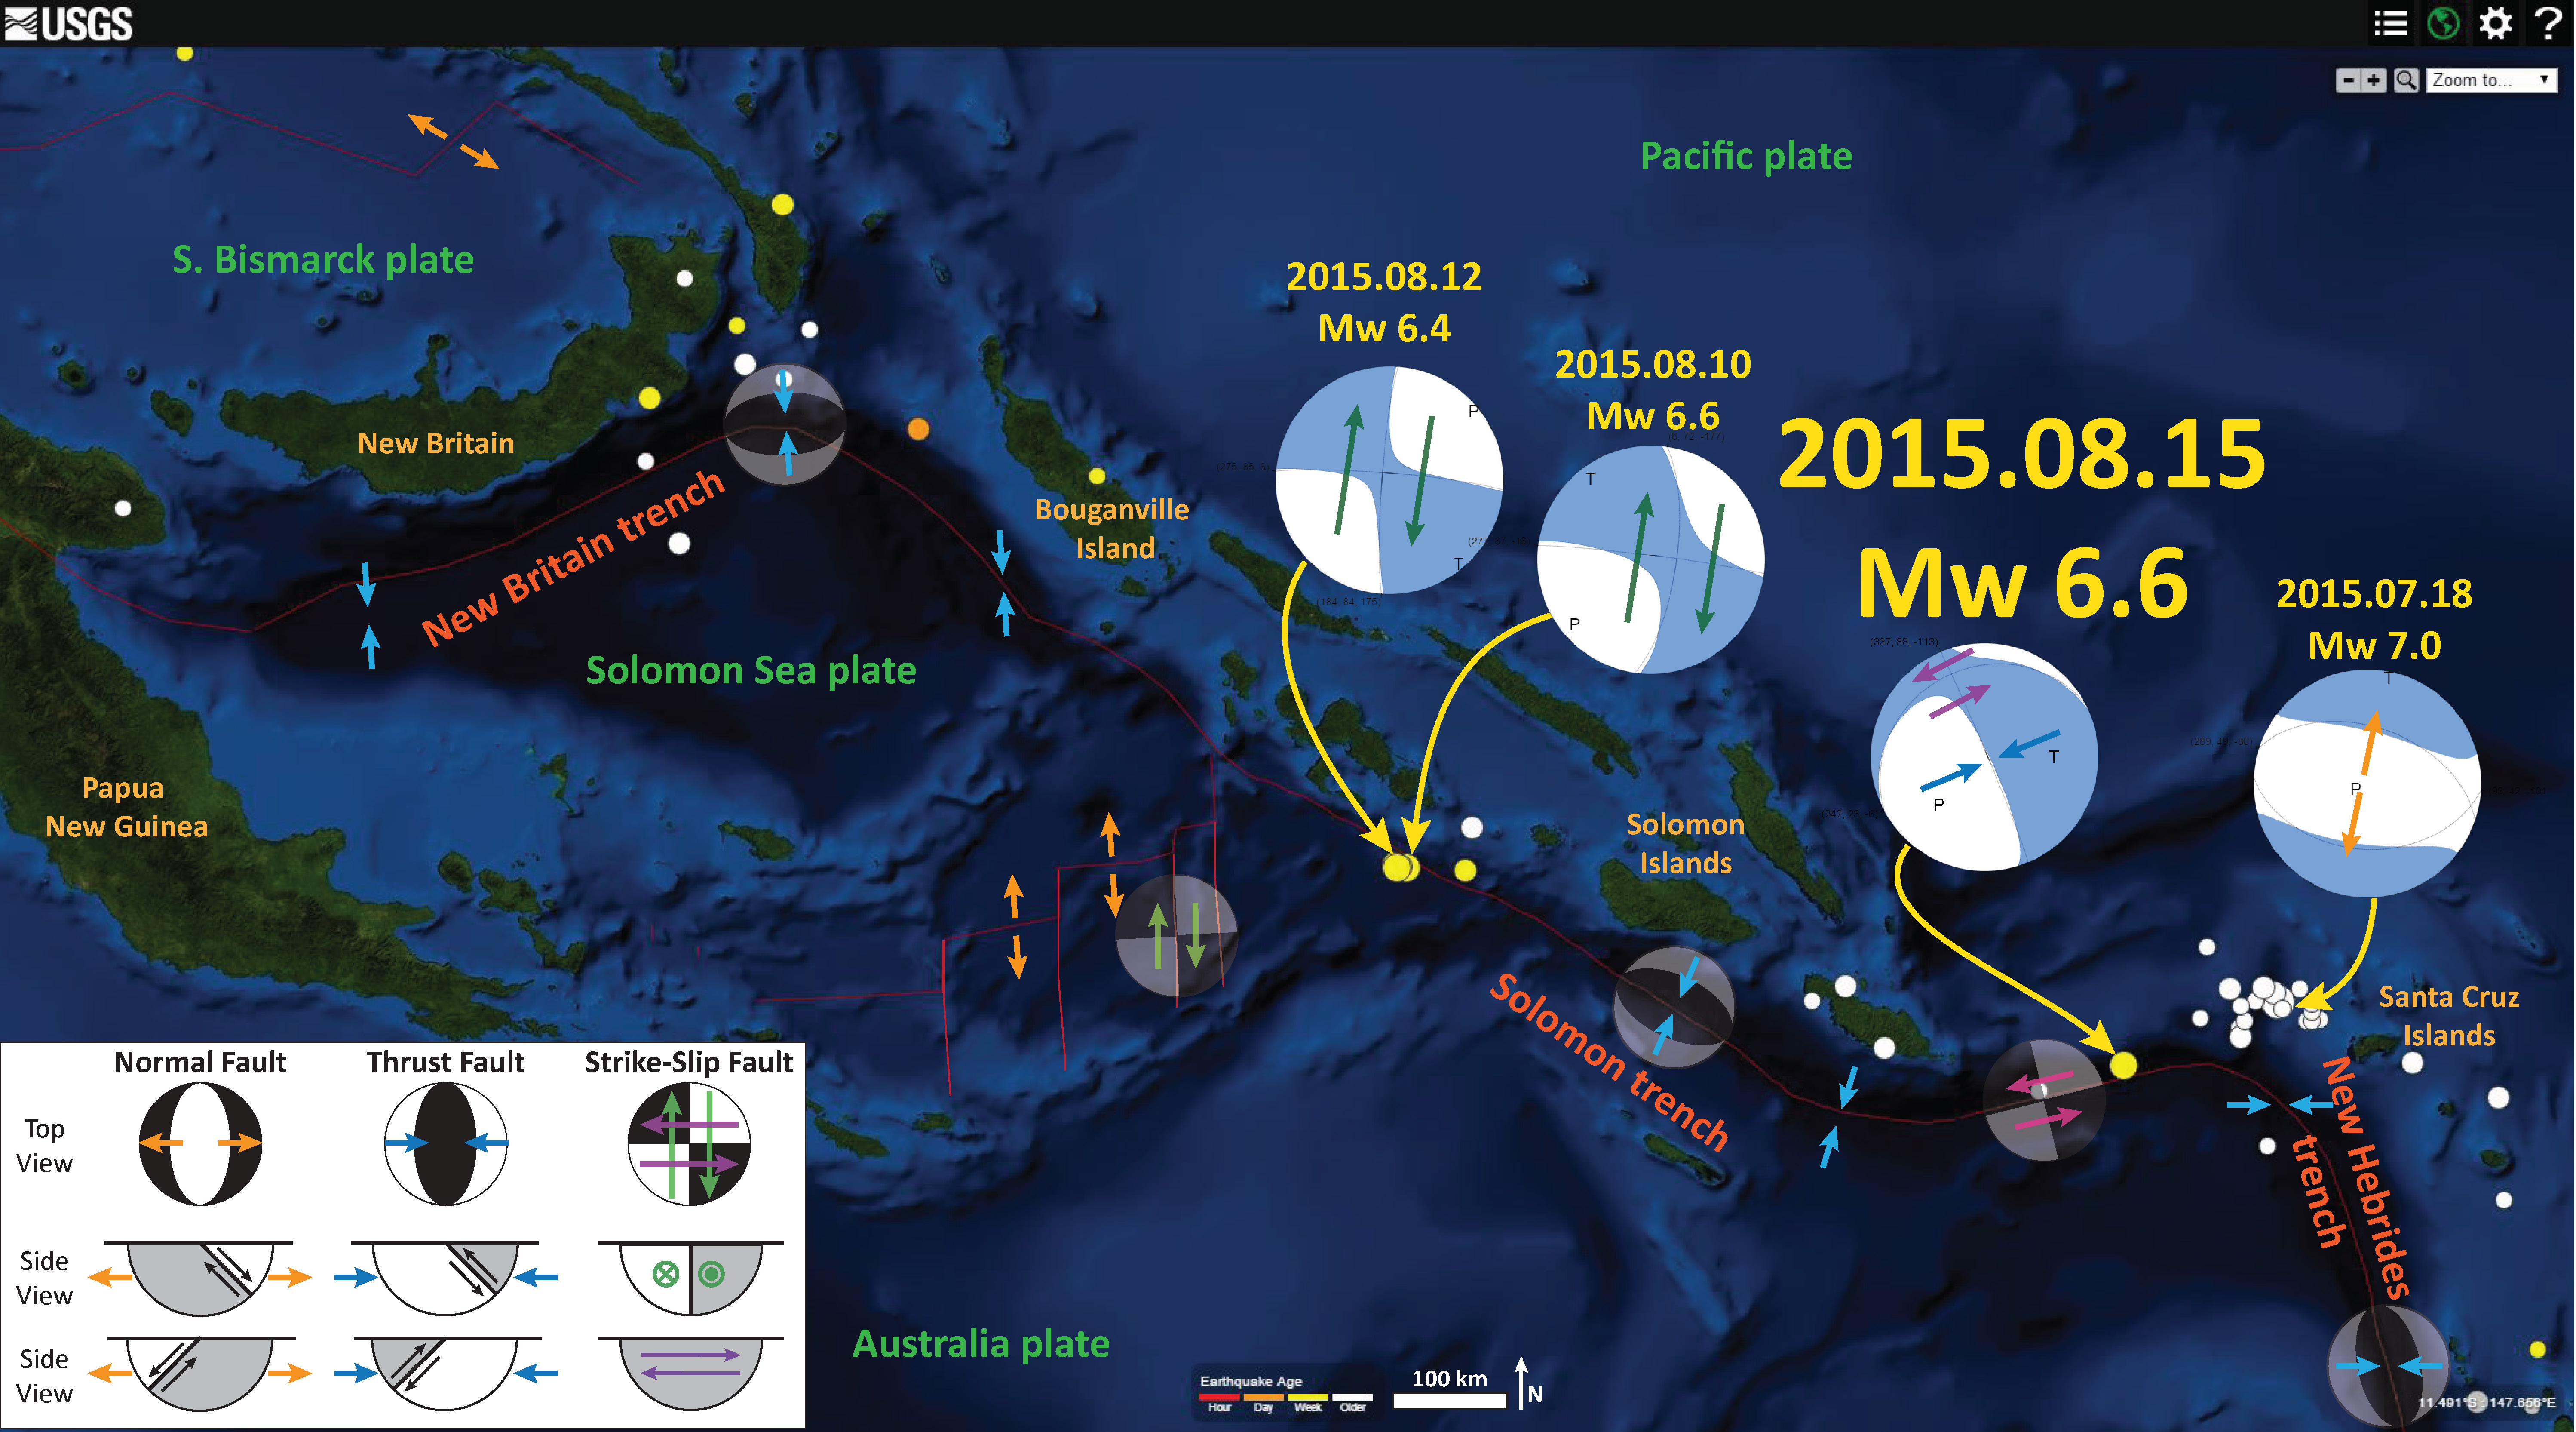
- 2015.03.29 M 7.1 New Britain
- 2015.04.25 M 7.8 Nepal
- 2015.05.05 M 7.5 New Britain
- 2015.05.07 M 7.1 Solomon Sea
- 2015.05.12 M 7.3 Nepal
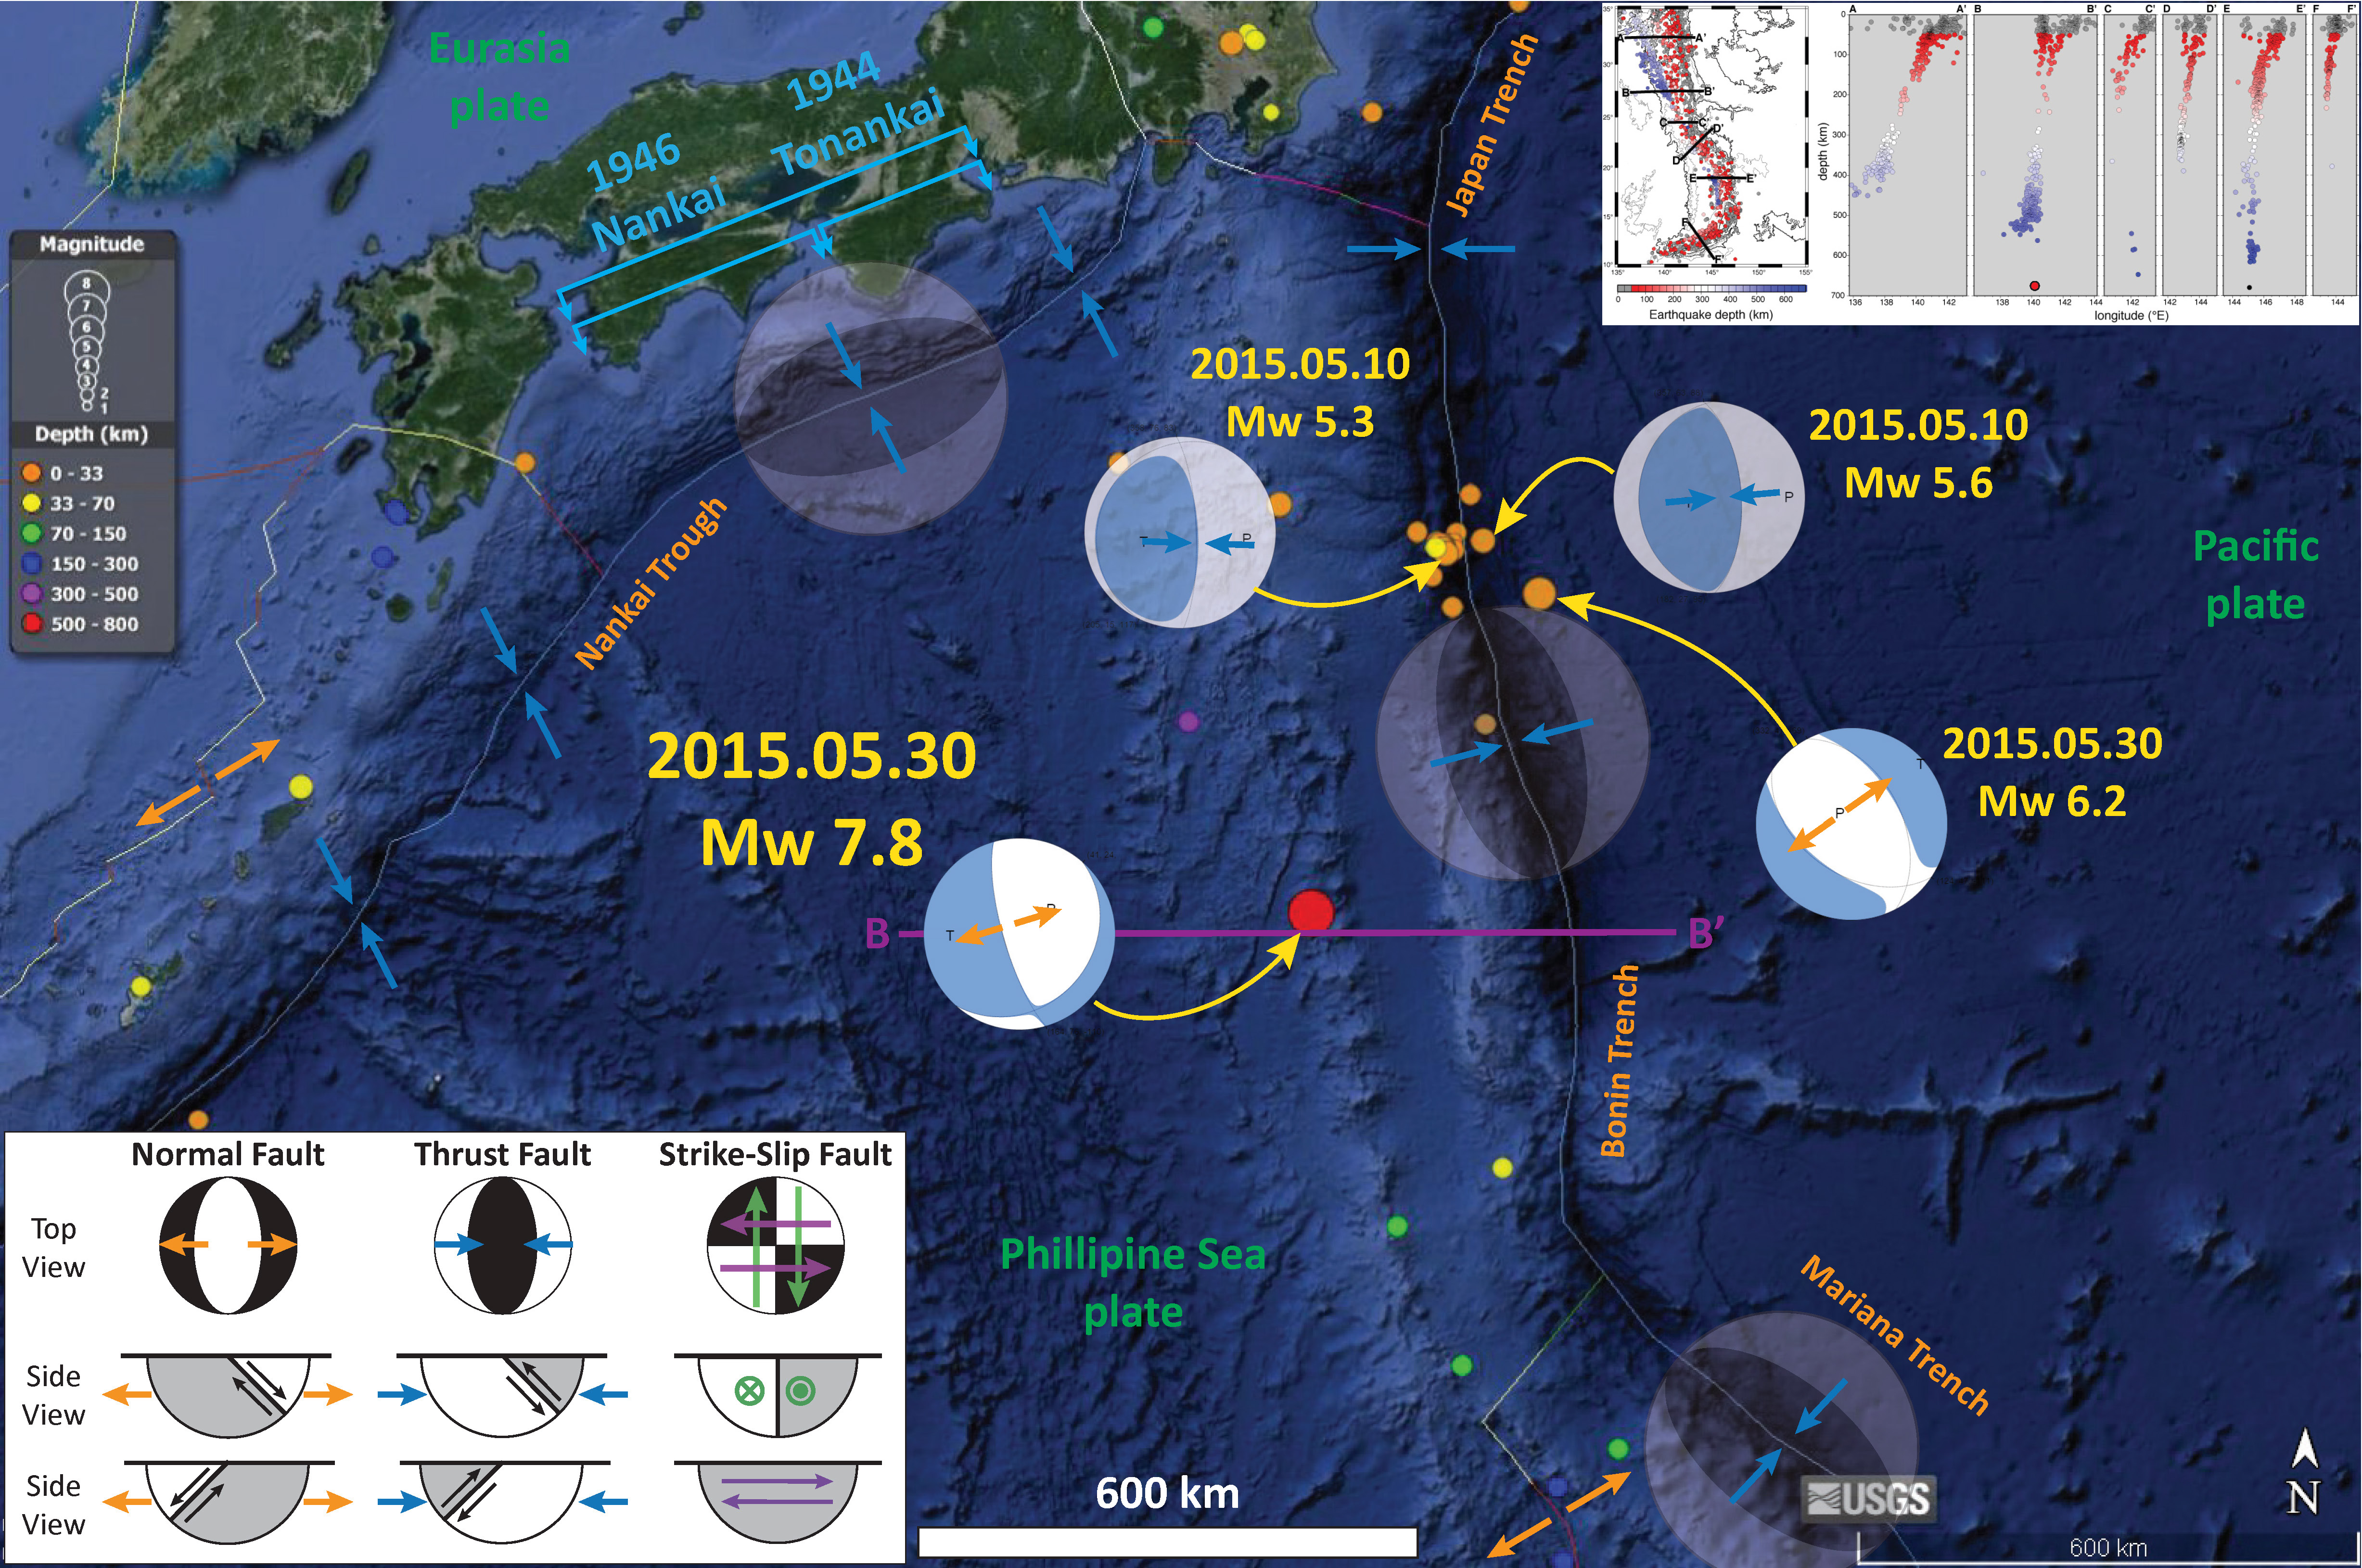
- 2015.05.30 M 7.8 Izu Bonin
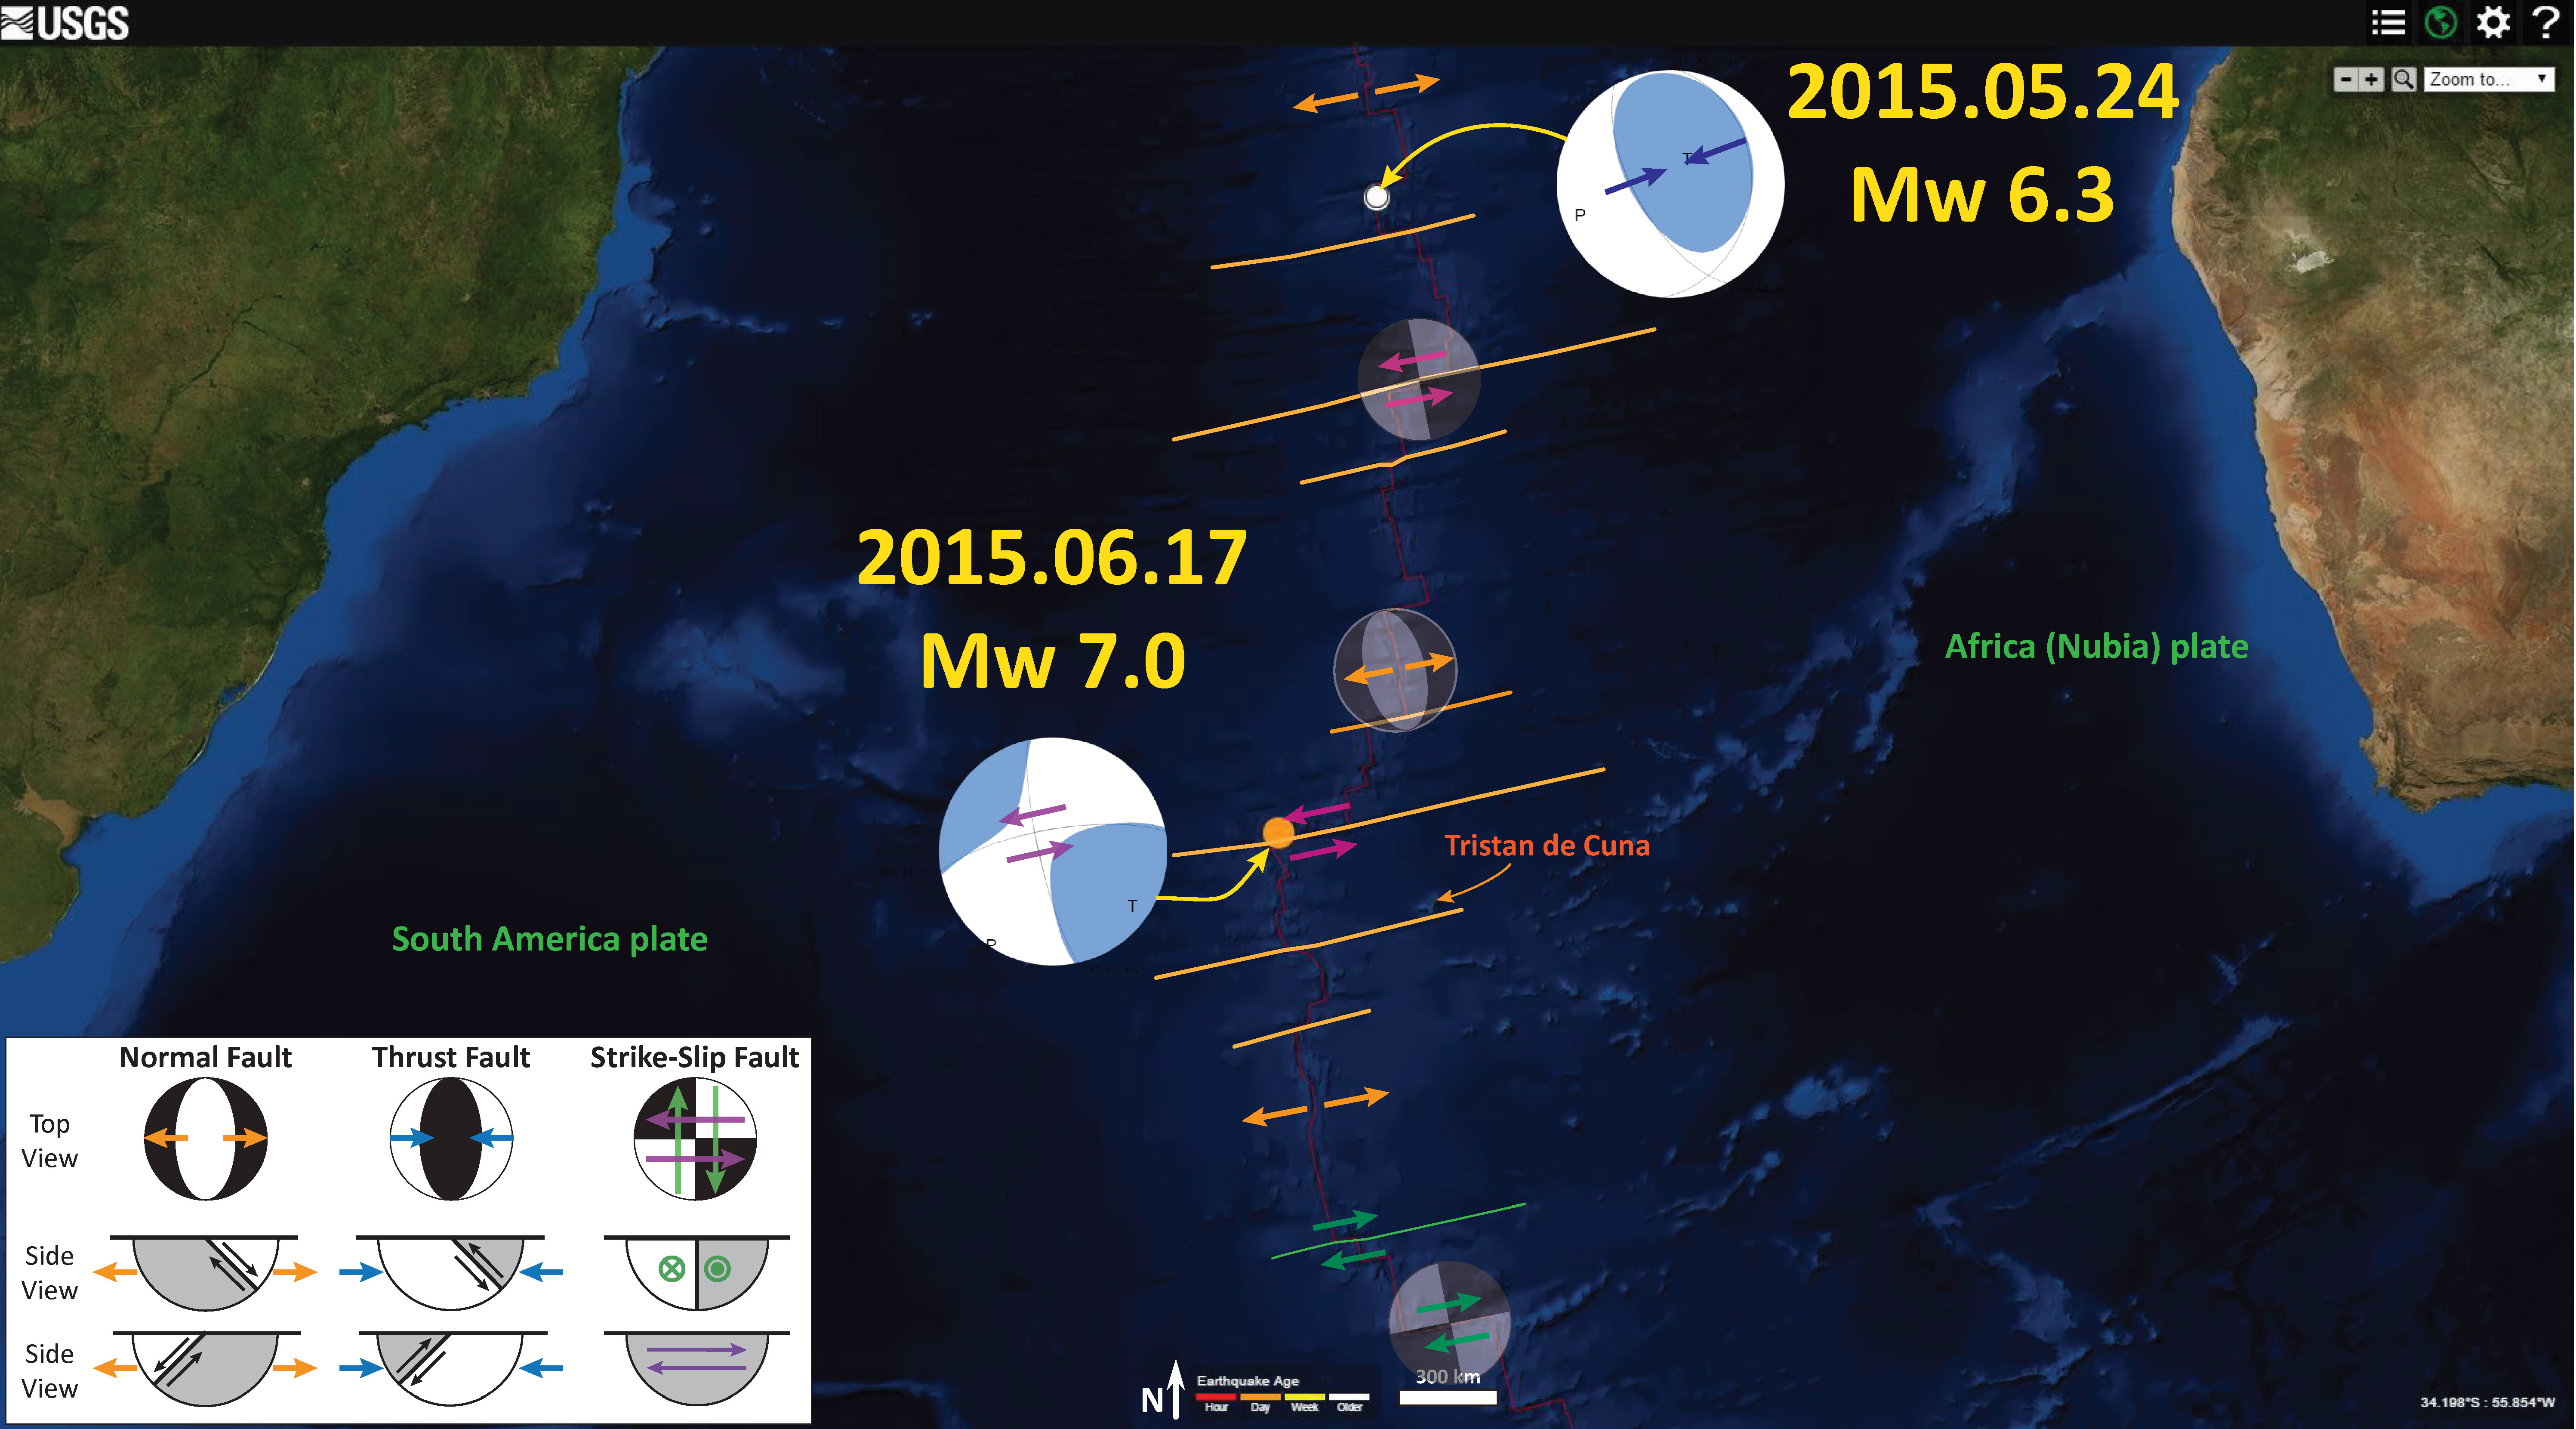
- 2015.06.17 M 7.0 southern Mid Atlantic Ridge
- 2015.07.18 M 7.0 Santa Cruz Islands
- 2015.07.27 M 7.0 New Guinea
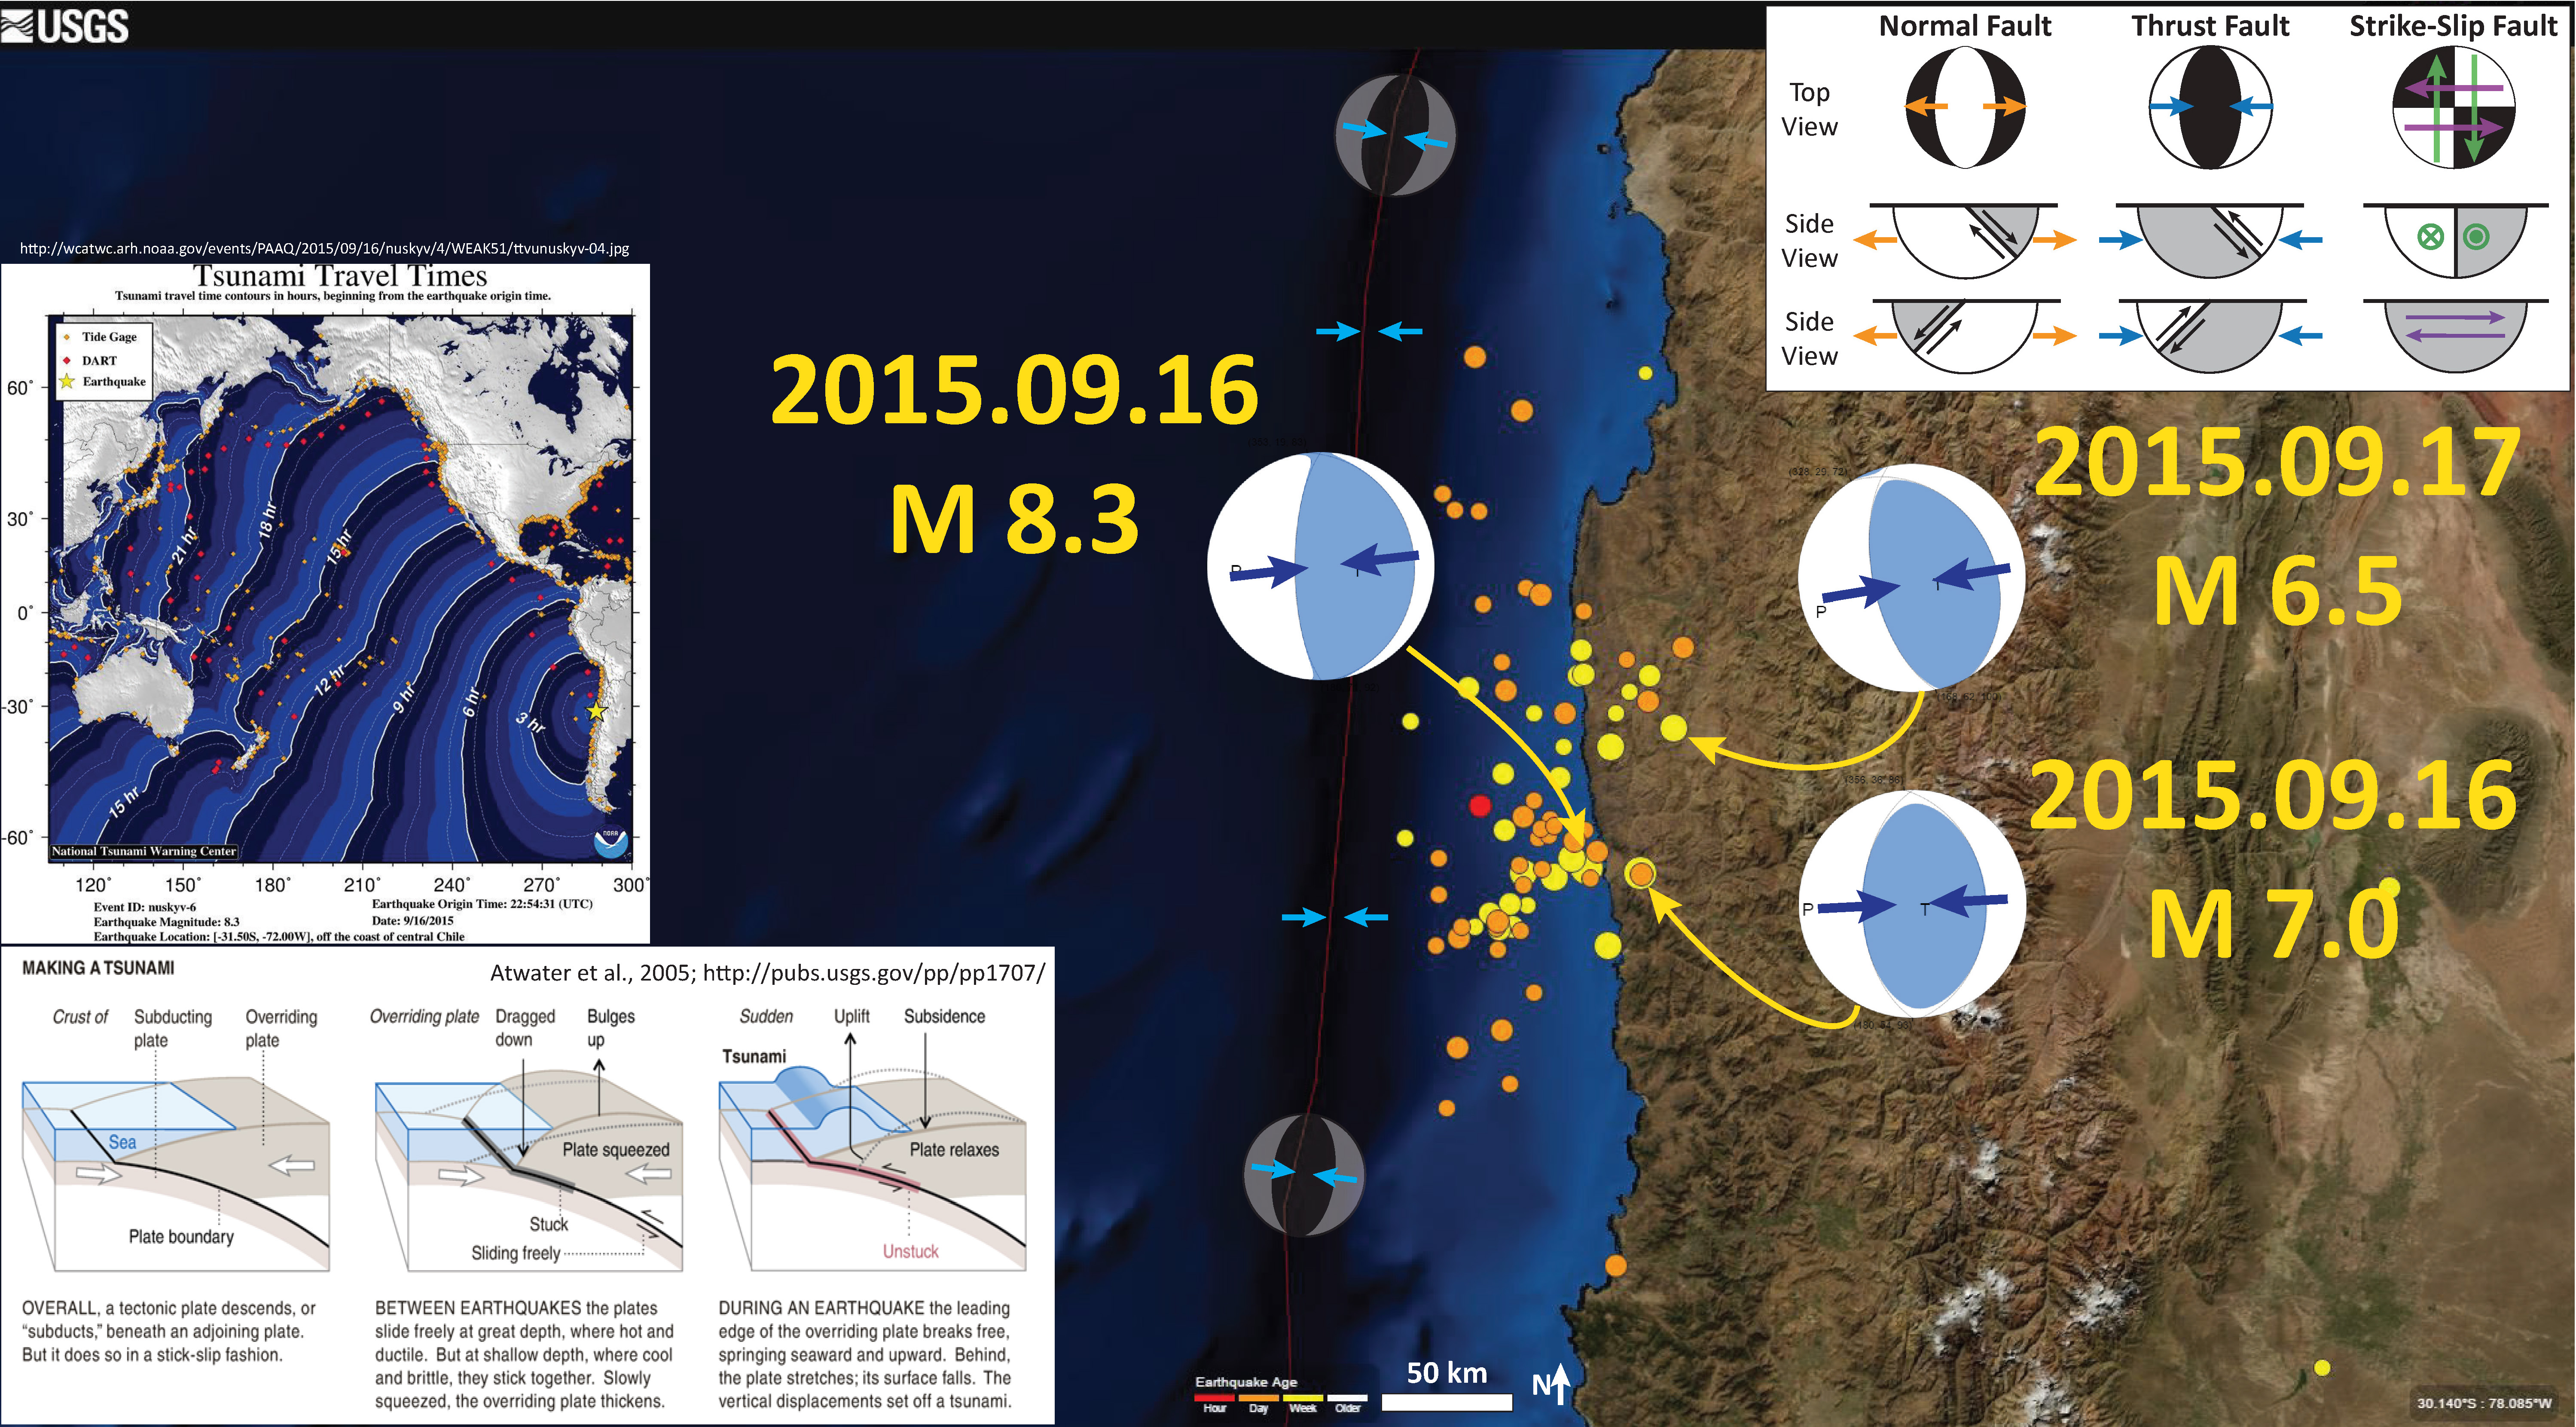
- 2015.09.16 M 8.3 Illapel, Chile
- 2015.09.16 M 7.0 Illapel, Chile
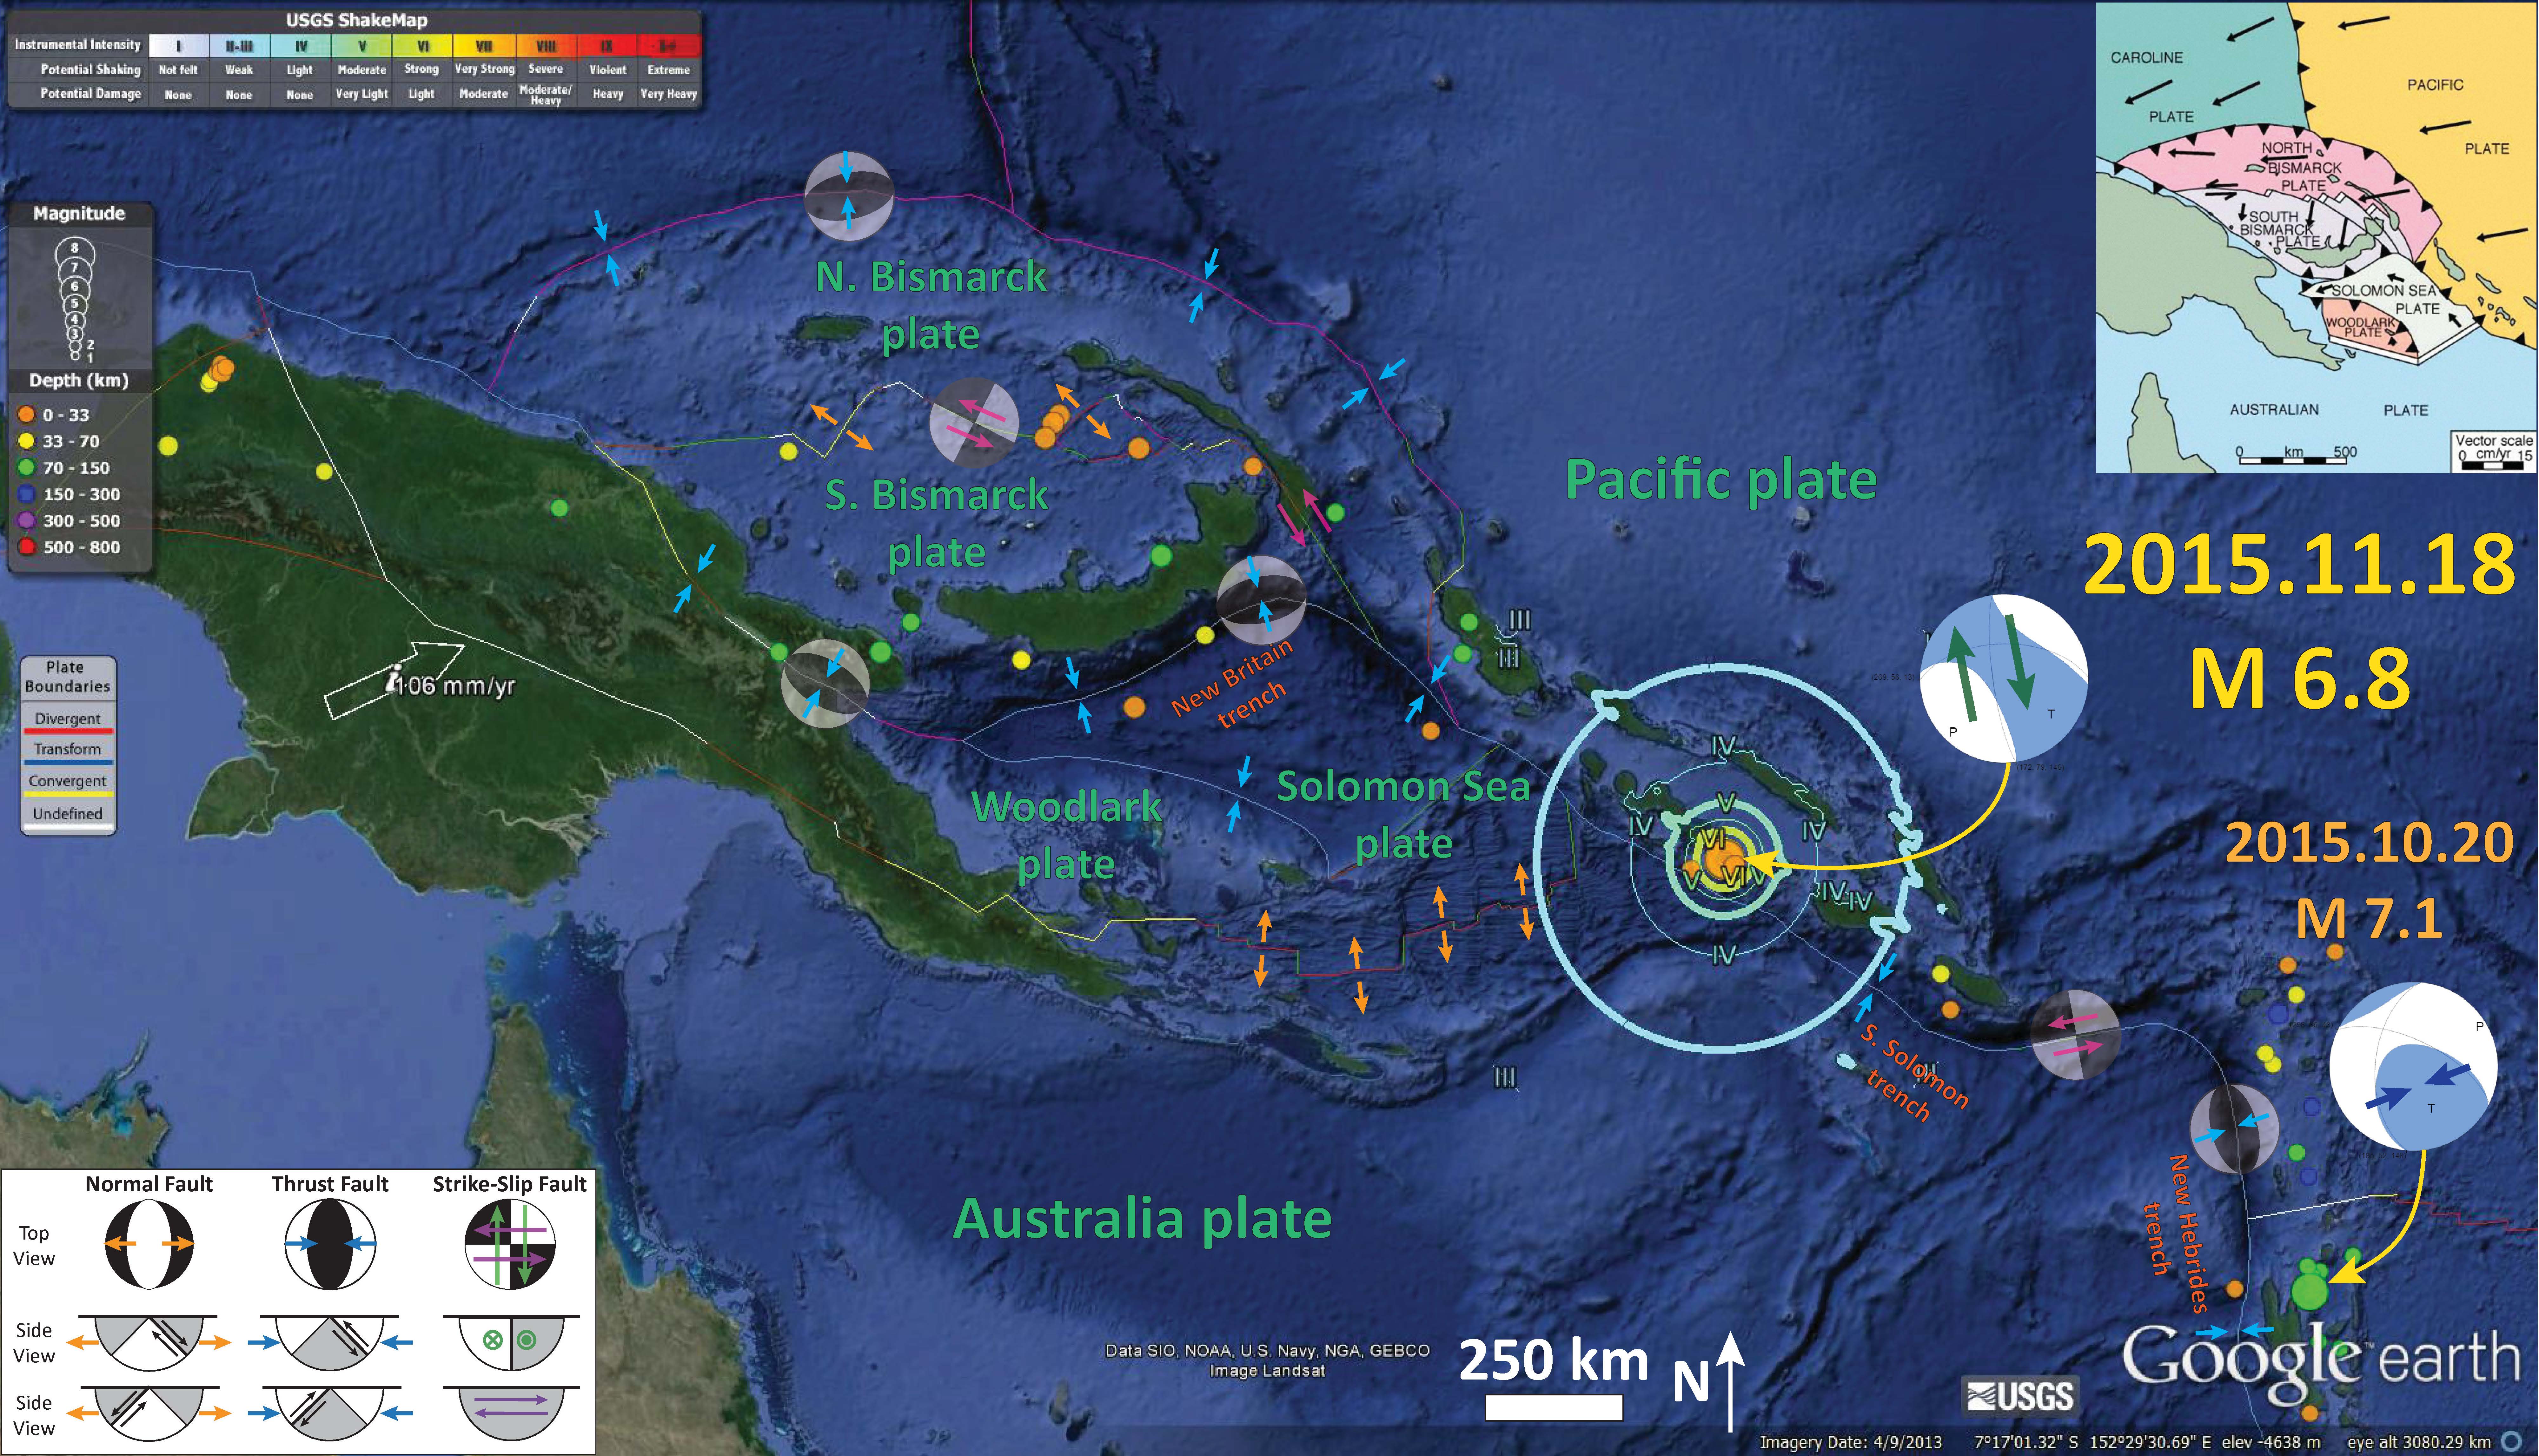
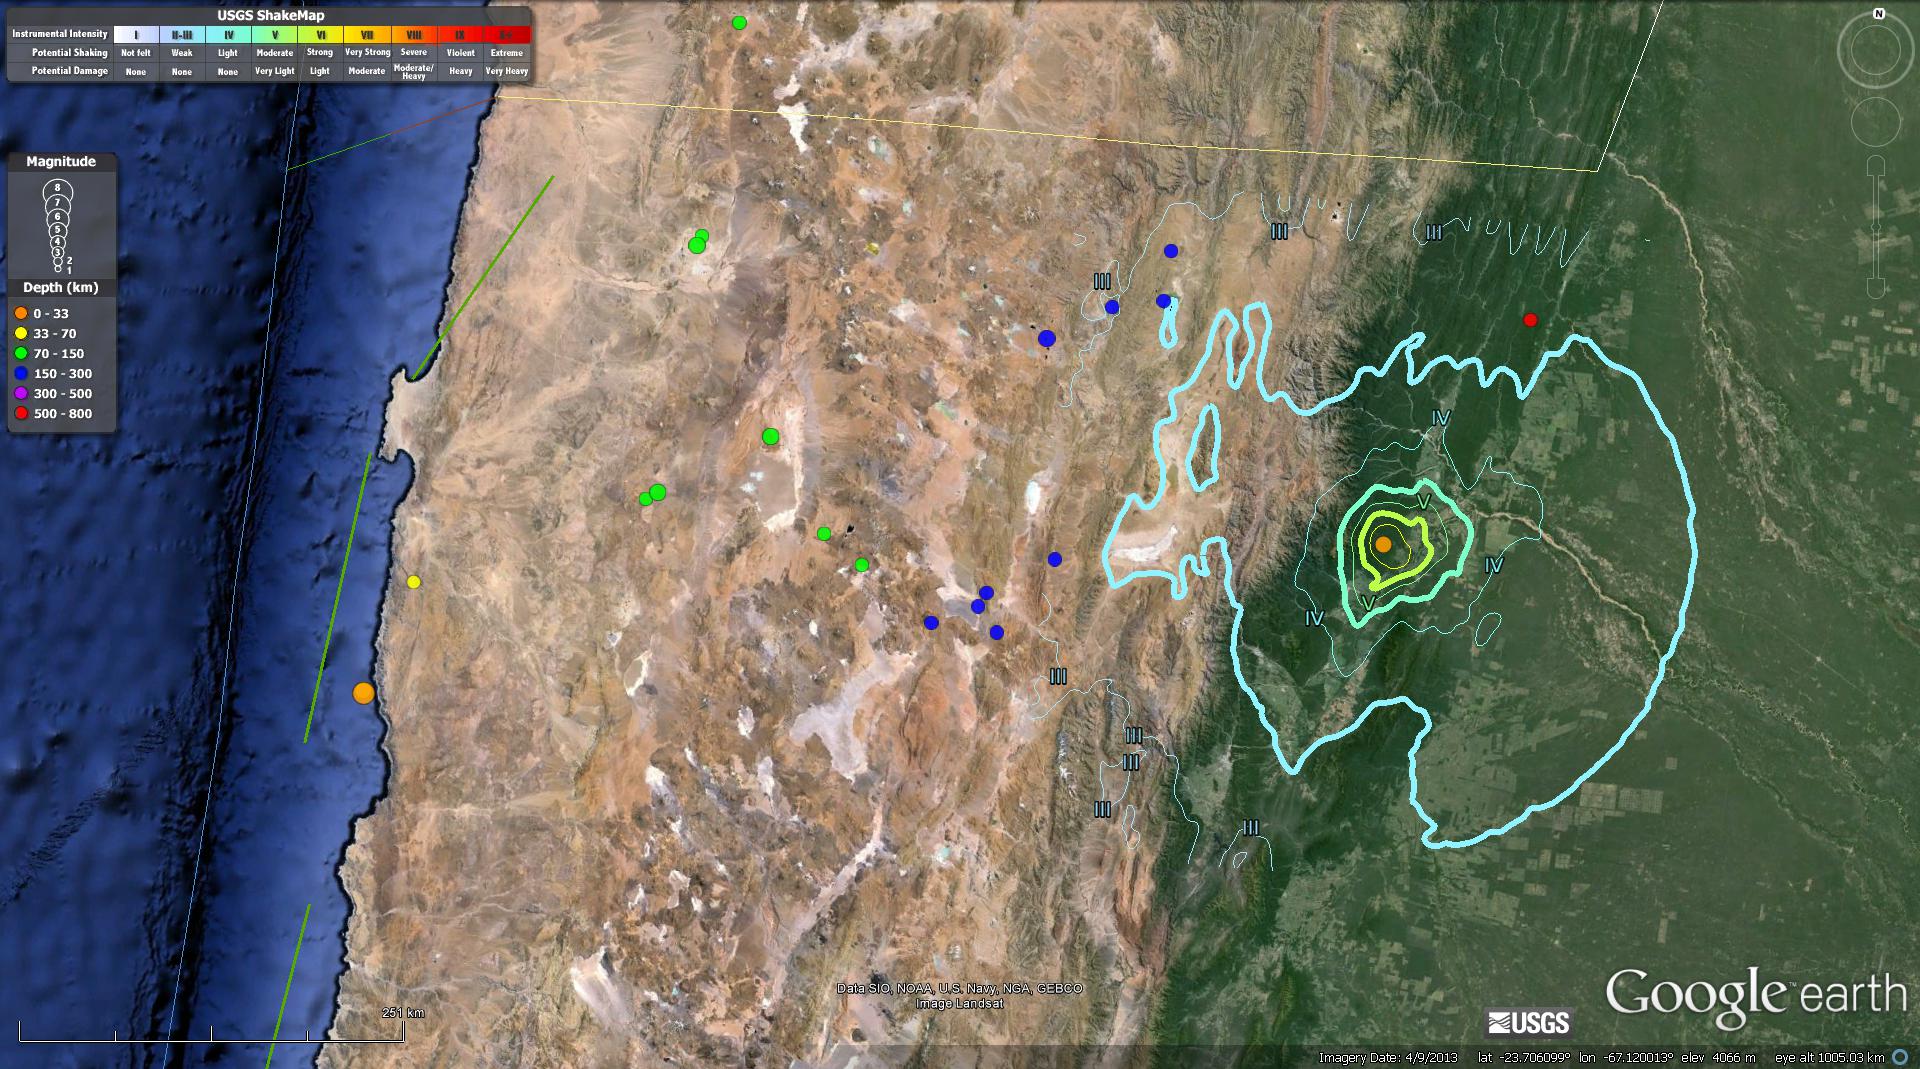
- 2015.10.20 M 7.1 Vanuatu
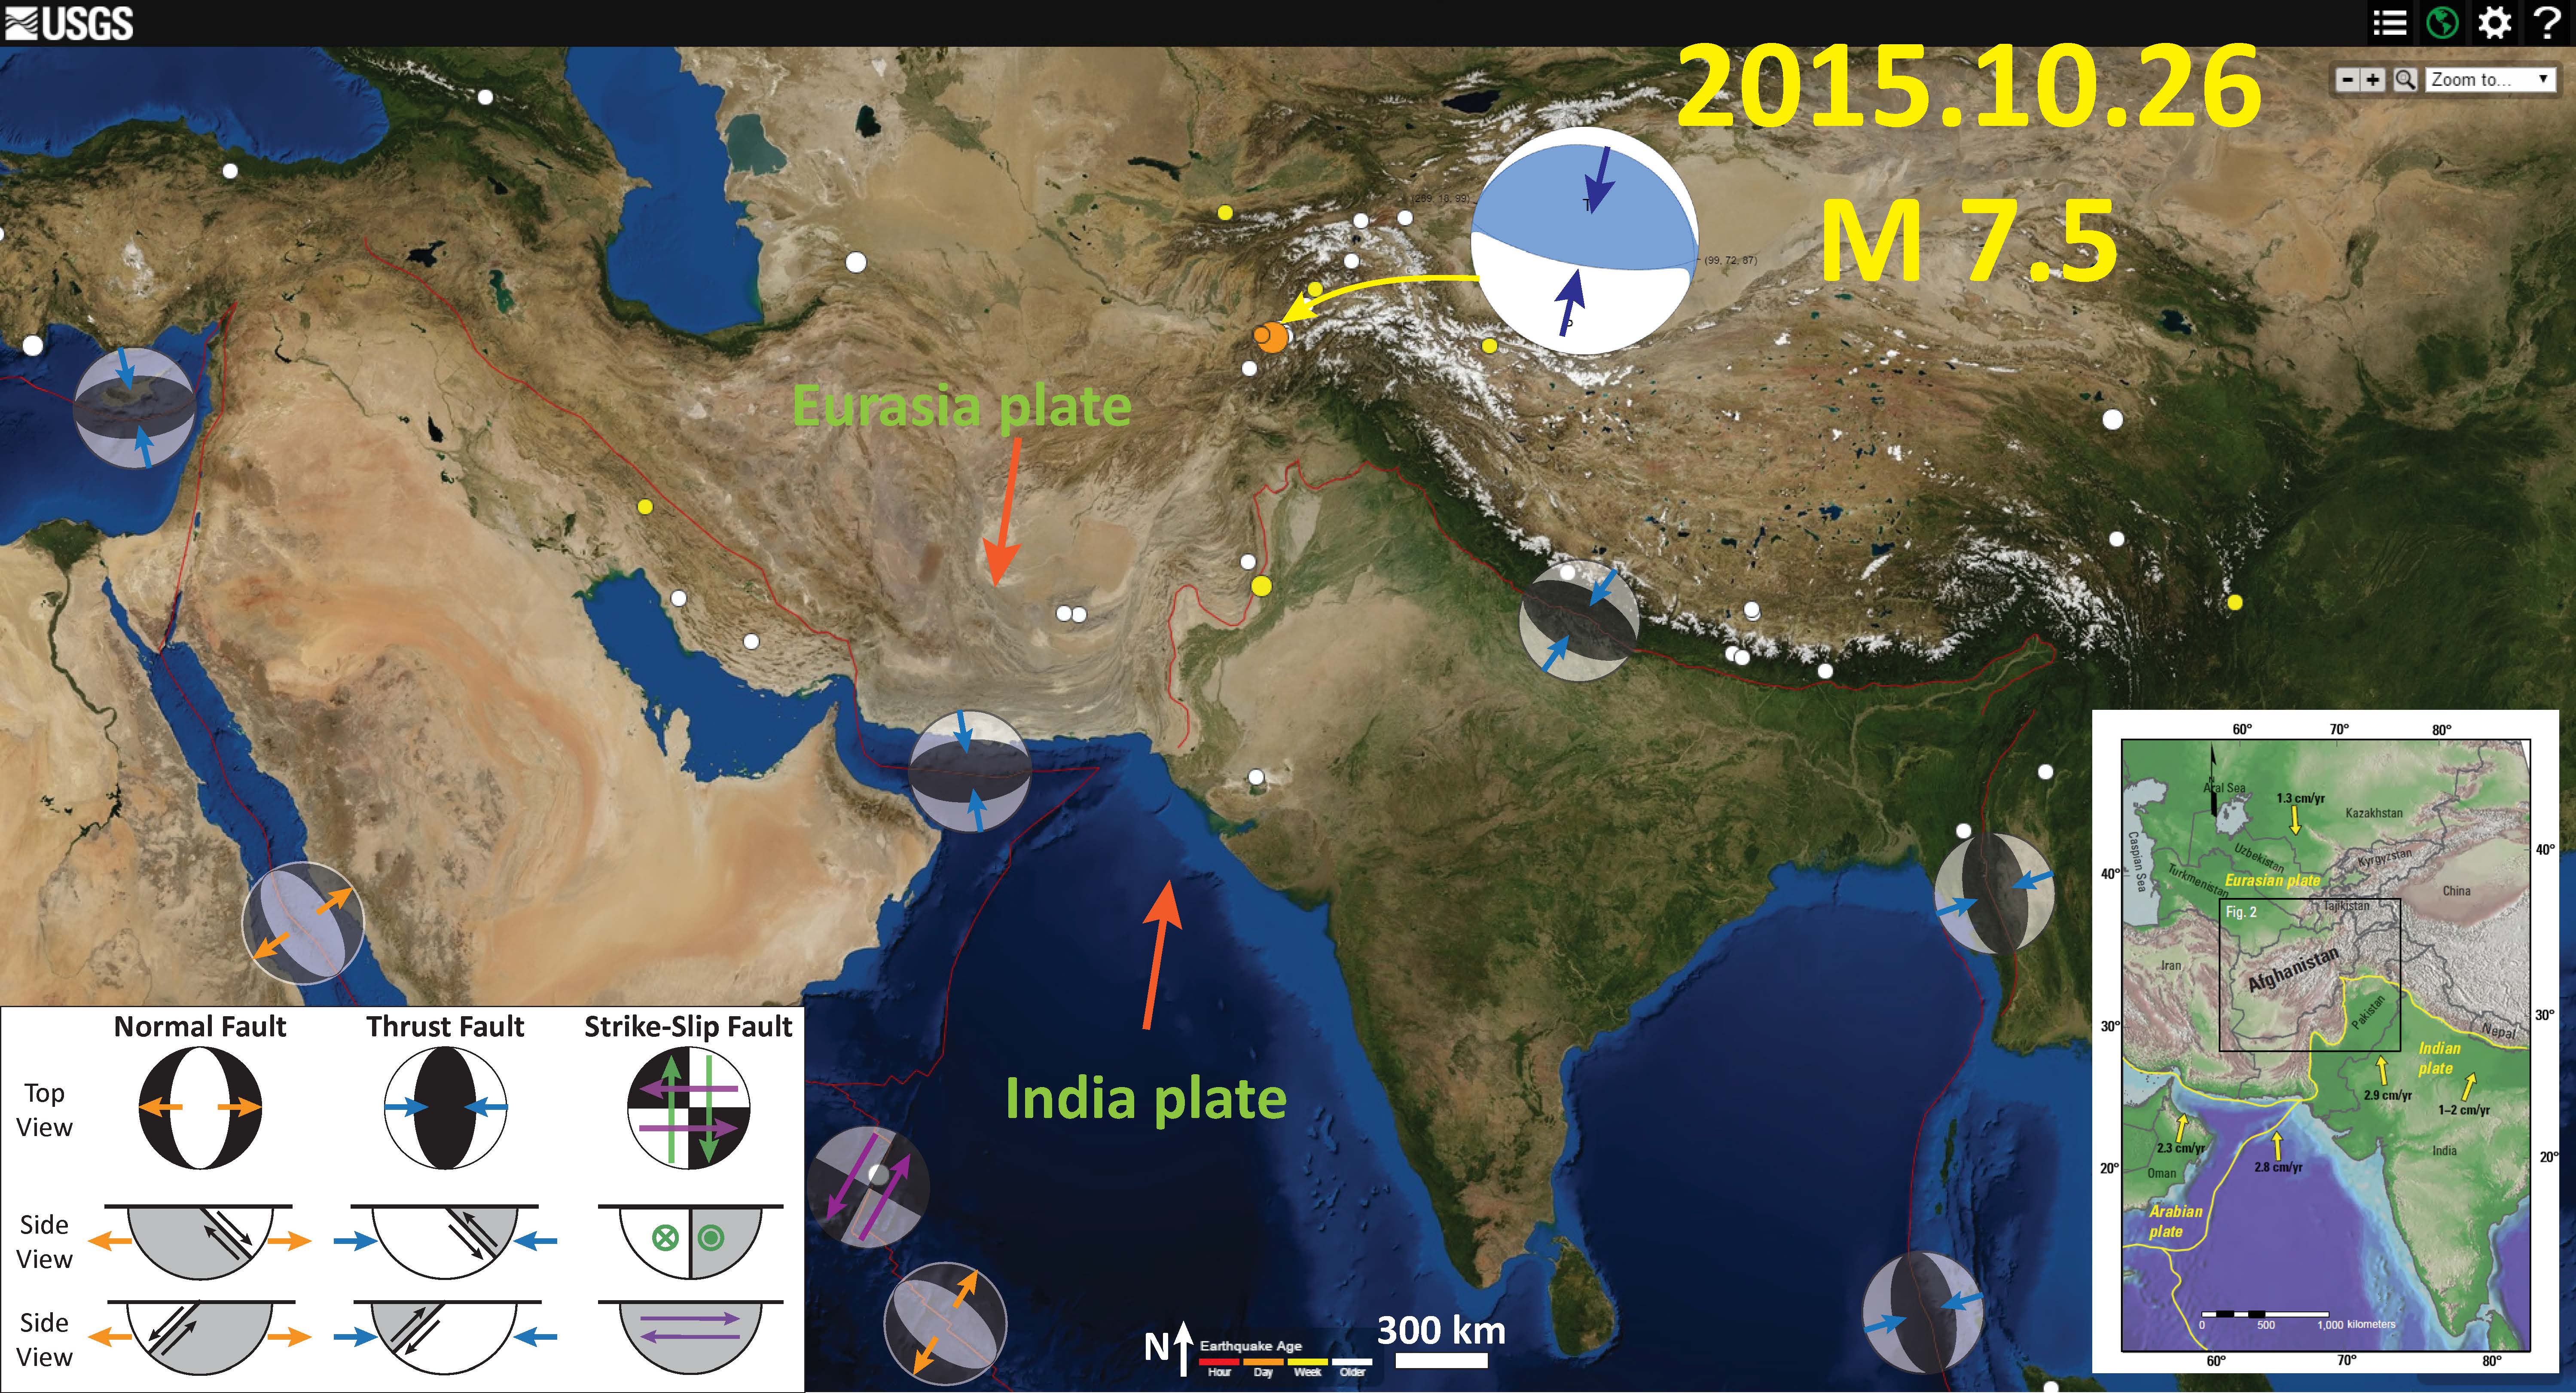
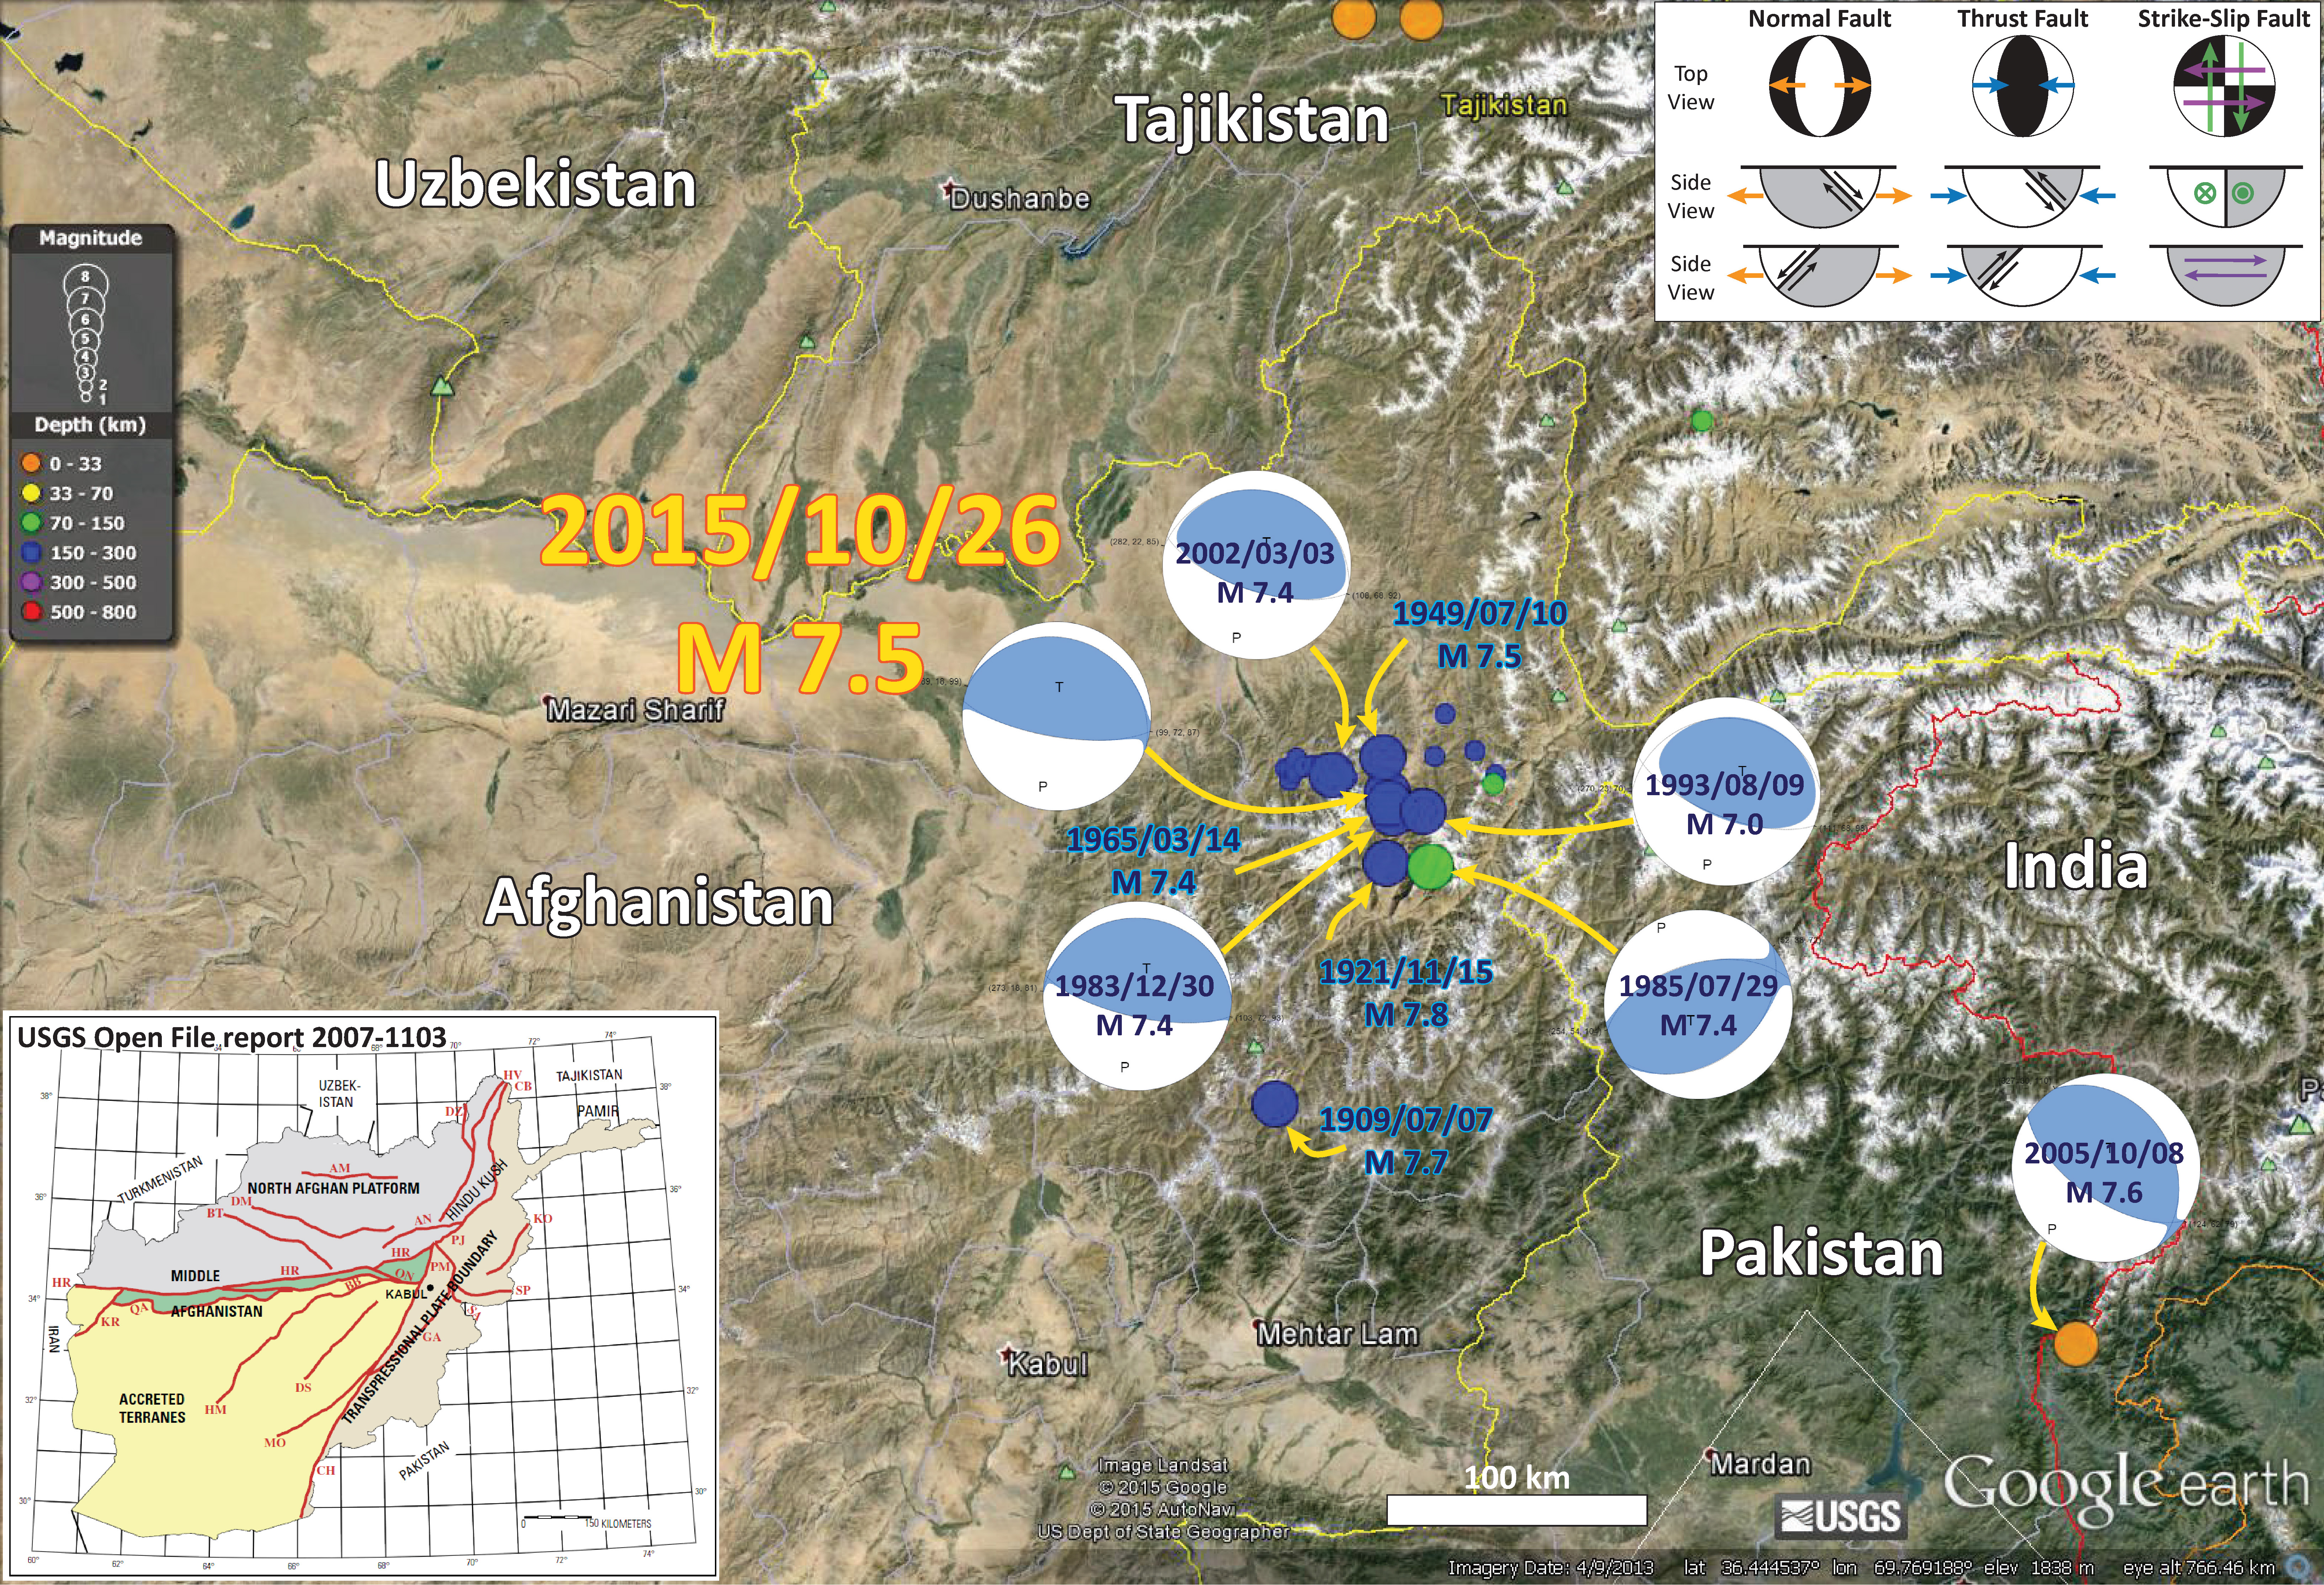
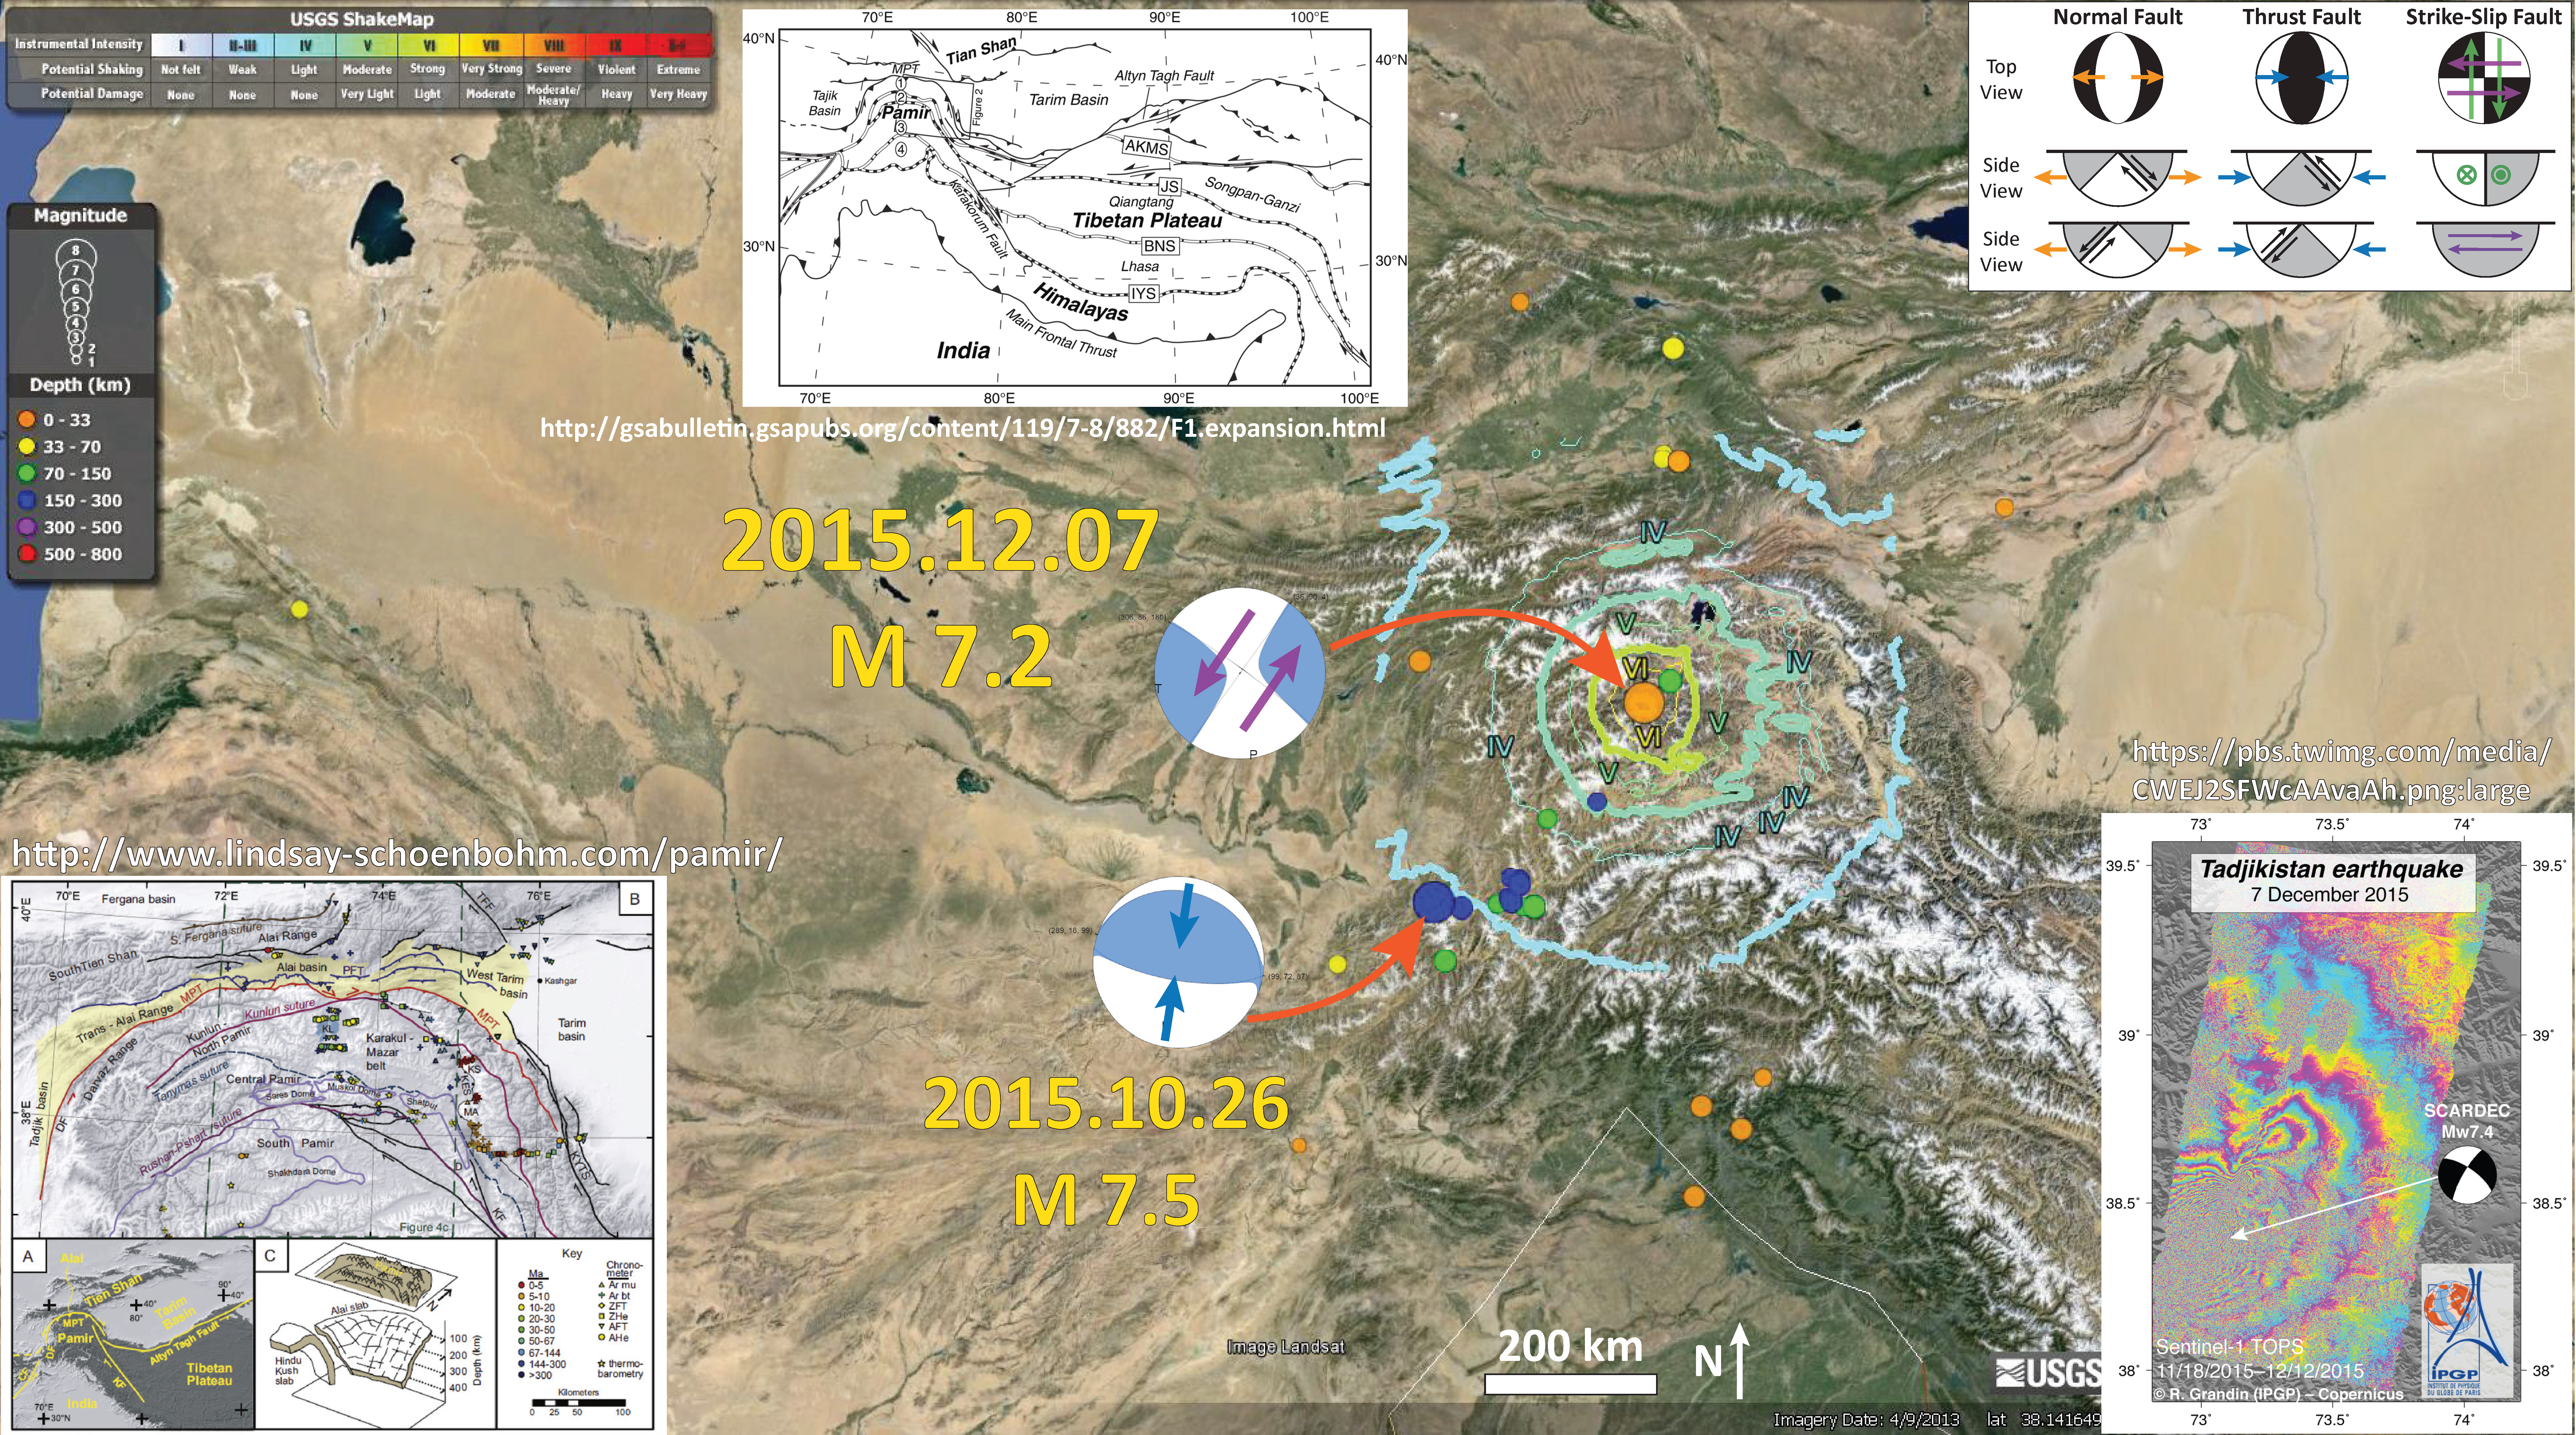
- 2015.10.26 M 7.5 Afghanistan
- 2015.11.18 M 7.0 Solomon Islands
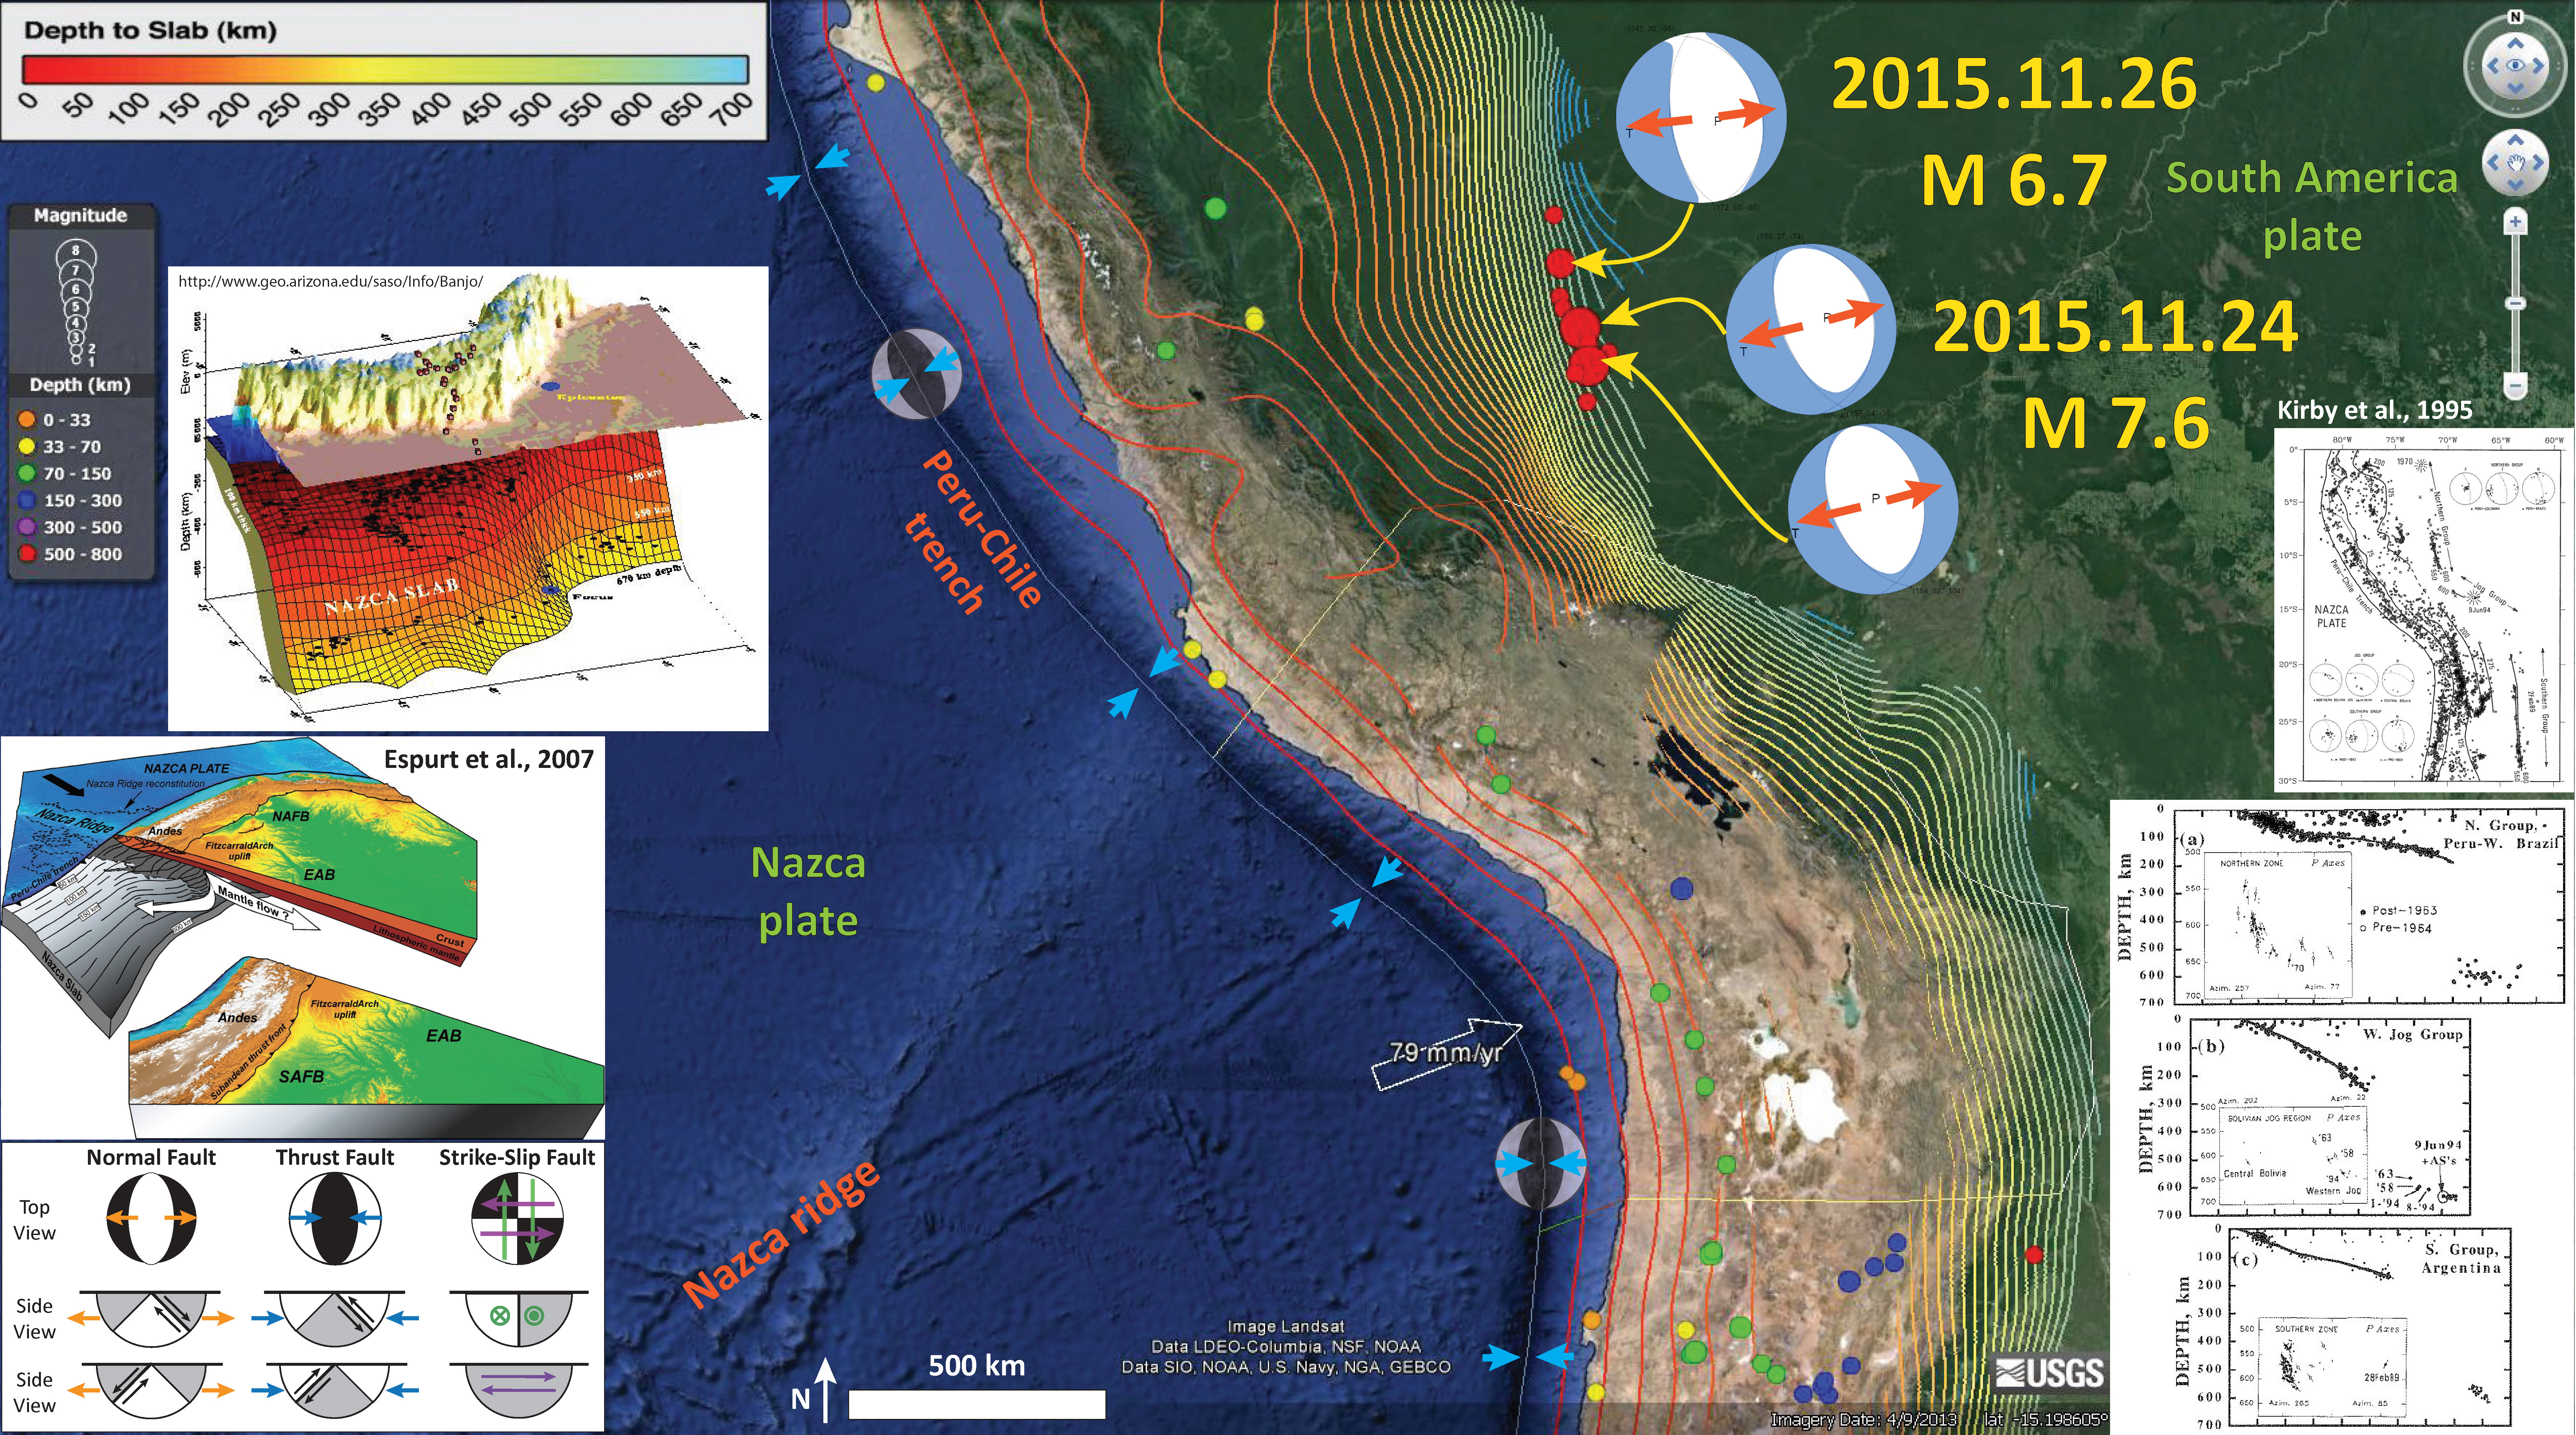
- 2015.11.24 M 7.6 Peru
- 2015.11.24 M 7.6 Argentina/Brazil
- 2015.12.04 M 7.1 Southeast Indian Ridge
- 2015.12.07 M 7.2 Tajikistan
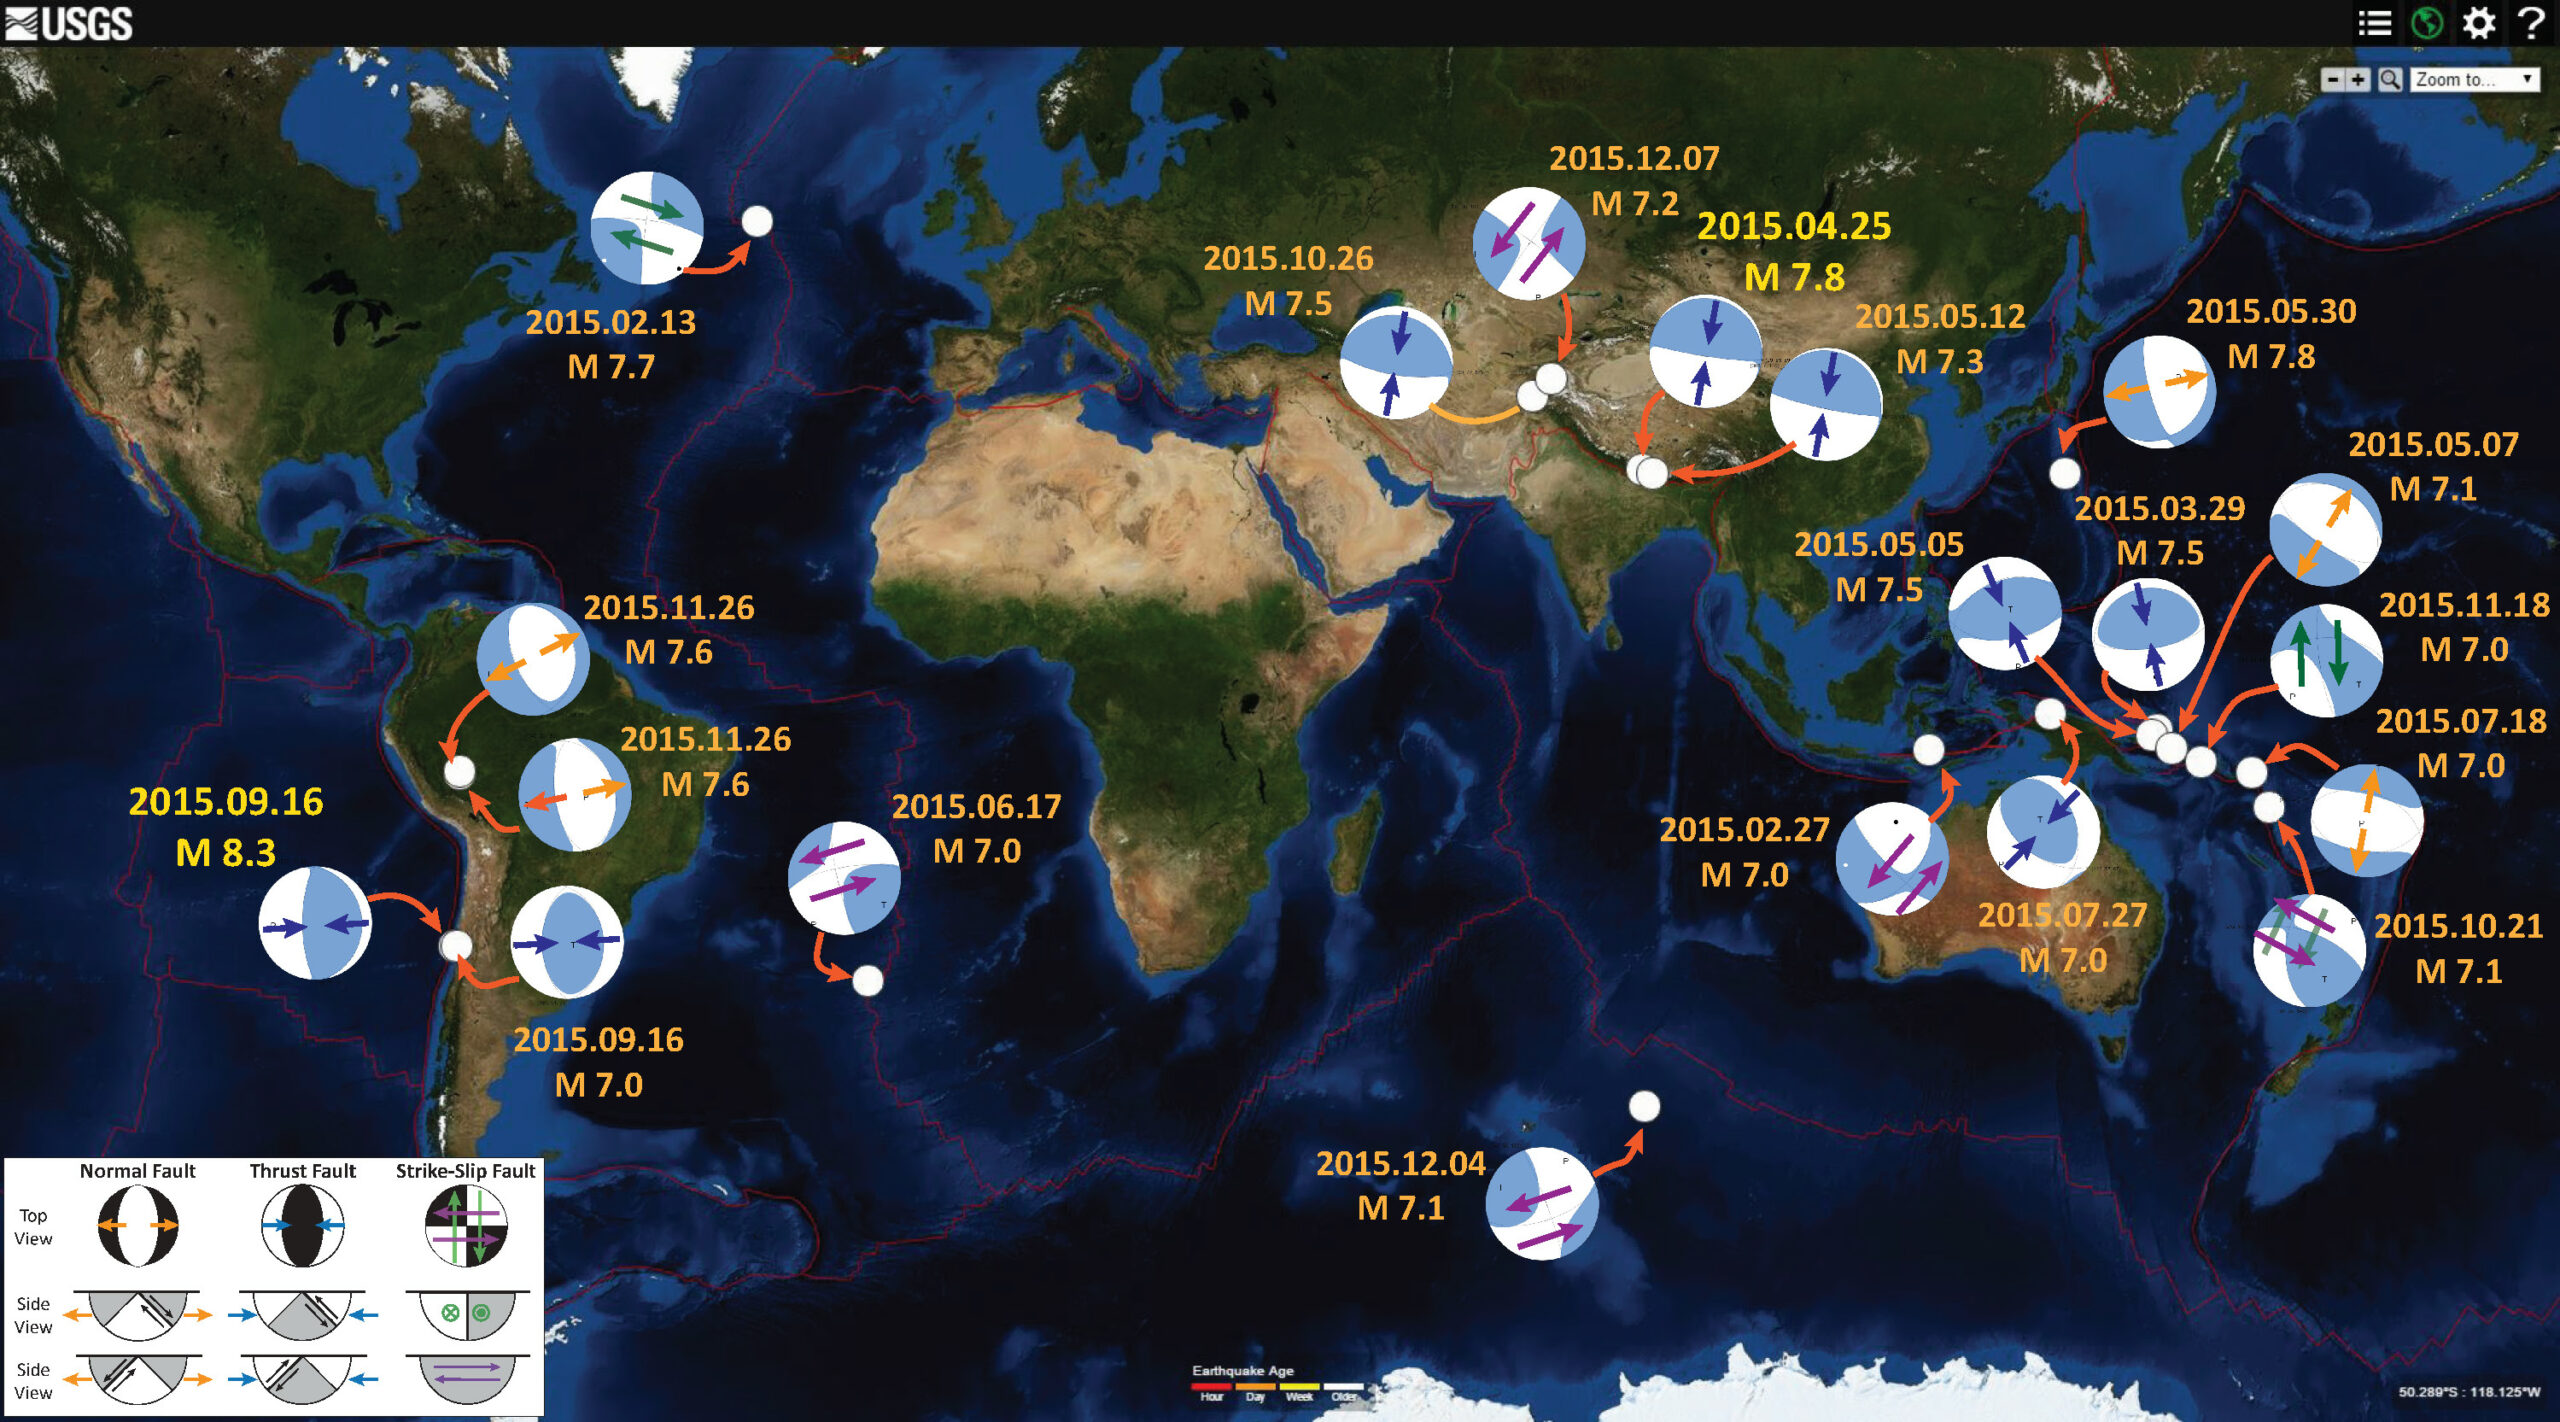
Annual Summary Poster
Here is the map where I show the epicenters as white circles. I also plot the USGS moment tensors for each earthquake, with arrows showing the sense of motion for each earthquake.
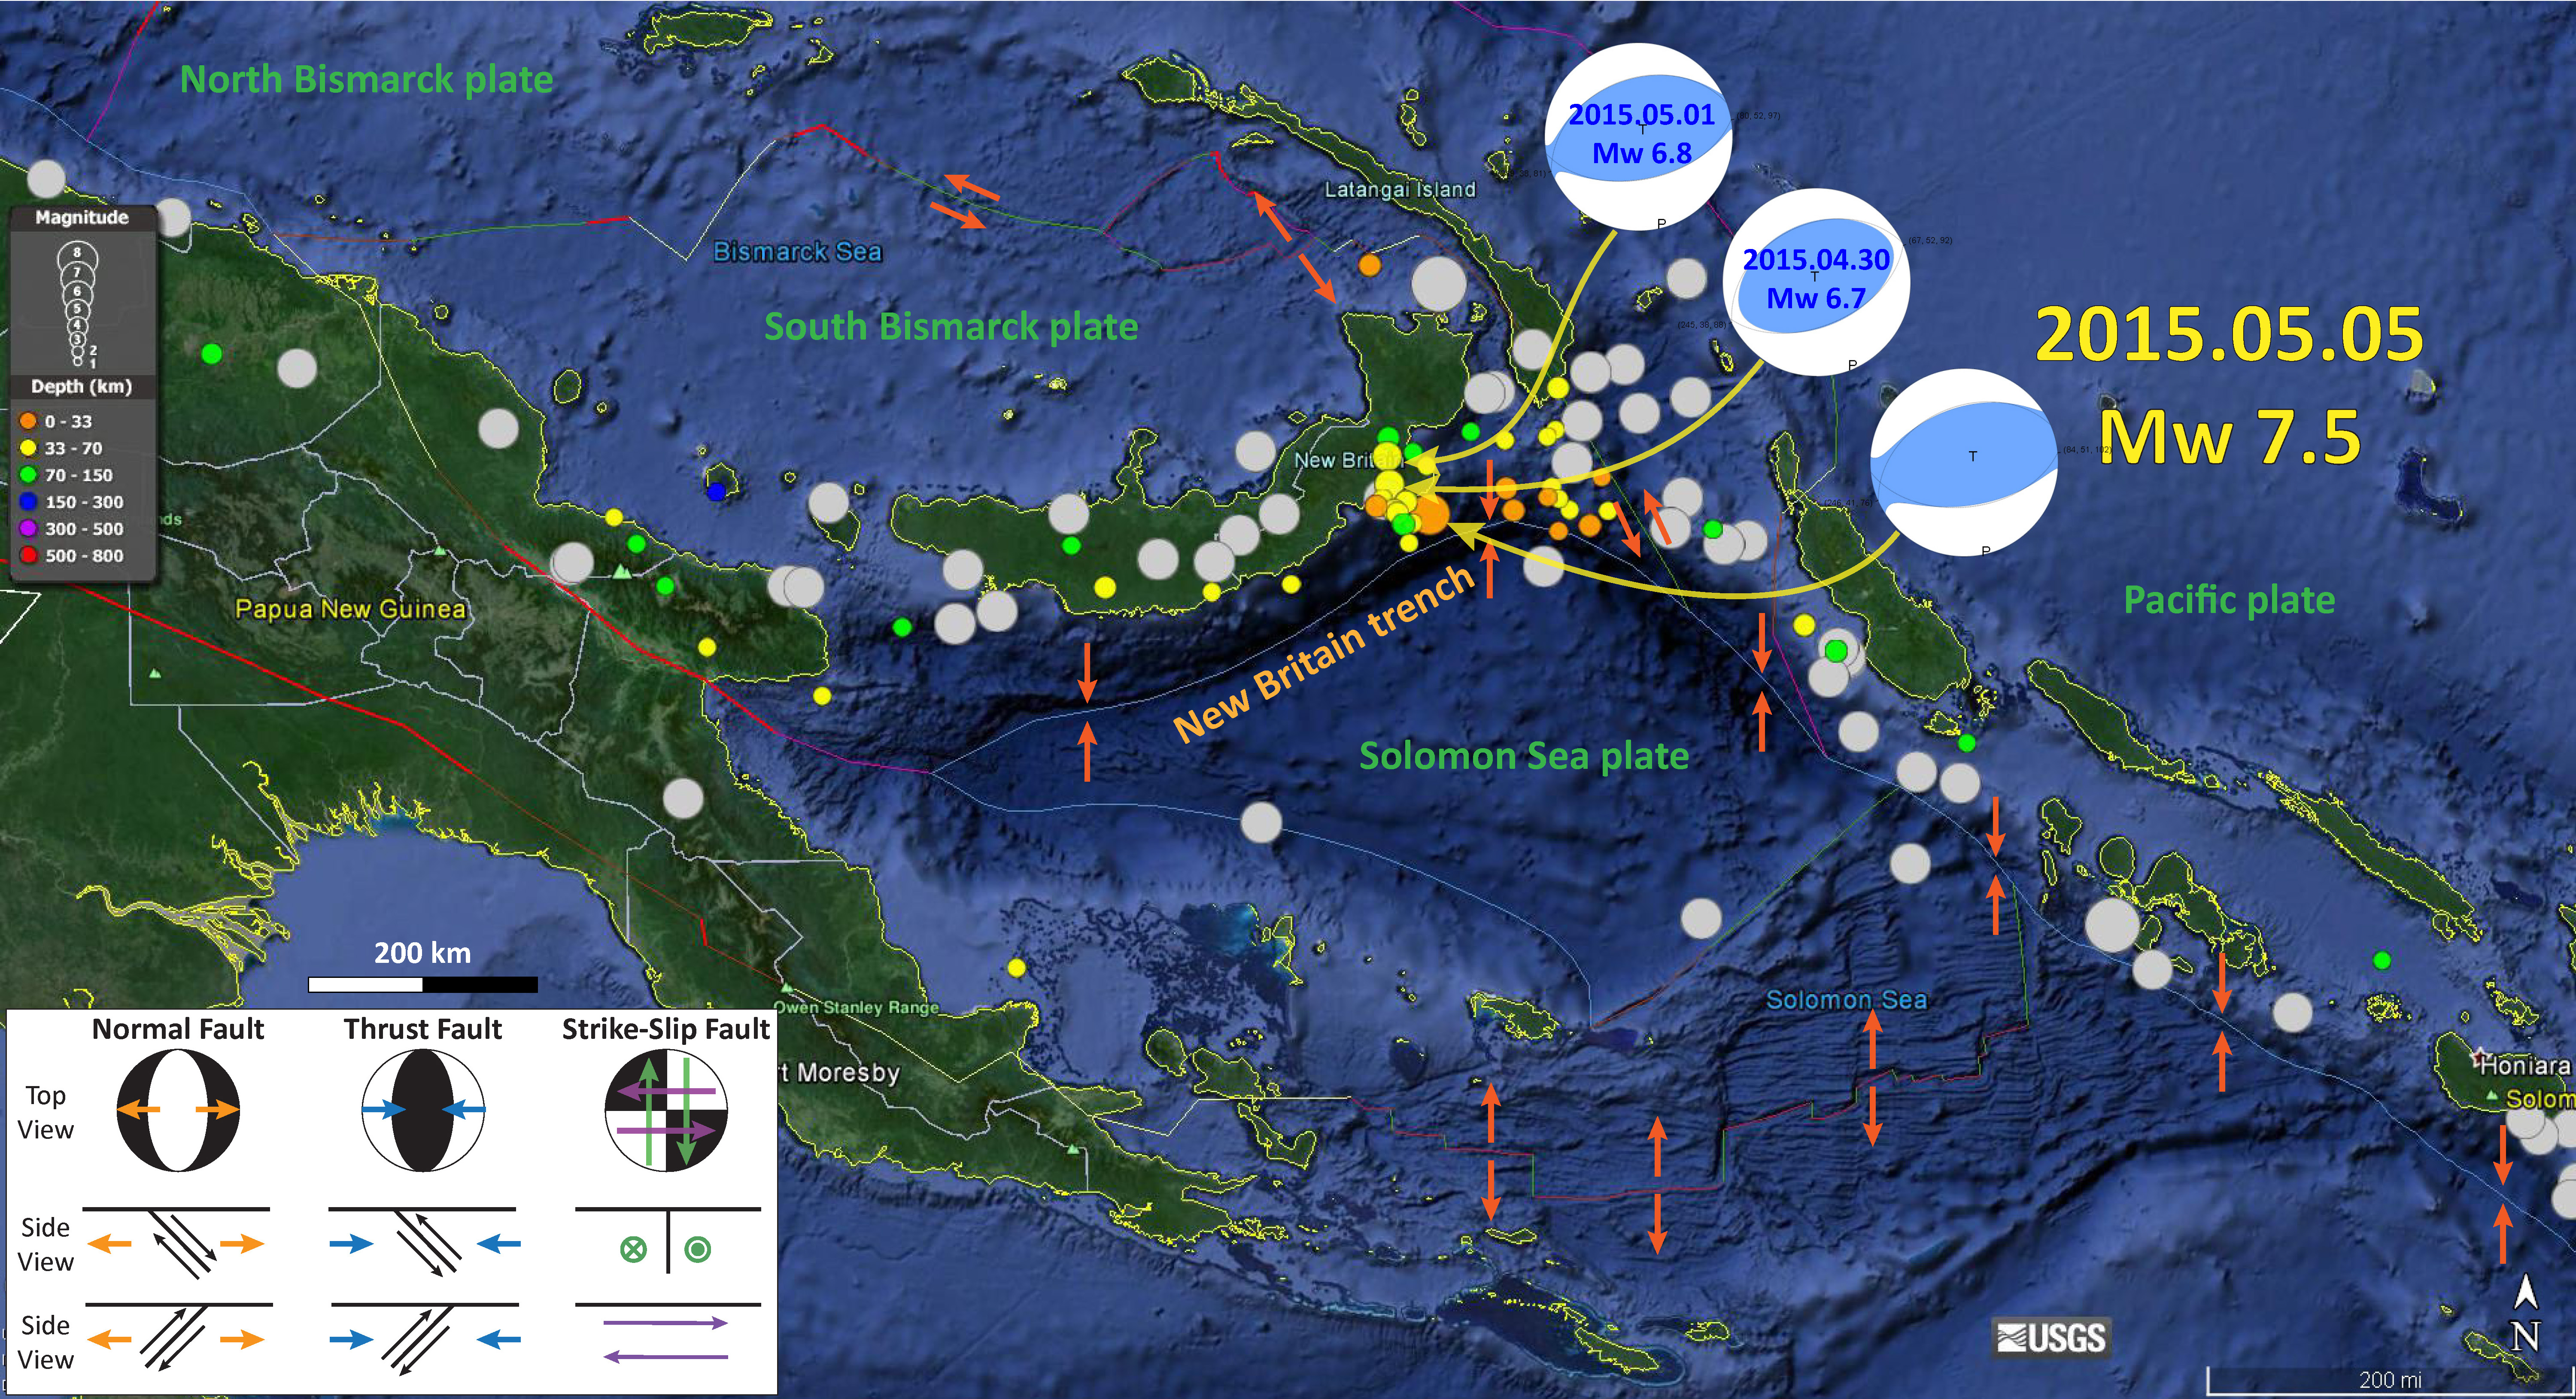
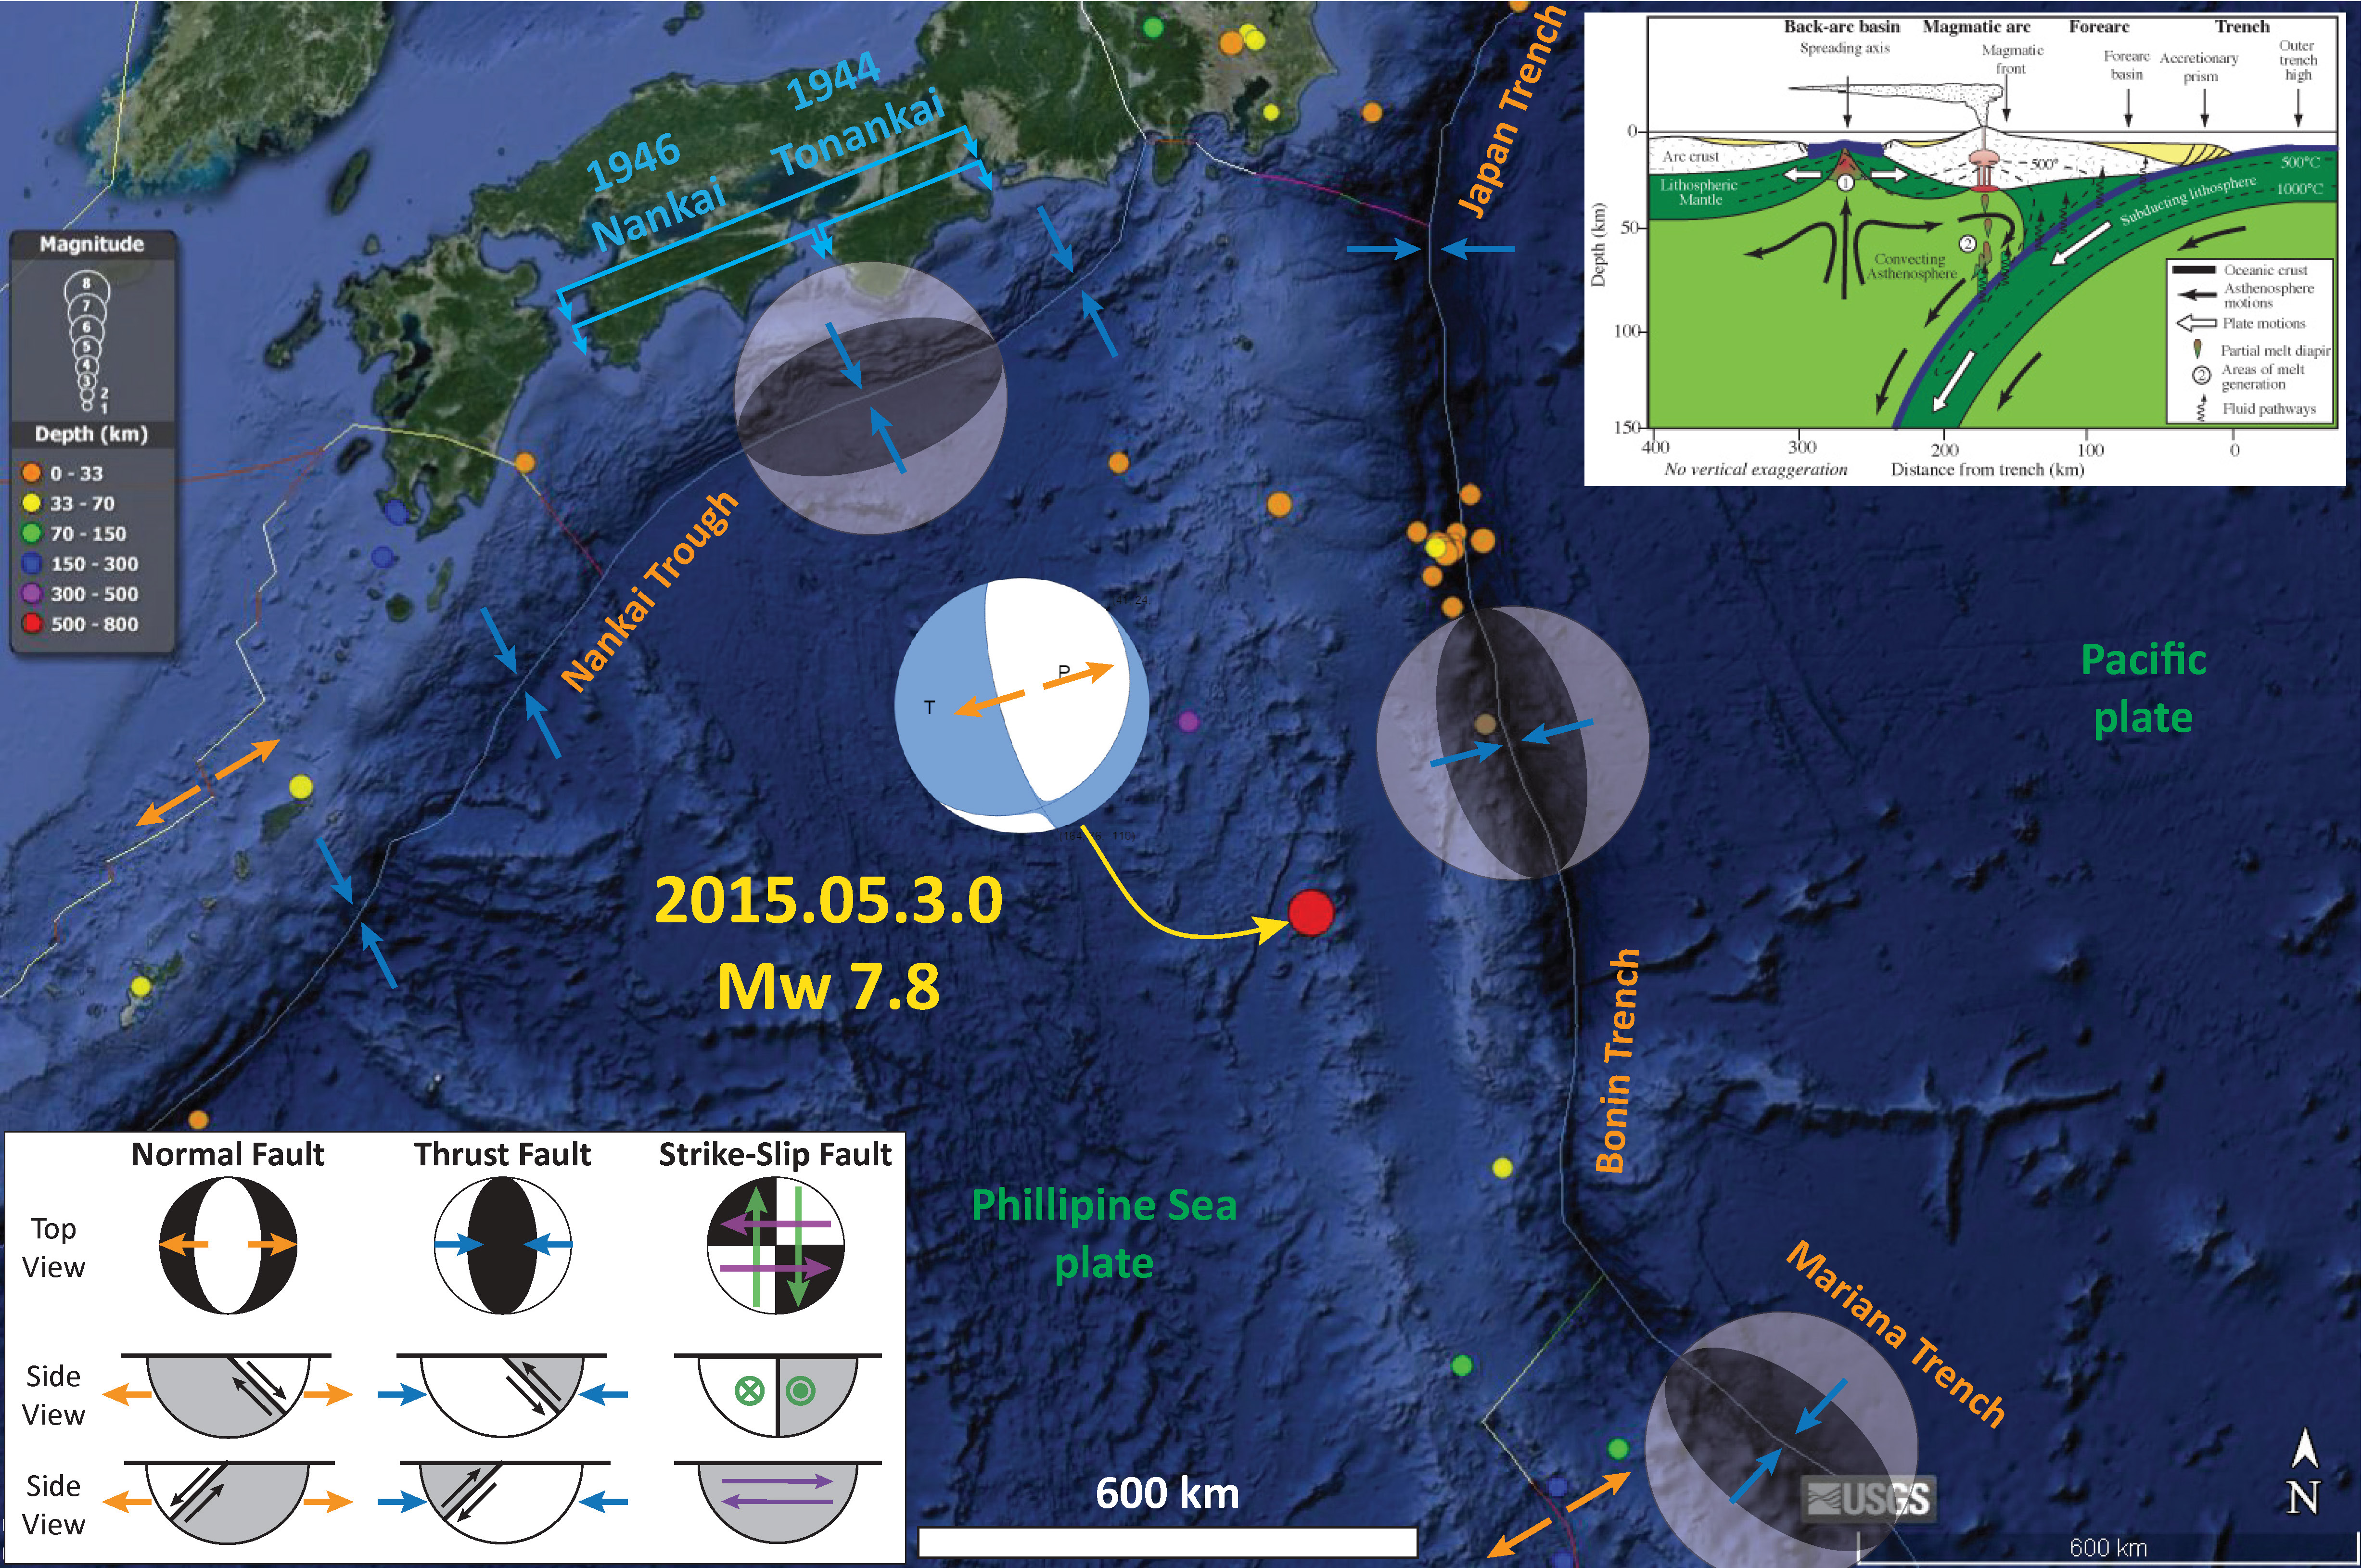
I placed a moment tensor / focal mechanism legend in the lower left corner of the map. There is more material from the USGS web sites about moment tensors and focal mechanisms (the beach ball symbols). Both moment tensors and focal mechanisms are solutions to seismologic data that reveal two possible interpretations for fault orientation and sense of motion. One must use other information, like the regional tectonics, to interpret which of the two possibilities is more likely.
In some cases, I am able to interpret the sense of motion for strike-slip earthquakes. In other cases, I do not know enough to be able to make this interpretation (so I plot both solutions).

-
2015.02.13 Northern Mid Atlantic Ridge
-
2015.02.27 Indonesia
- possibly related 2015.02.28 M 5.0
-
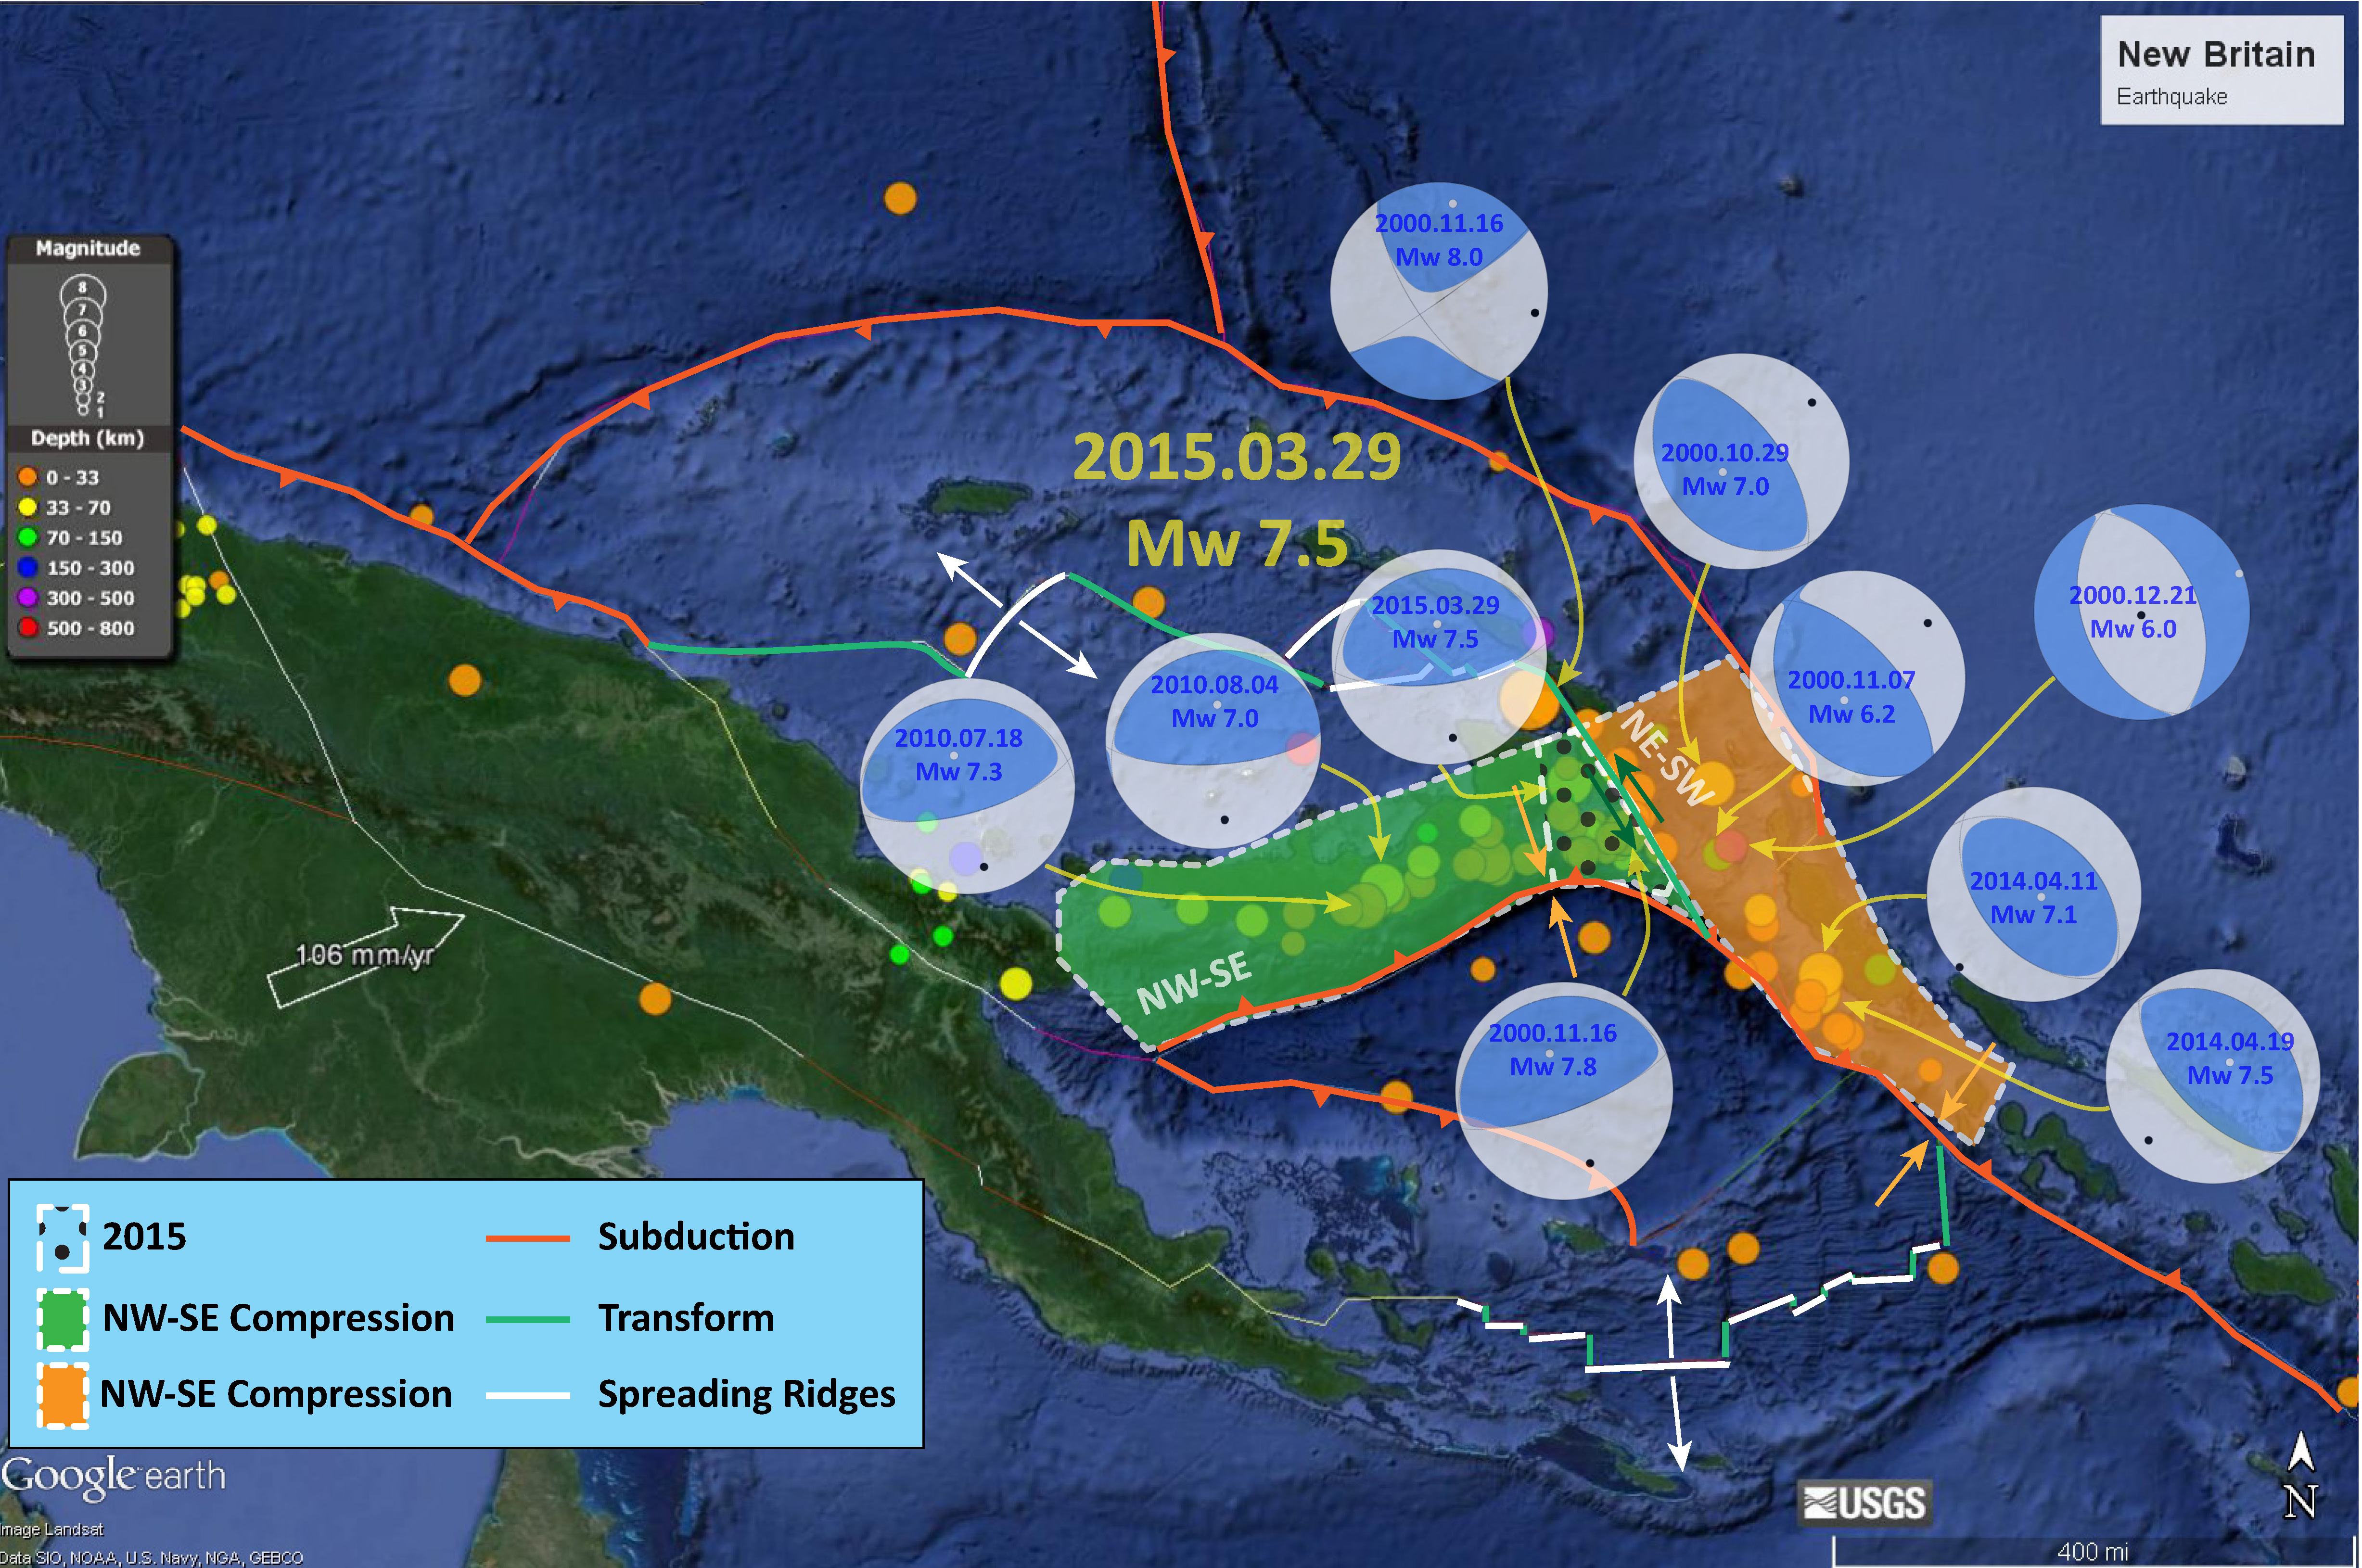
2015.03.29 New Britain
- 2015.03.29 update #1
- 2015.03.29 Tsunami Update
- 2015.03.29 seismicity New Britain from 2000-2015
- 2015.03.30 update #2
- 2015.03.30 update #3 tectonic domains
- Tectonic Domain Map
-
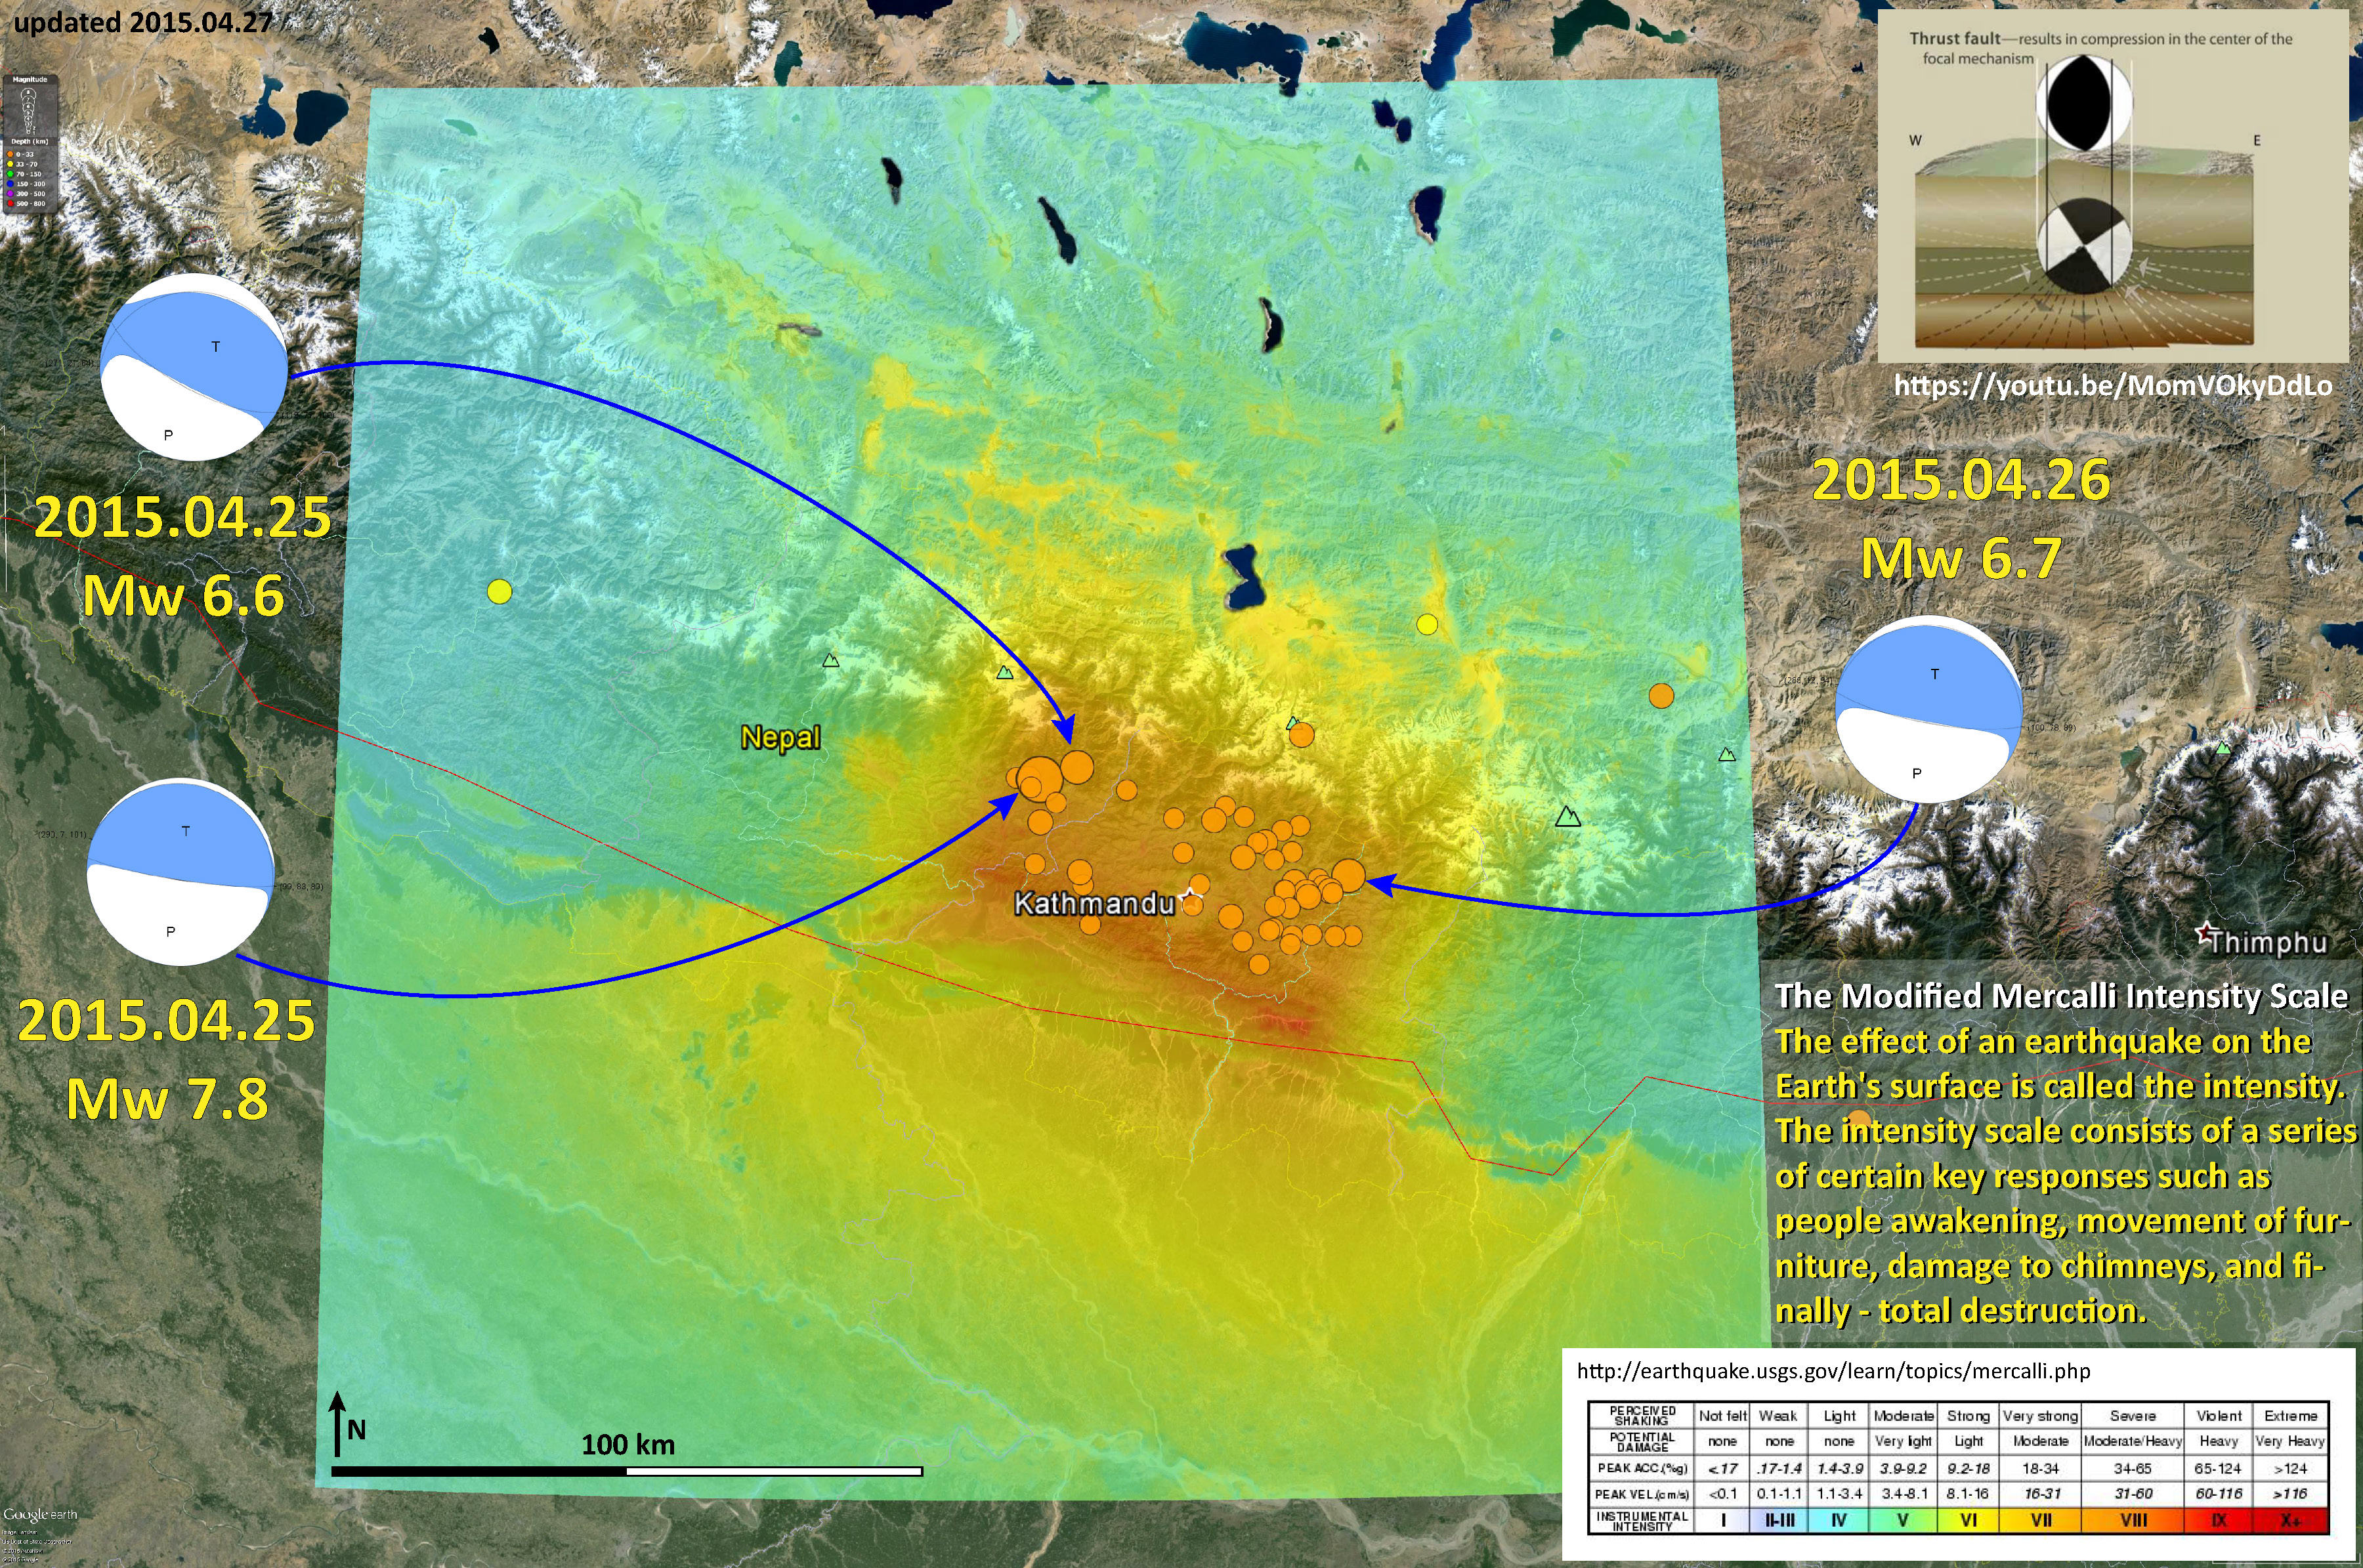
2015.04.25 Nepal
- 2015.04.25 Nepal update #1 aftershock region
- 2015.04.25 Nepal update #2 historic earthquakes
- 2015.04.25 Nepal update #3 updated historic map and cross section
- 2015.04.25 Nepal update #4 PGA, DYFI, Attenuation
- 2015.04.25 Nepal update #5 Surface Displacement, Ground Motions
- 2015.04.25 Nepal update #6 updated historic map and GIS data
- 2015.04.25 Nepal update #7 surface deformation
-
2015.05.05 New Britain
-
2015.05.07 Solomon Sea
-
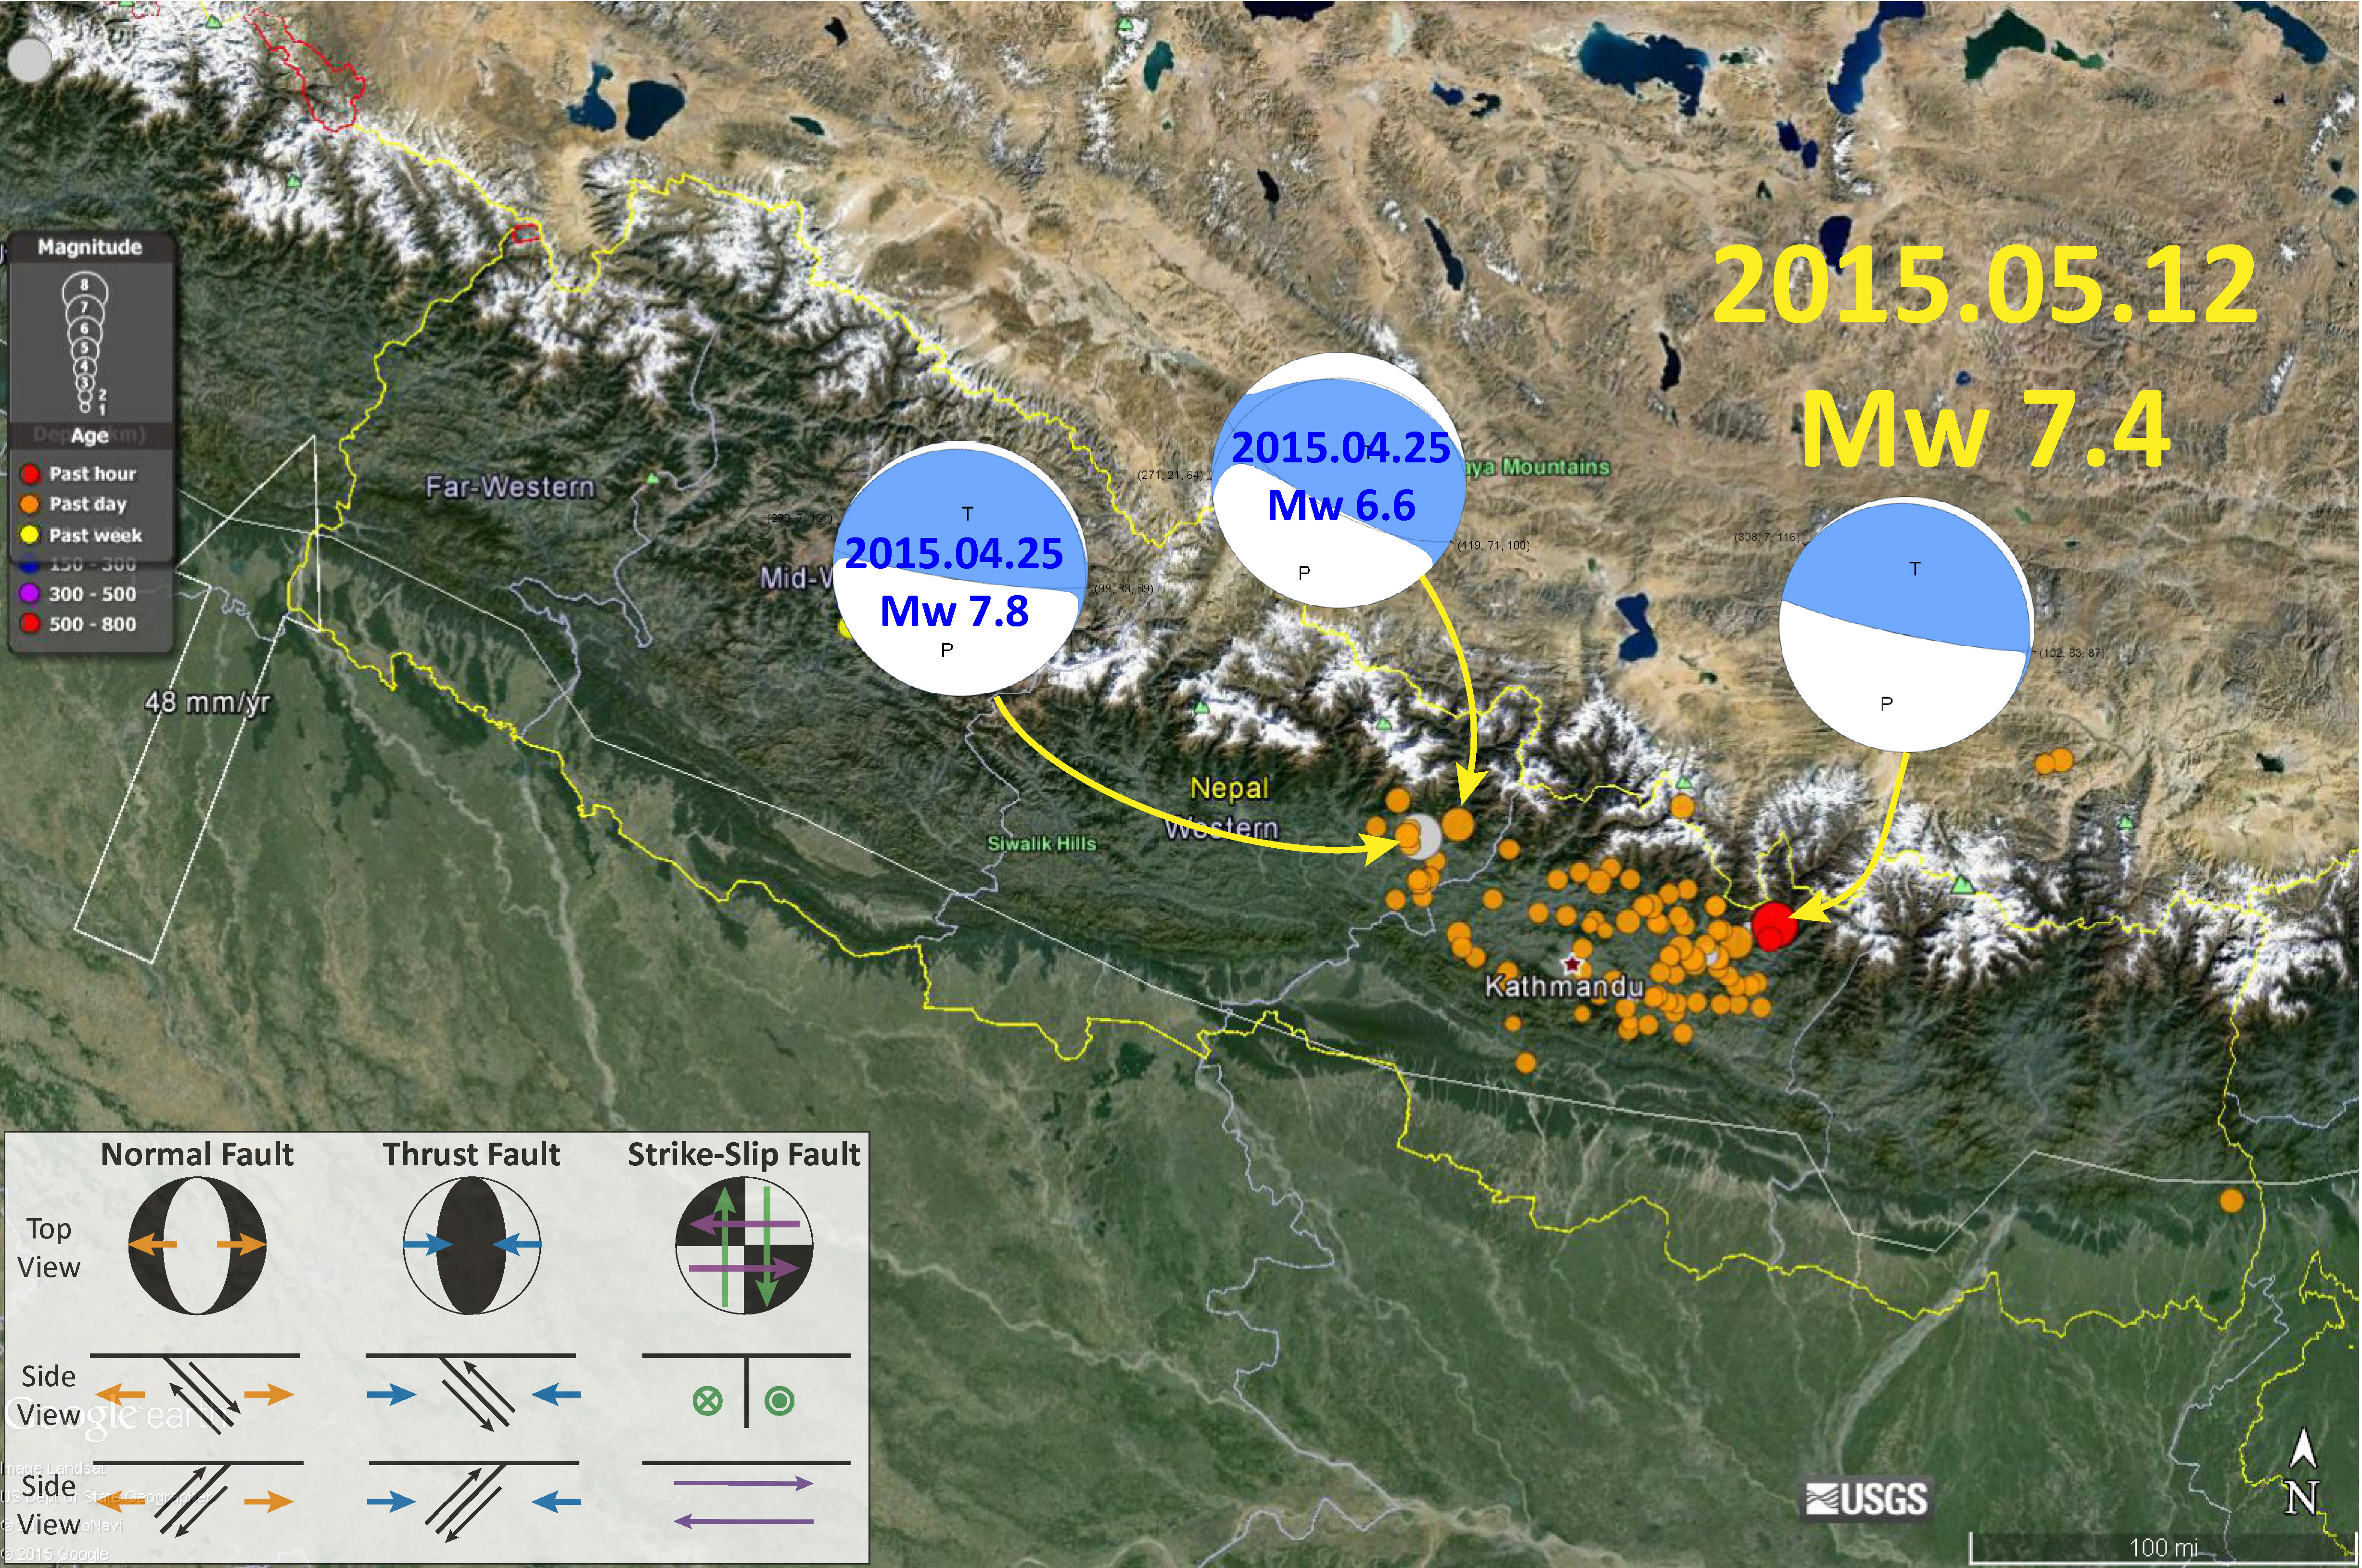
2015.05.12 Nepal aftershock
- 2015.05.12 Nepal aftershock update #1
- 2015.05.12 Nepal aftershock update #2
- 2015.05.12 Nepal aftershock update #3
- 2015.05.12 Nepal aftershock update #4
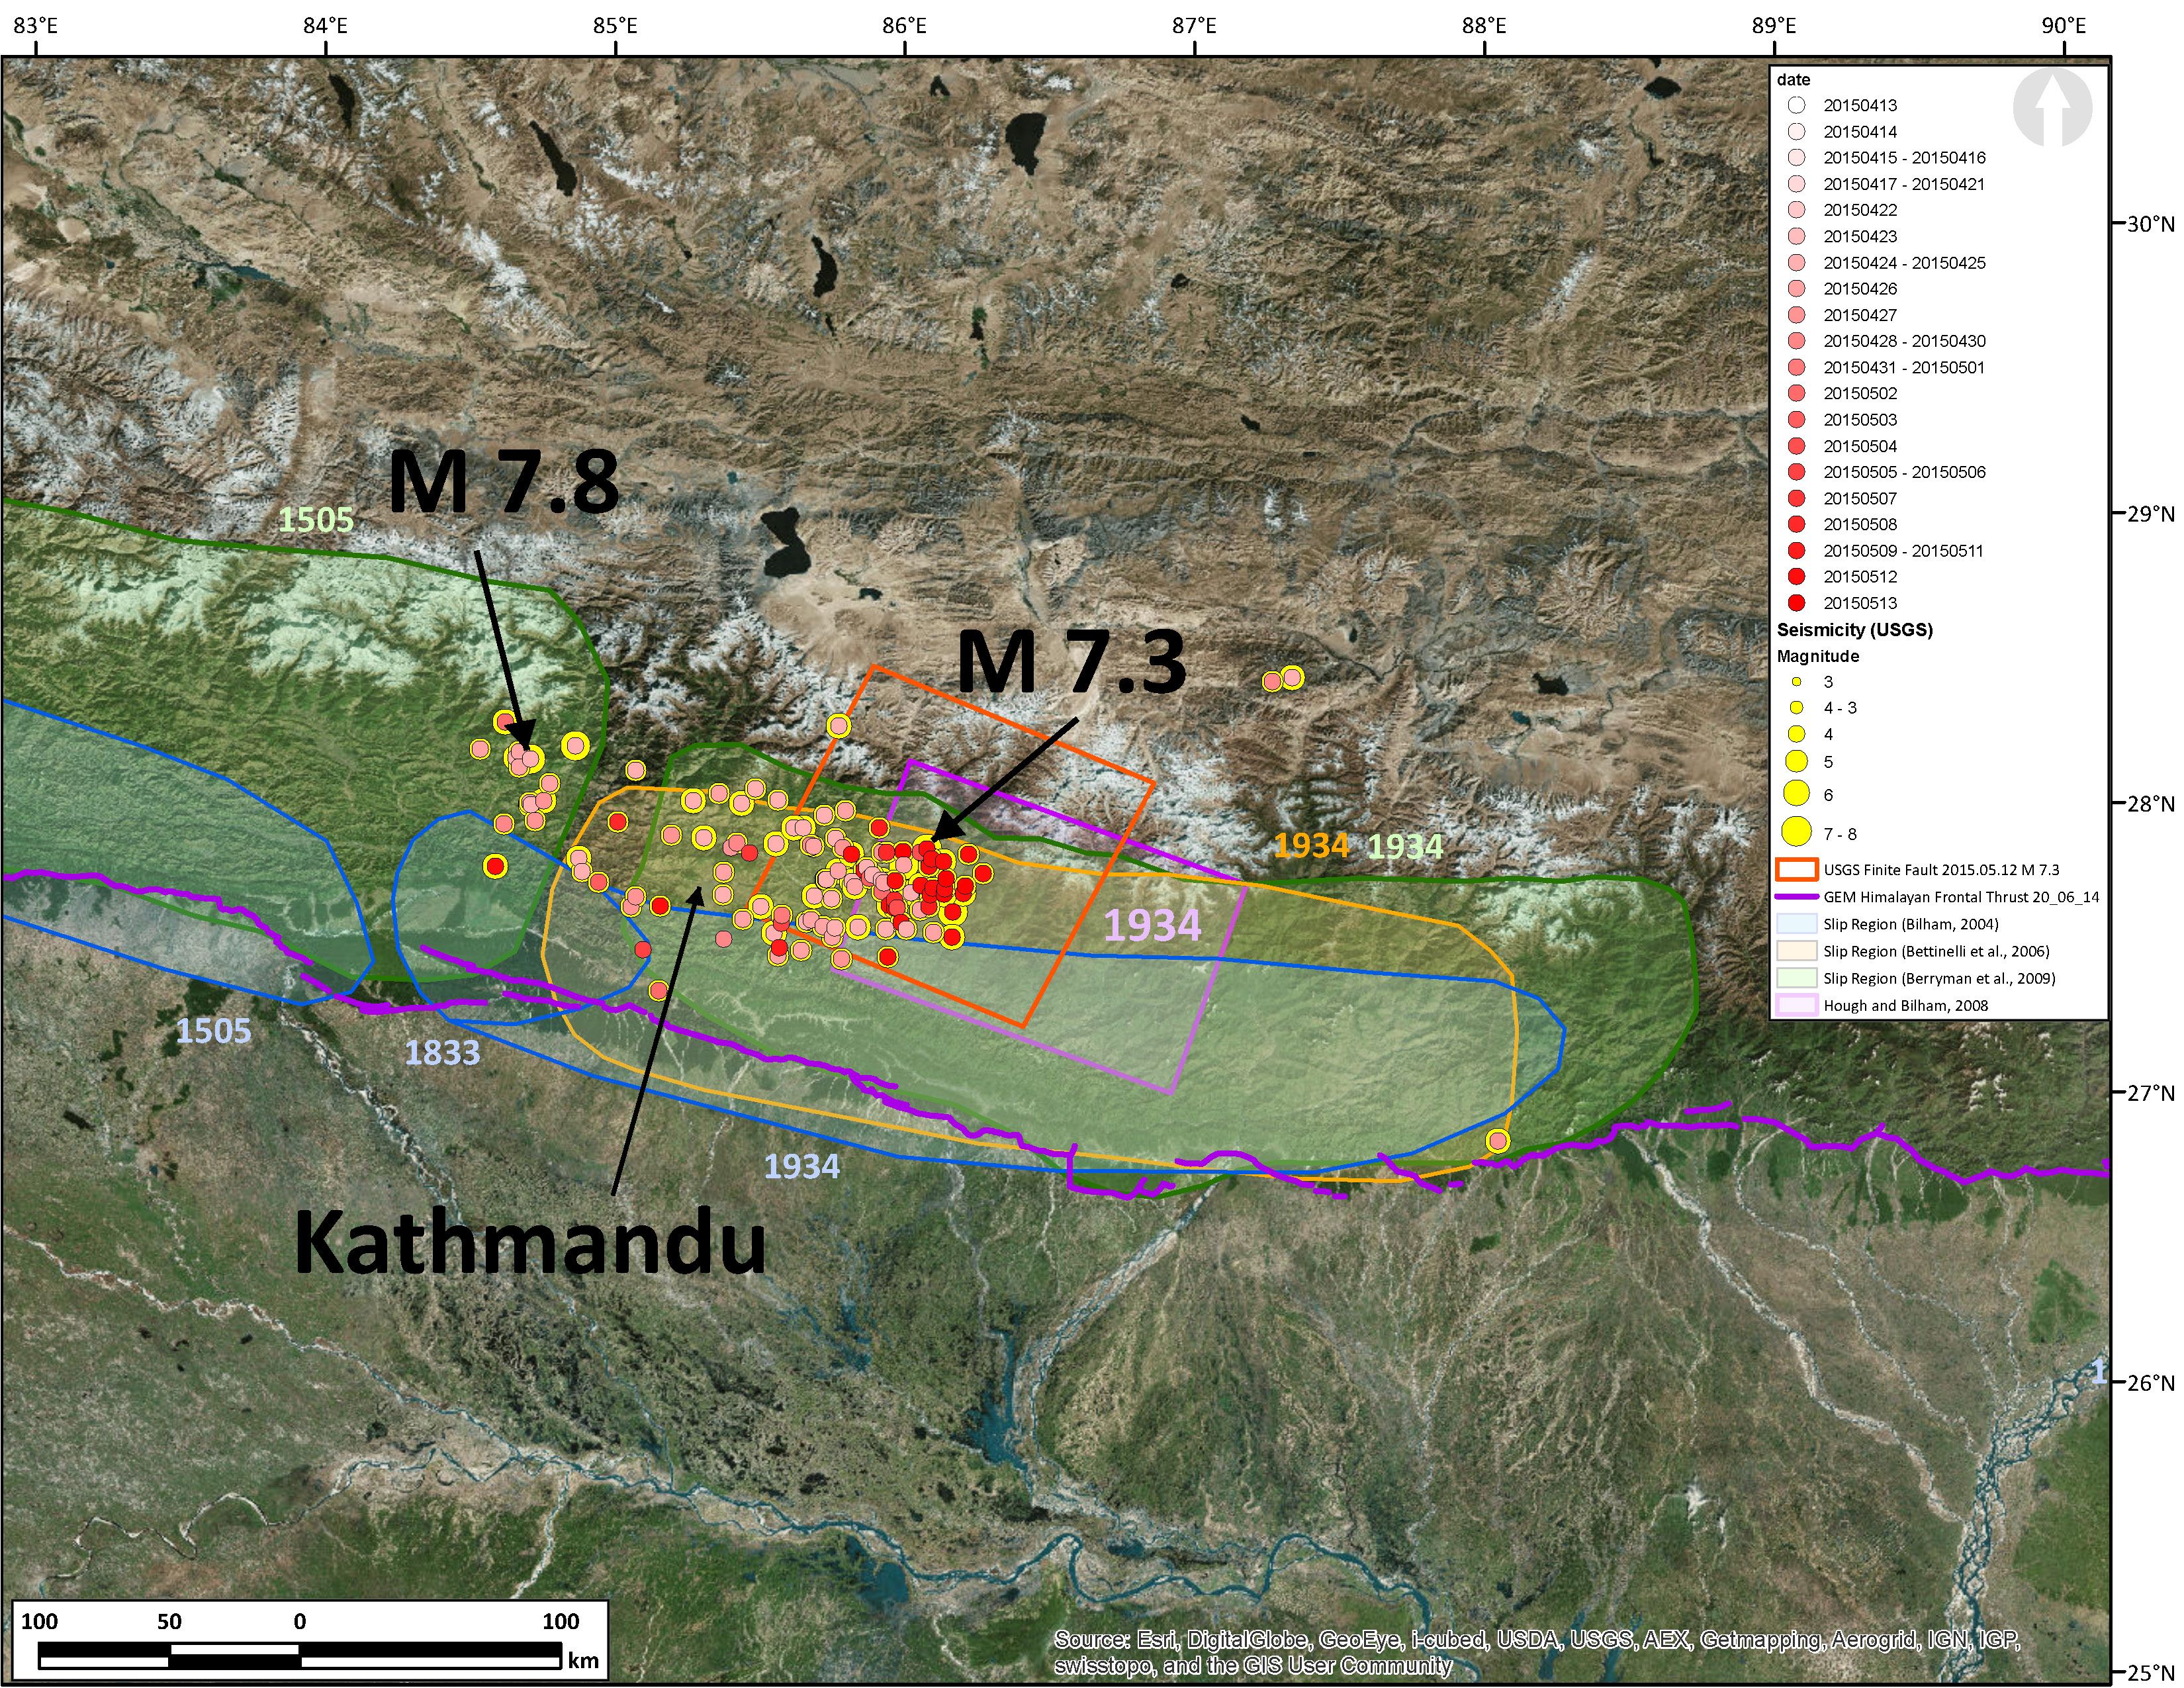
- Here is the map that I put together. I have placed the USGS epicenters with two color schemes. The size of the yellow dots represents earthquake magnitude. The degree of redness designates the time (earlier-April = pink & later-May = red). Note how there are some pink colored epicenters in the region of the M 7.3 earthquake. These pink colored earthquakes all occurred in April. The red ones are from May. These epicenters may not be plotted with the greatest certainty, though any uncertainty is possibly shared between them. So, there relative positions are possibly good.
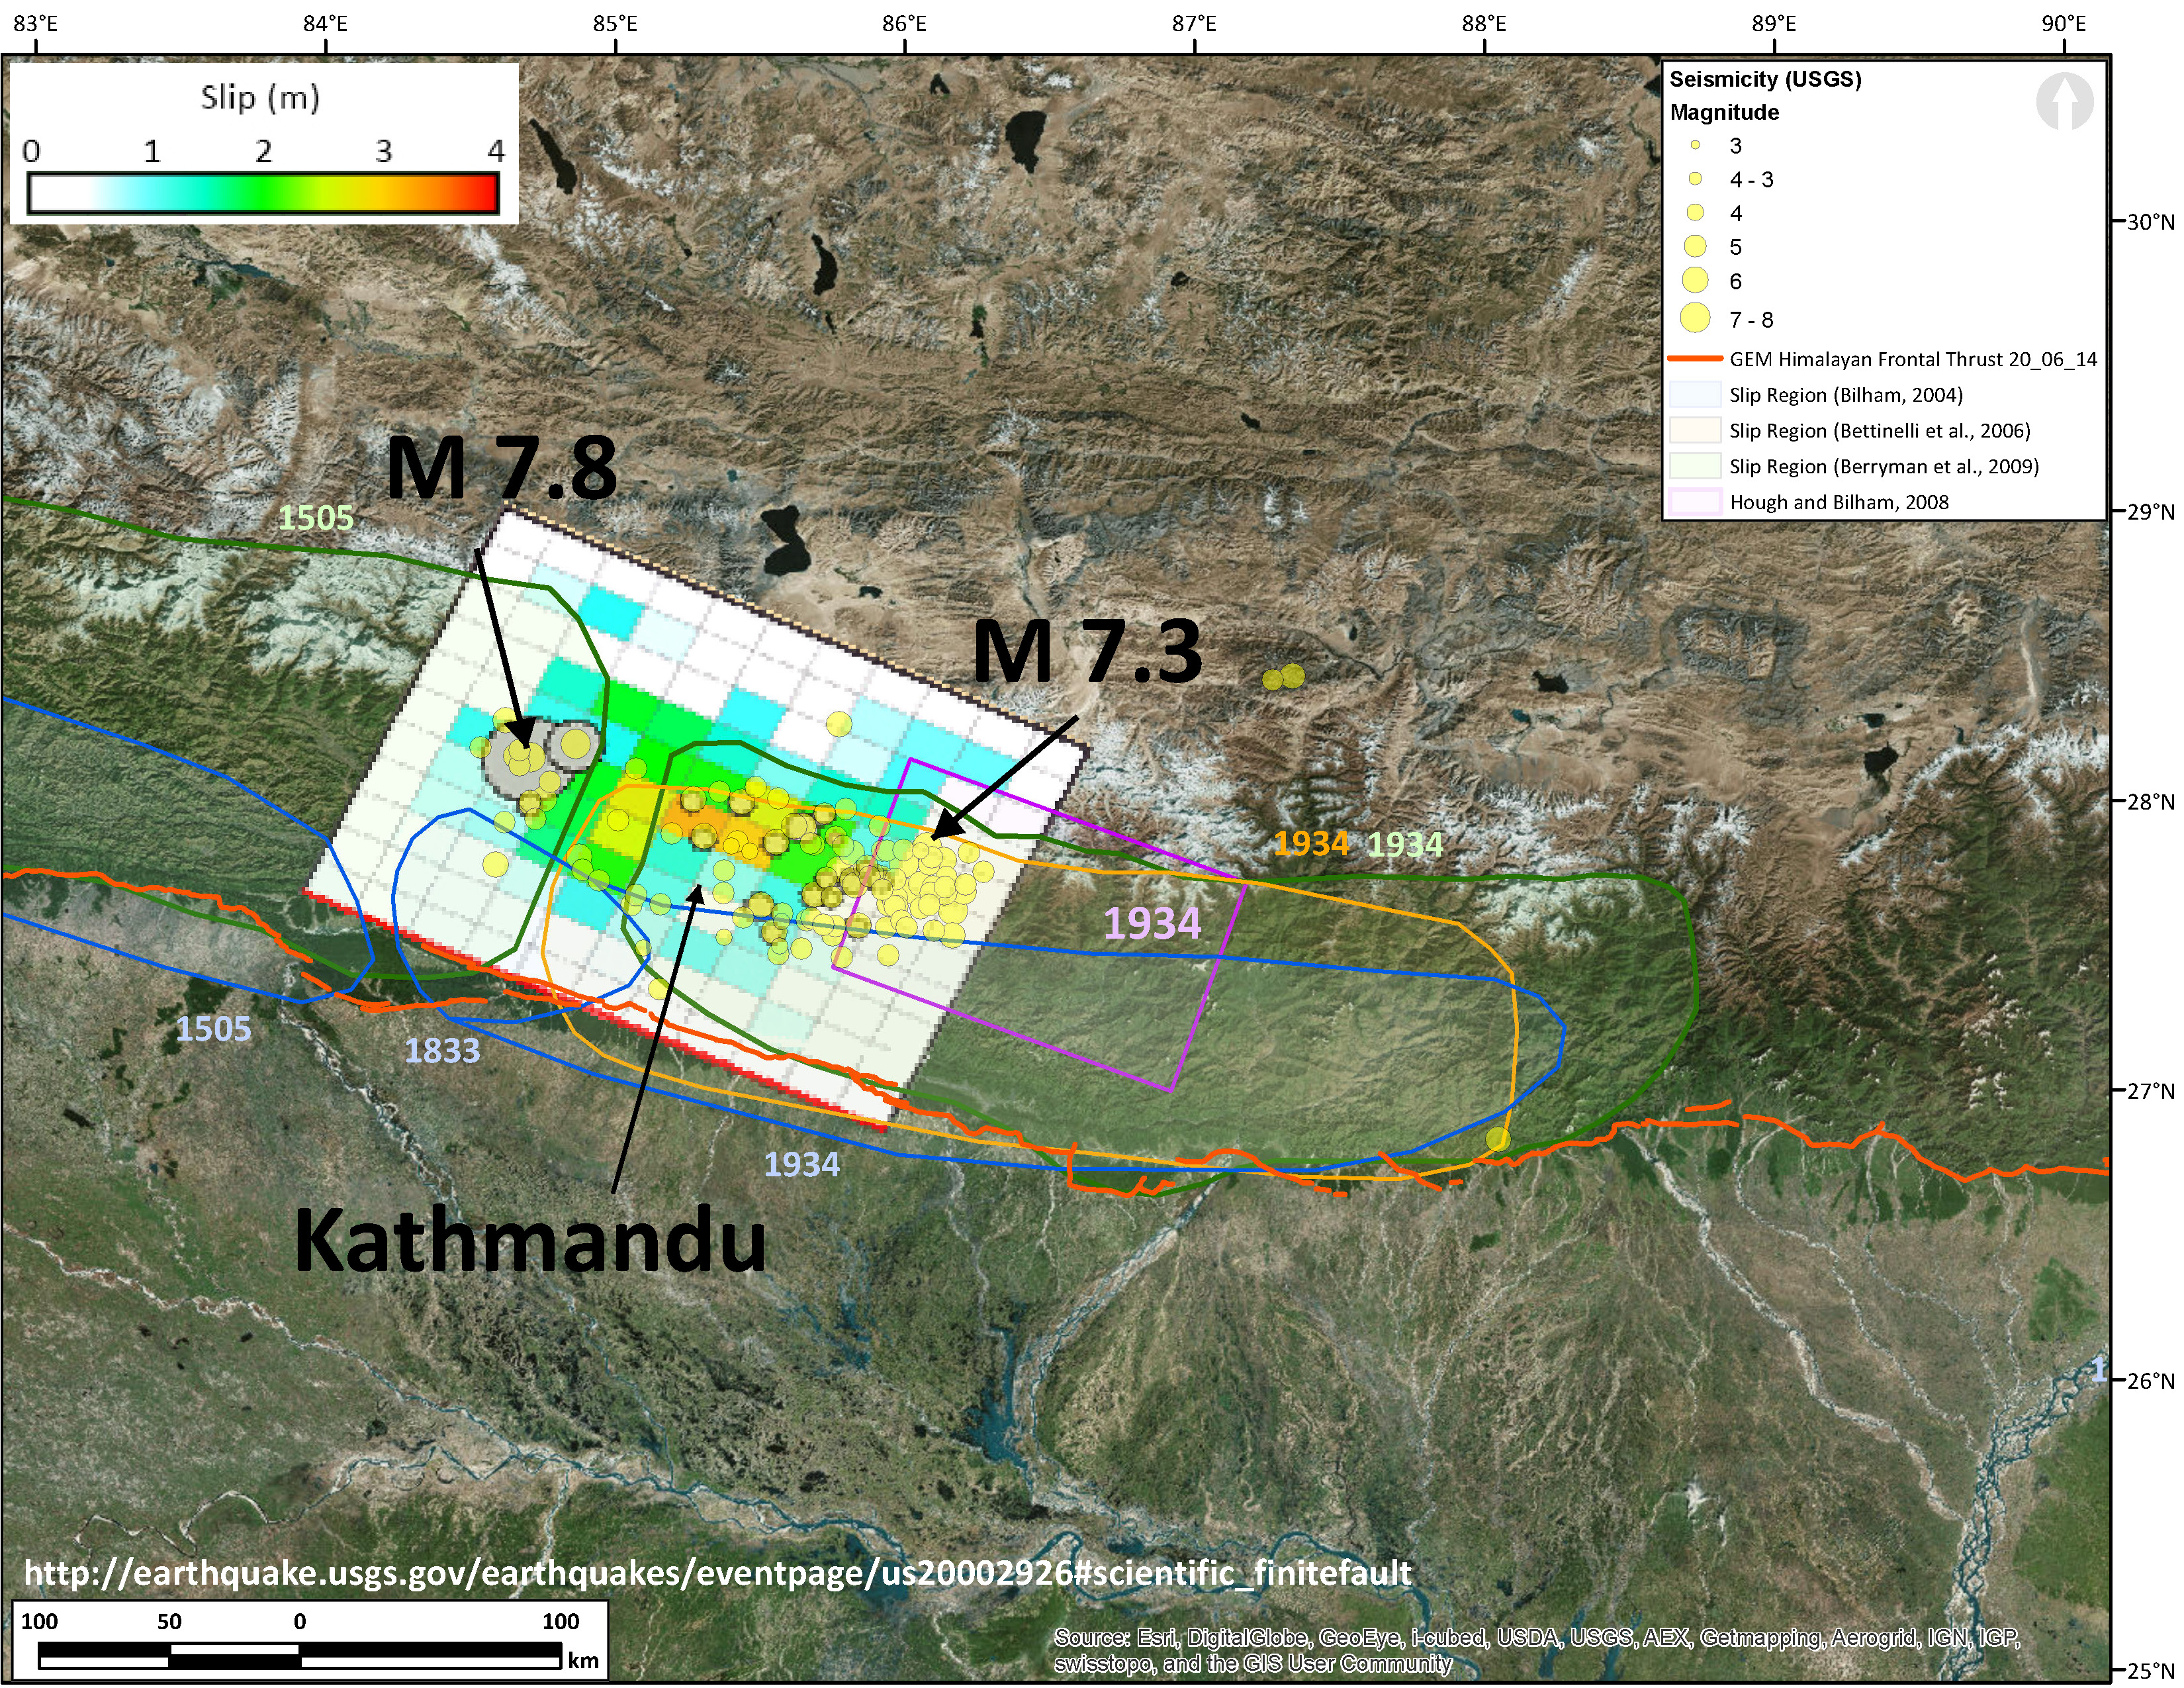
- Mw 7.8 Earthquake Finite Fault Plane Solution from the USGS.
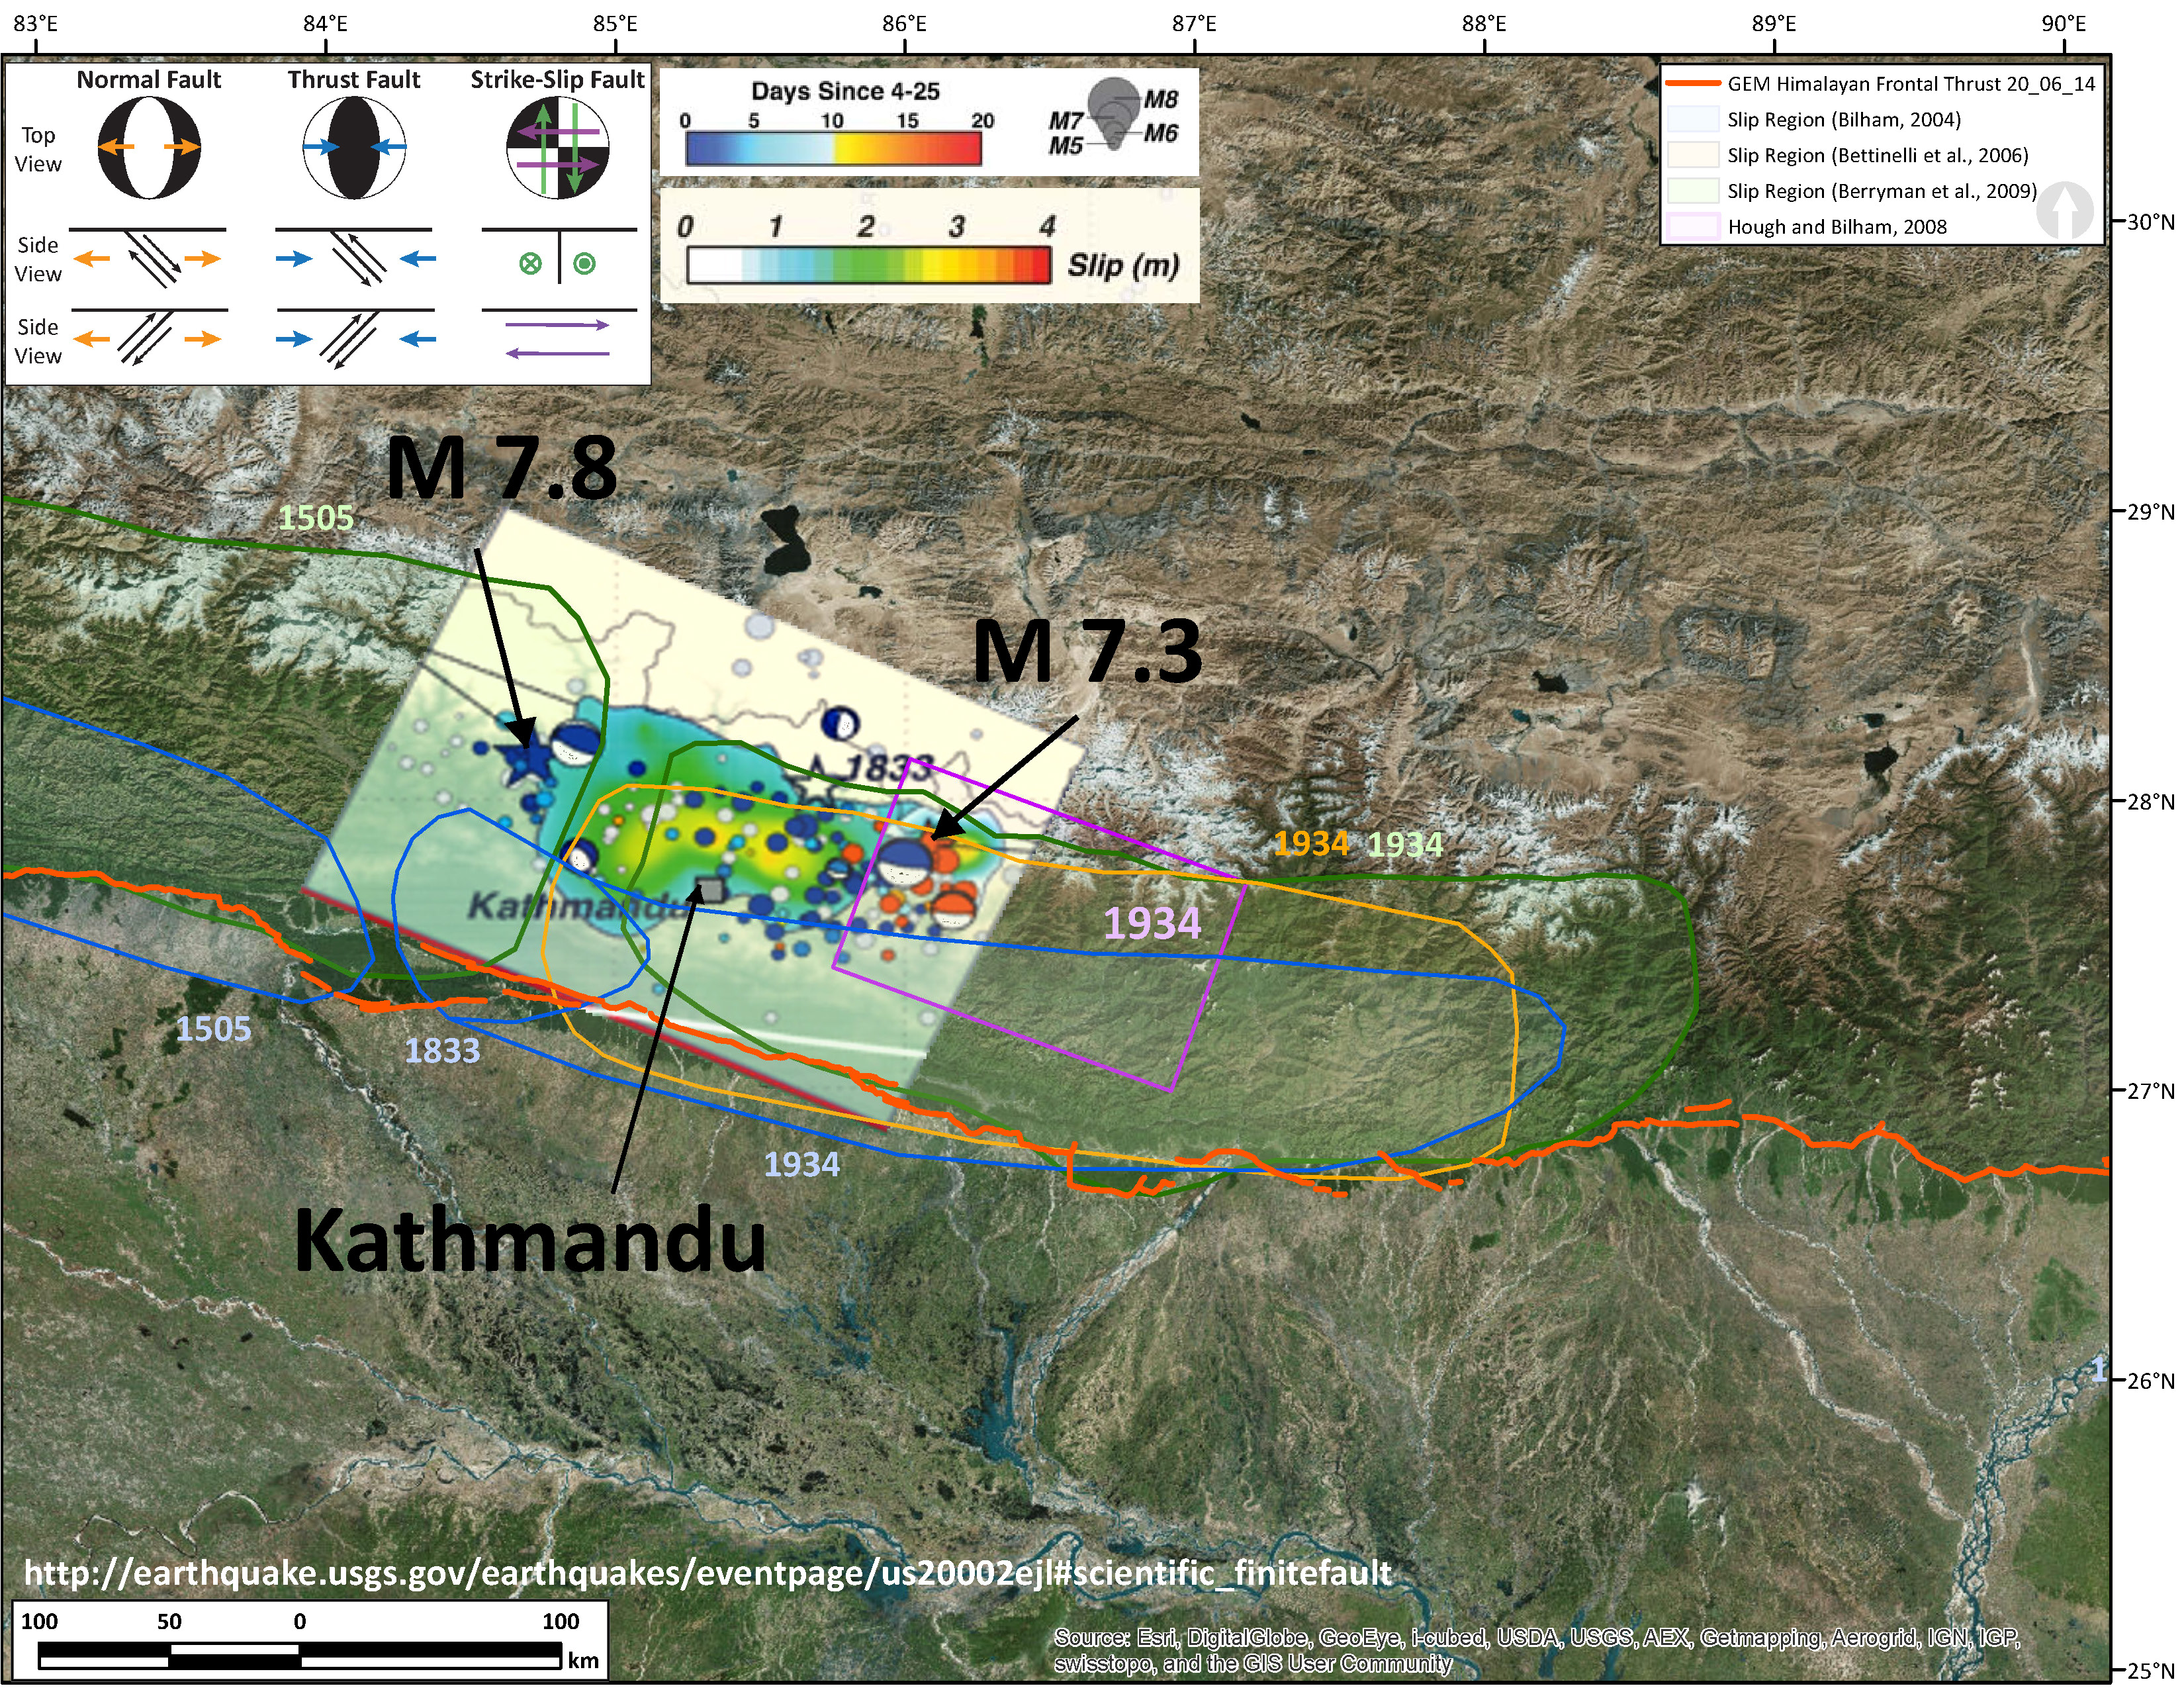
- Mw 7.3 Earthquake Finite Fault Plane Solution from the USGS.
-
2015.05.30 Izu Bonin
- 2015.05.30 Izu Bonin update #1 triggered seismicity?
- 2015.05.30 Izu Bonin update #2 Seismicity Animation: 1940-2015
- 2015.05.30 Izu Bonin update #3 HiNet Animation
- triggered seismicity map
-
2015.06.17 southern Mid Atlantic Ridge
- Here is an animation from IRIS that shows the M 7.0 seismic waves propagating through the USArray seismic network.
Here are some maps that I put together for each of these earthquakes.
For explanations for each map, please go to the earthquake report page for that map.

The first moment tensor has been calculated and I have plotted this Mww MT on the map. There has also been a small M 5.6 aftershock to this M 7.3 aftershock. Here is the map, that also includes moment tensors from the main shock and the previously largest aftershock (M = 6.6). The magnitude of this large aftershock has been changed to M 7.3.
2015.07.18 Santa Cruz Islands

2015.07.27 New Guinea

- This animation shows the three component (Z, N-S, E-W) motion as recorded by seismometers throughout the continental USA. The seismograph below the map shows the seismic waves as recorded at the seismometer highlighted in yellow on the map. This animation is from the IRIS page, where there are links to other data sources.
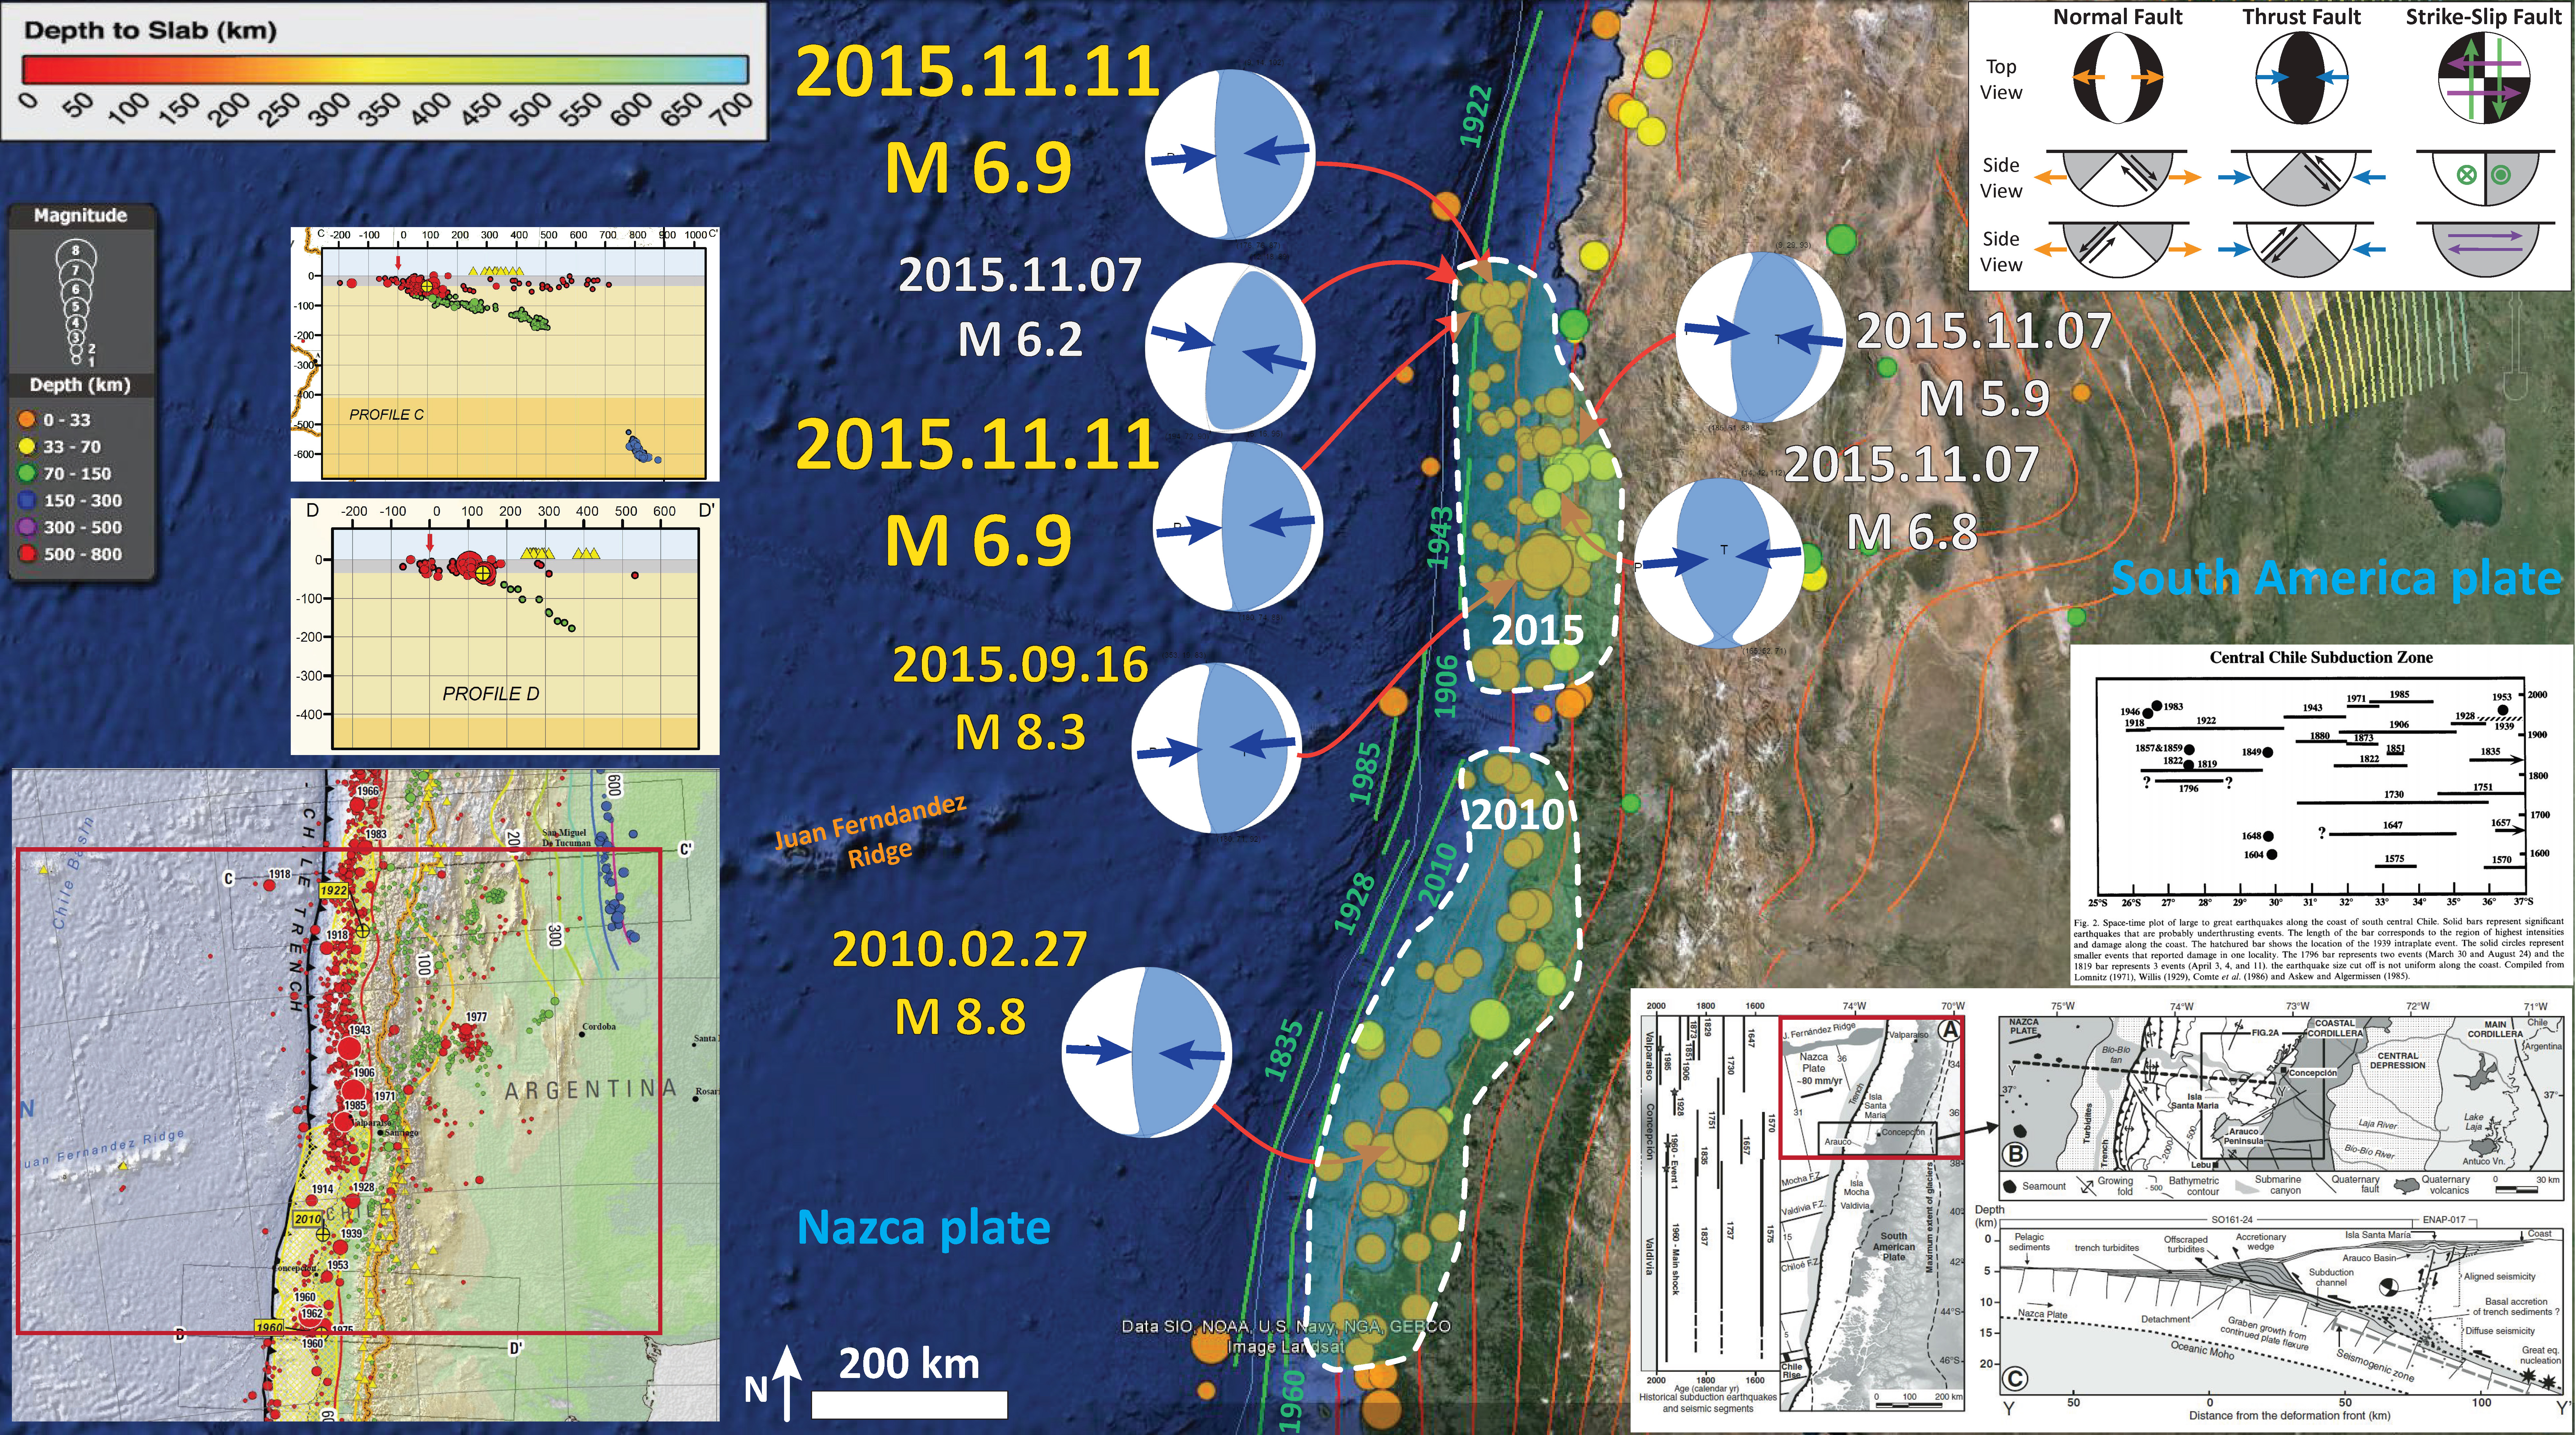
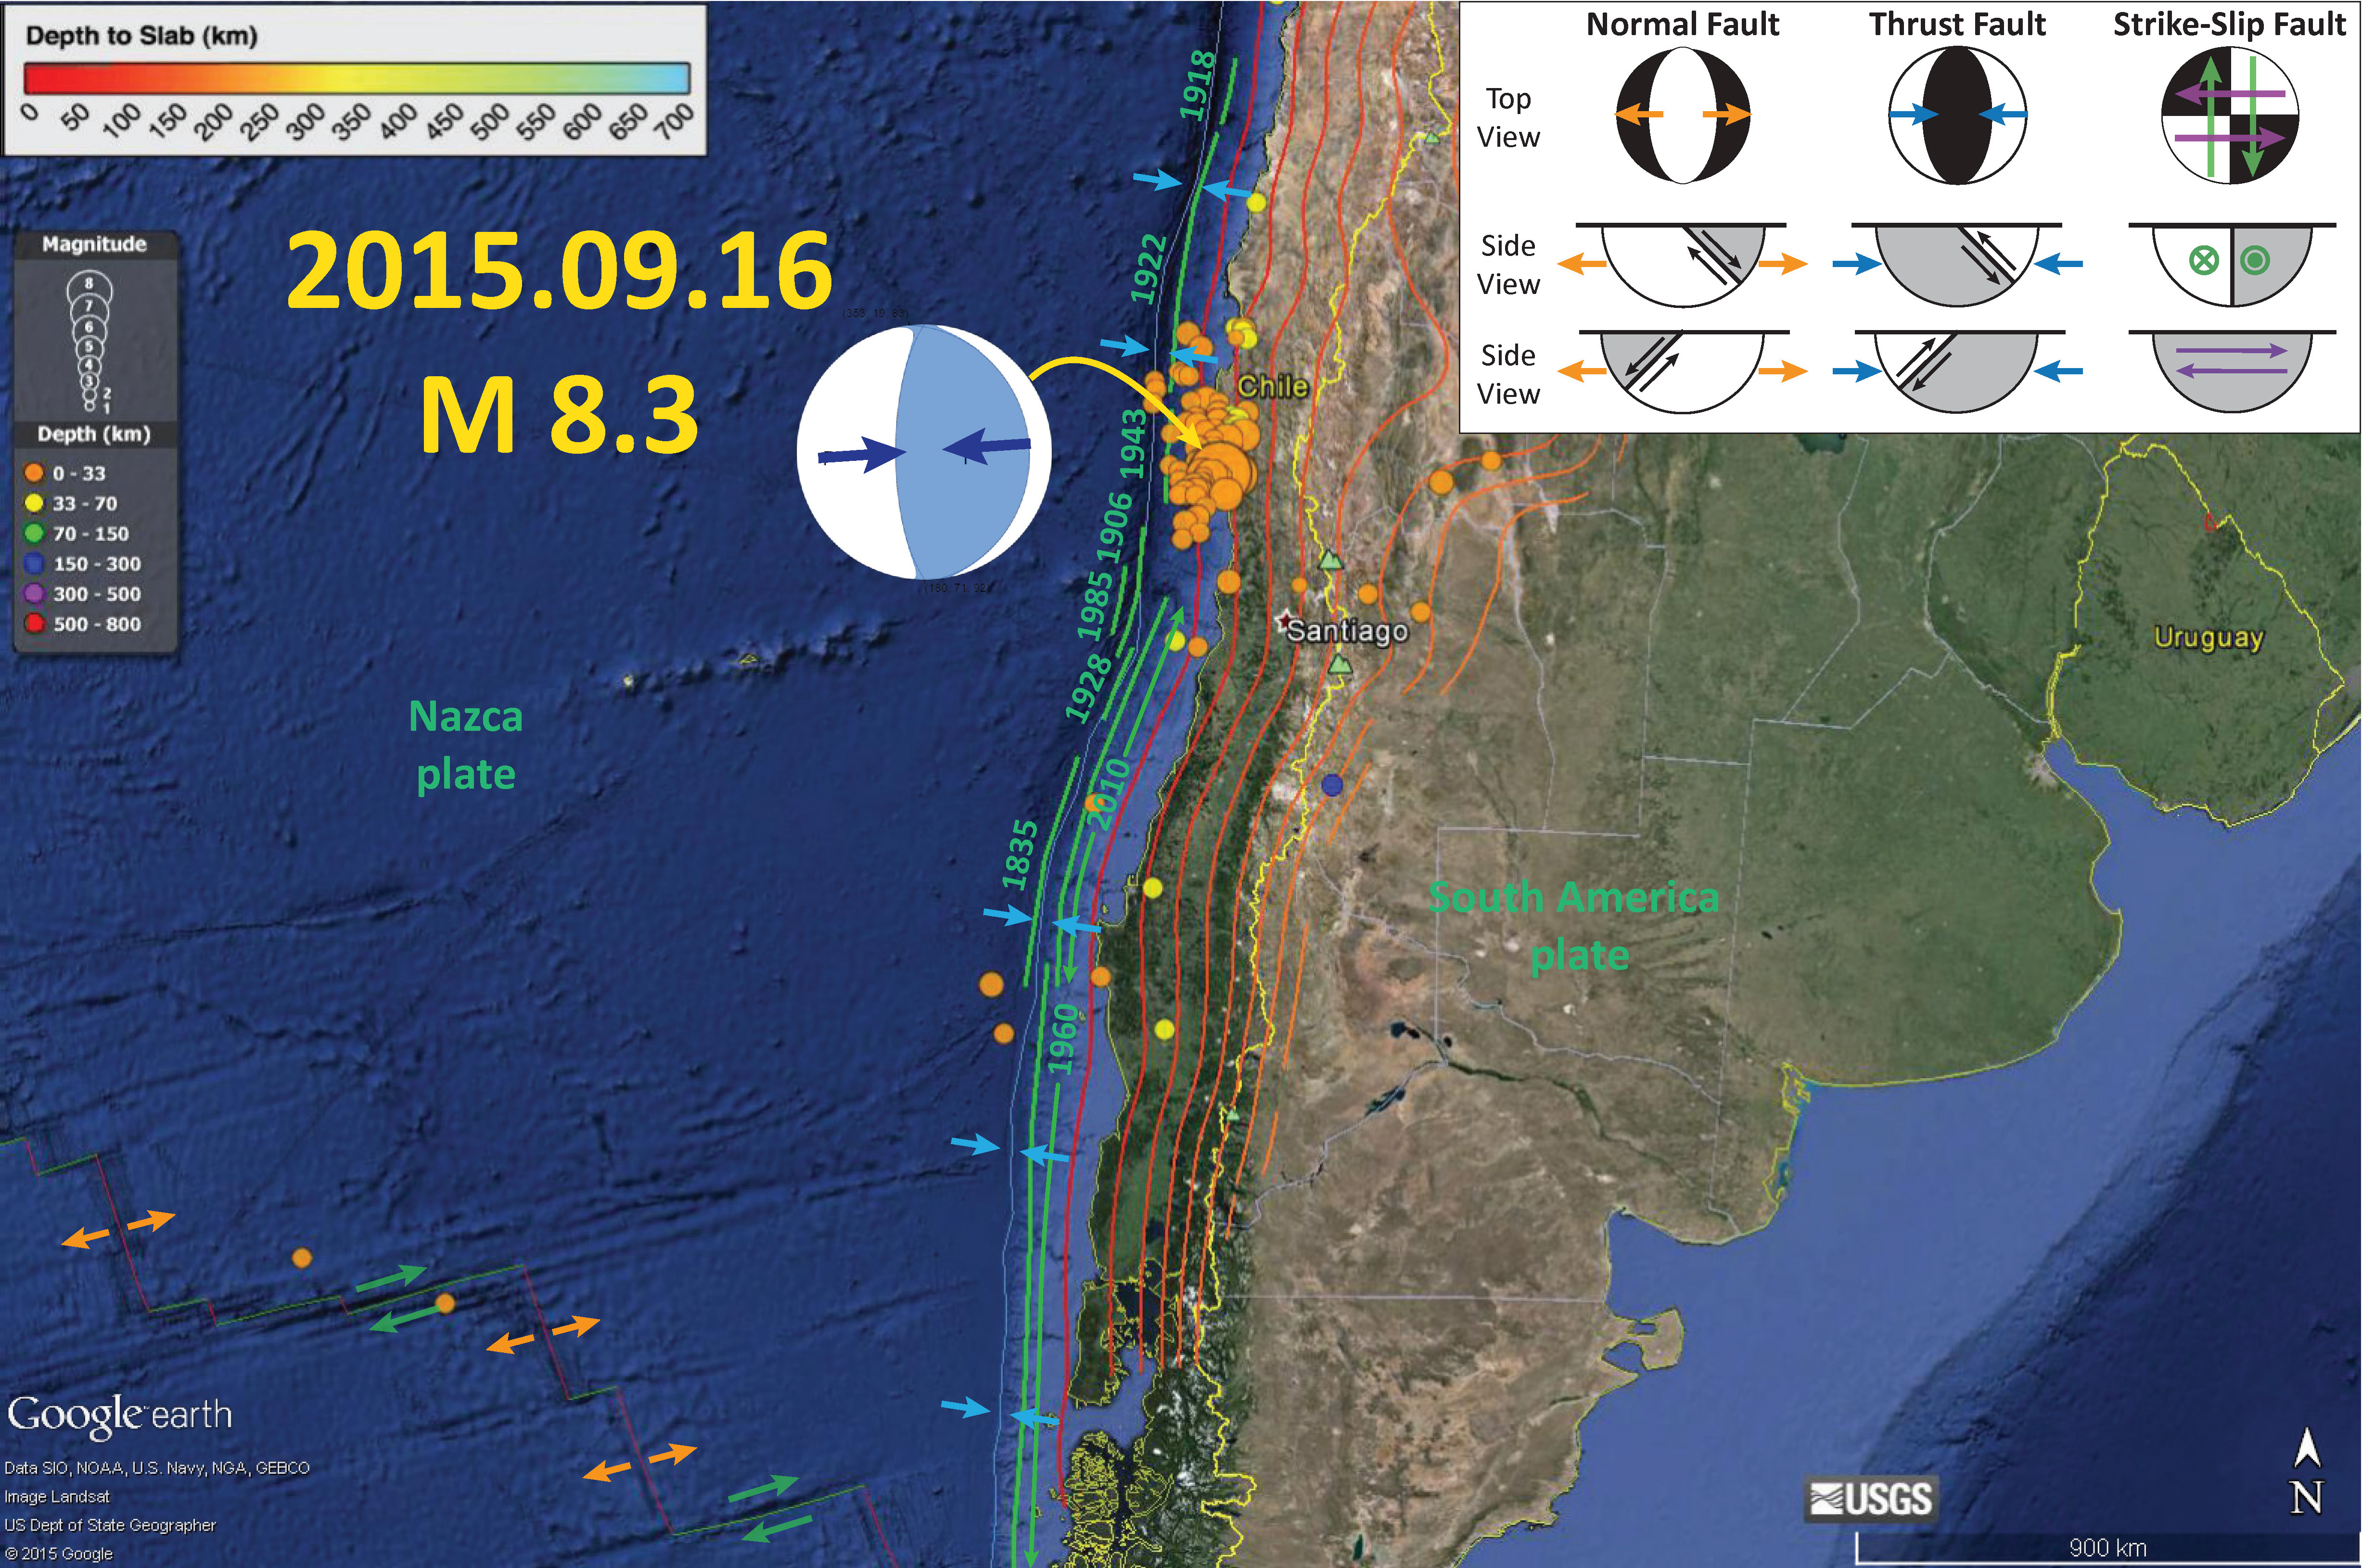
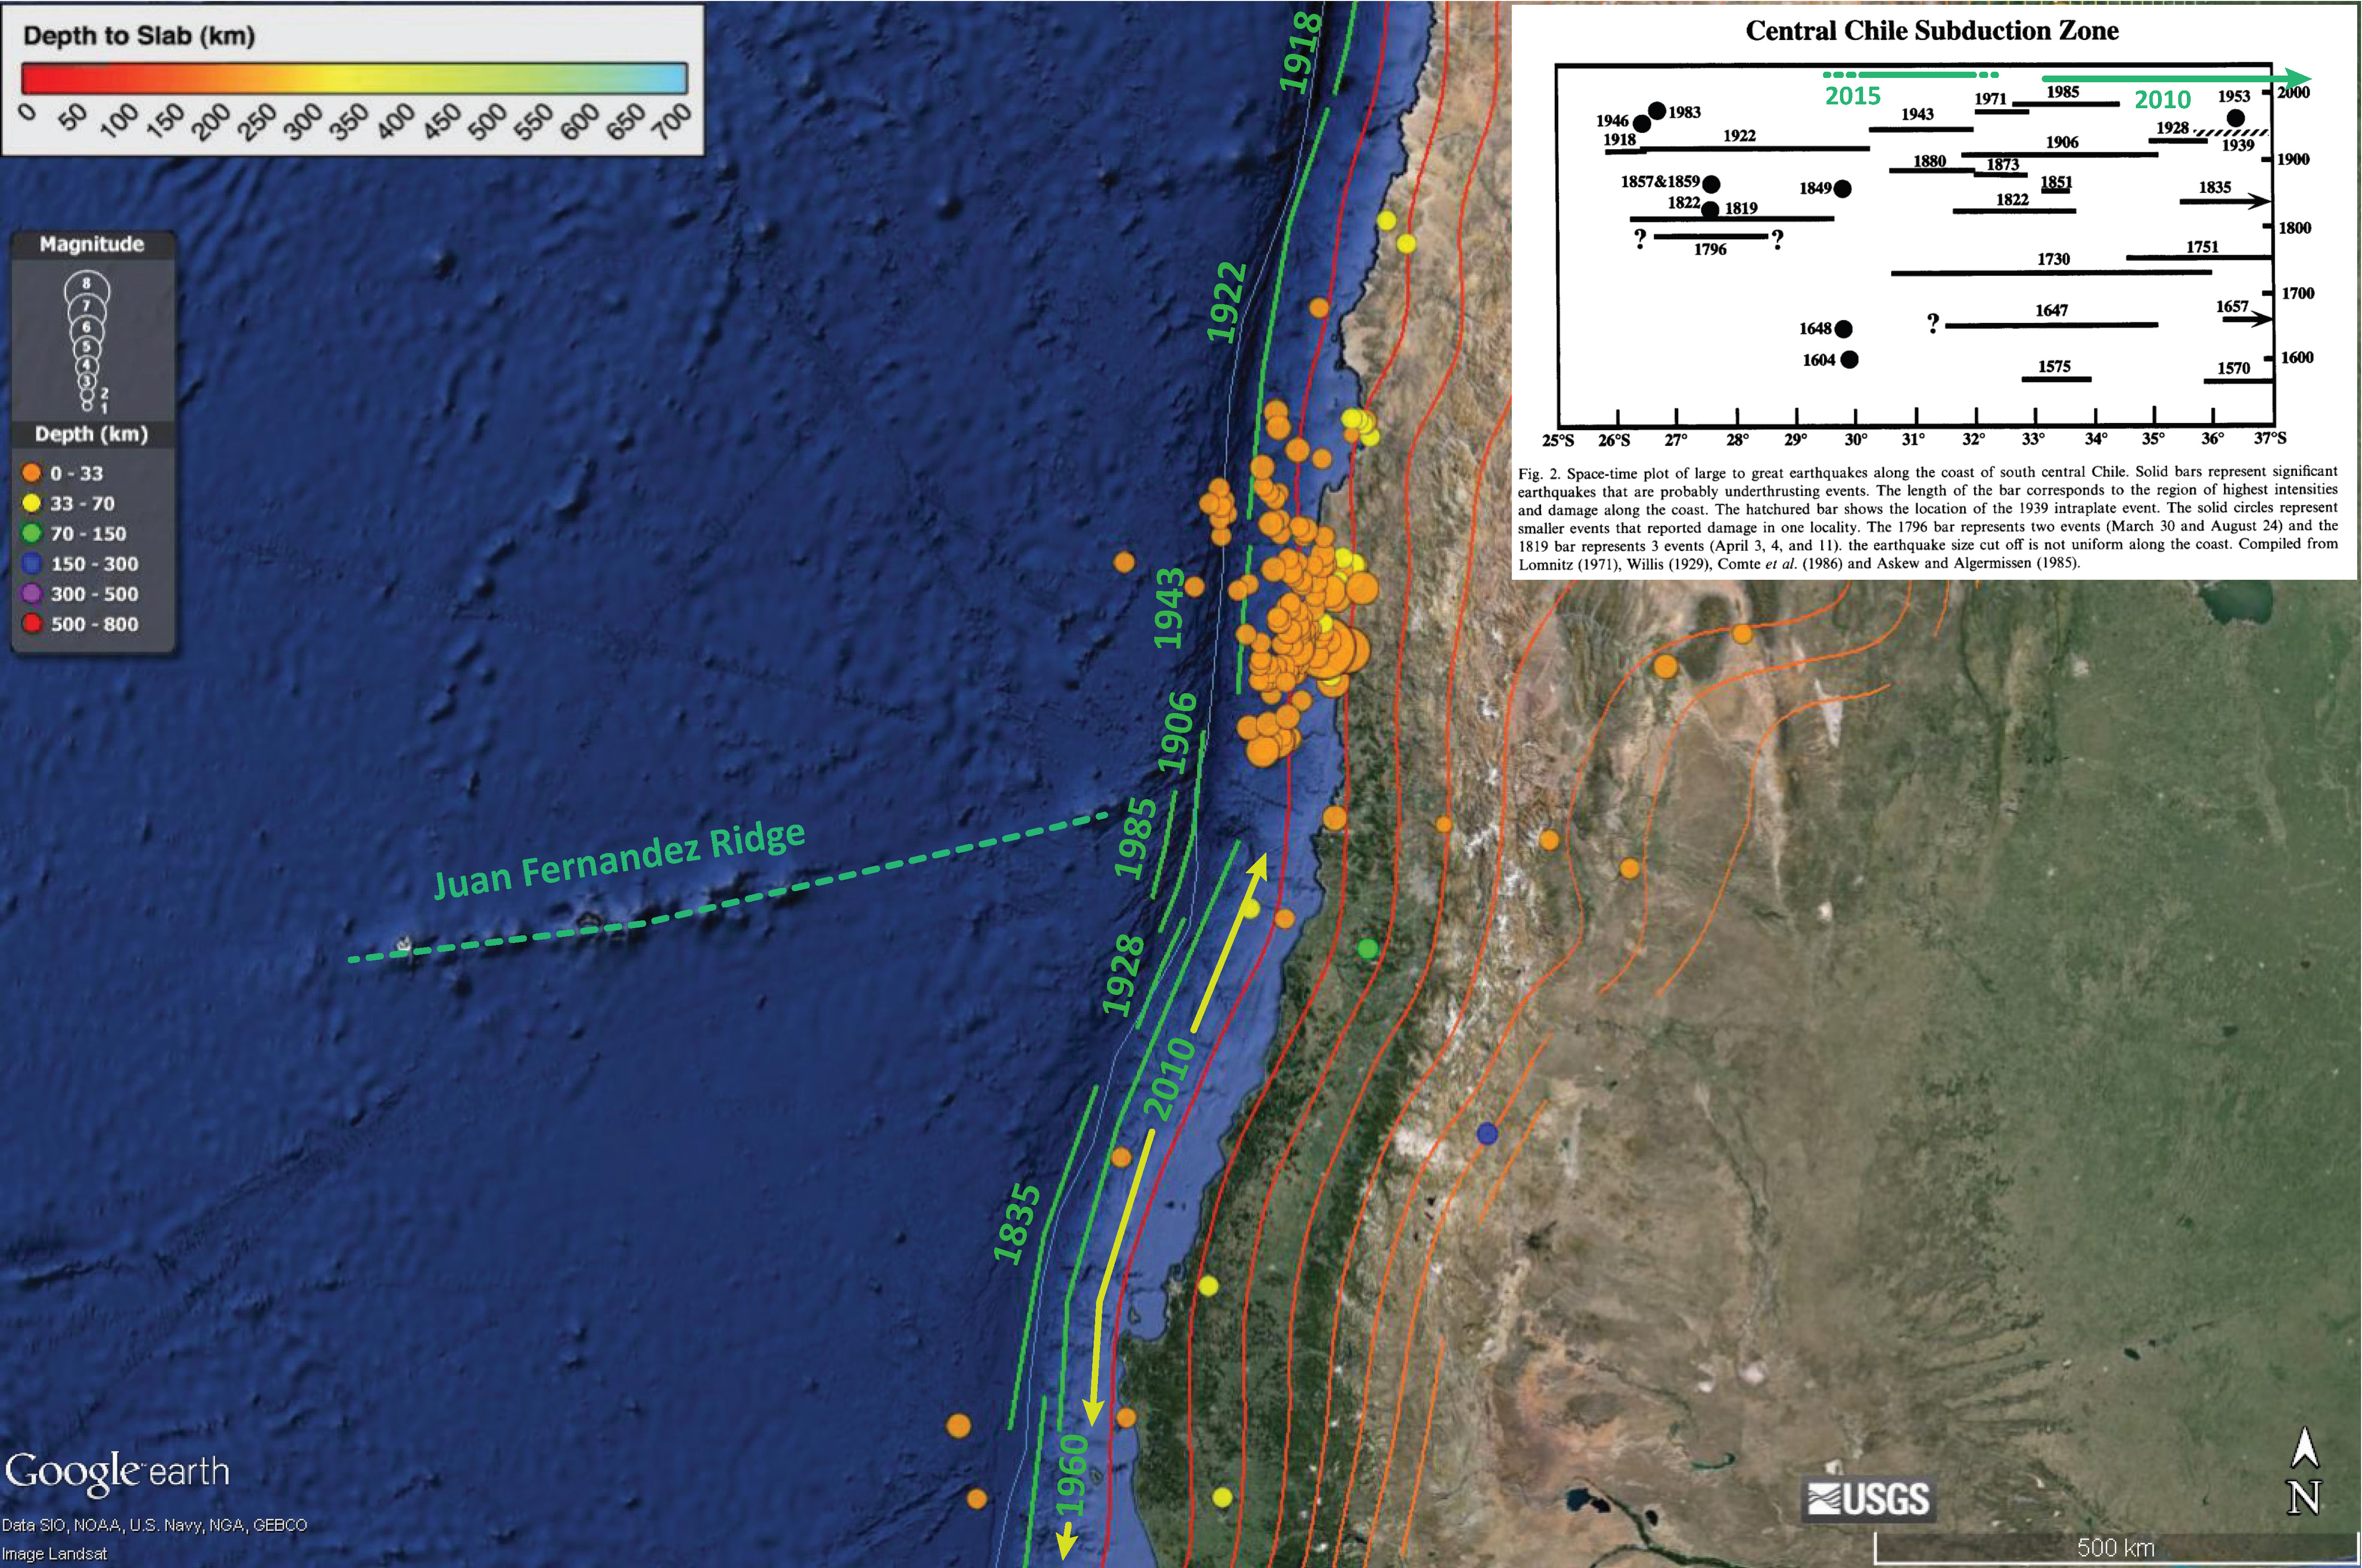
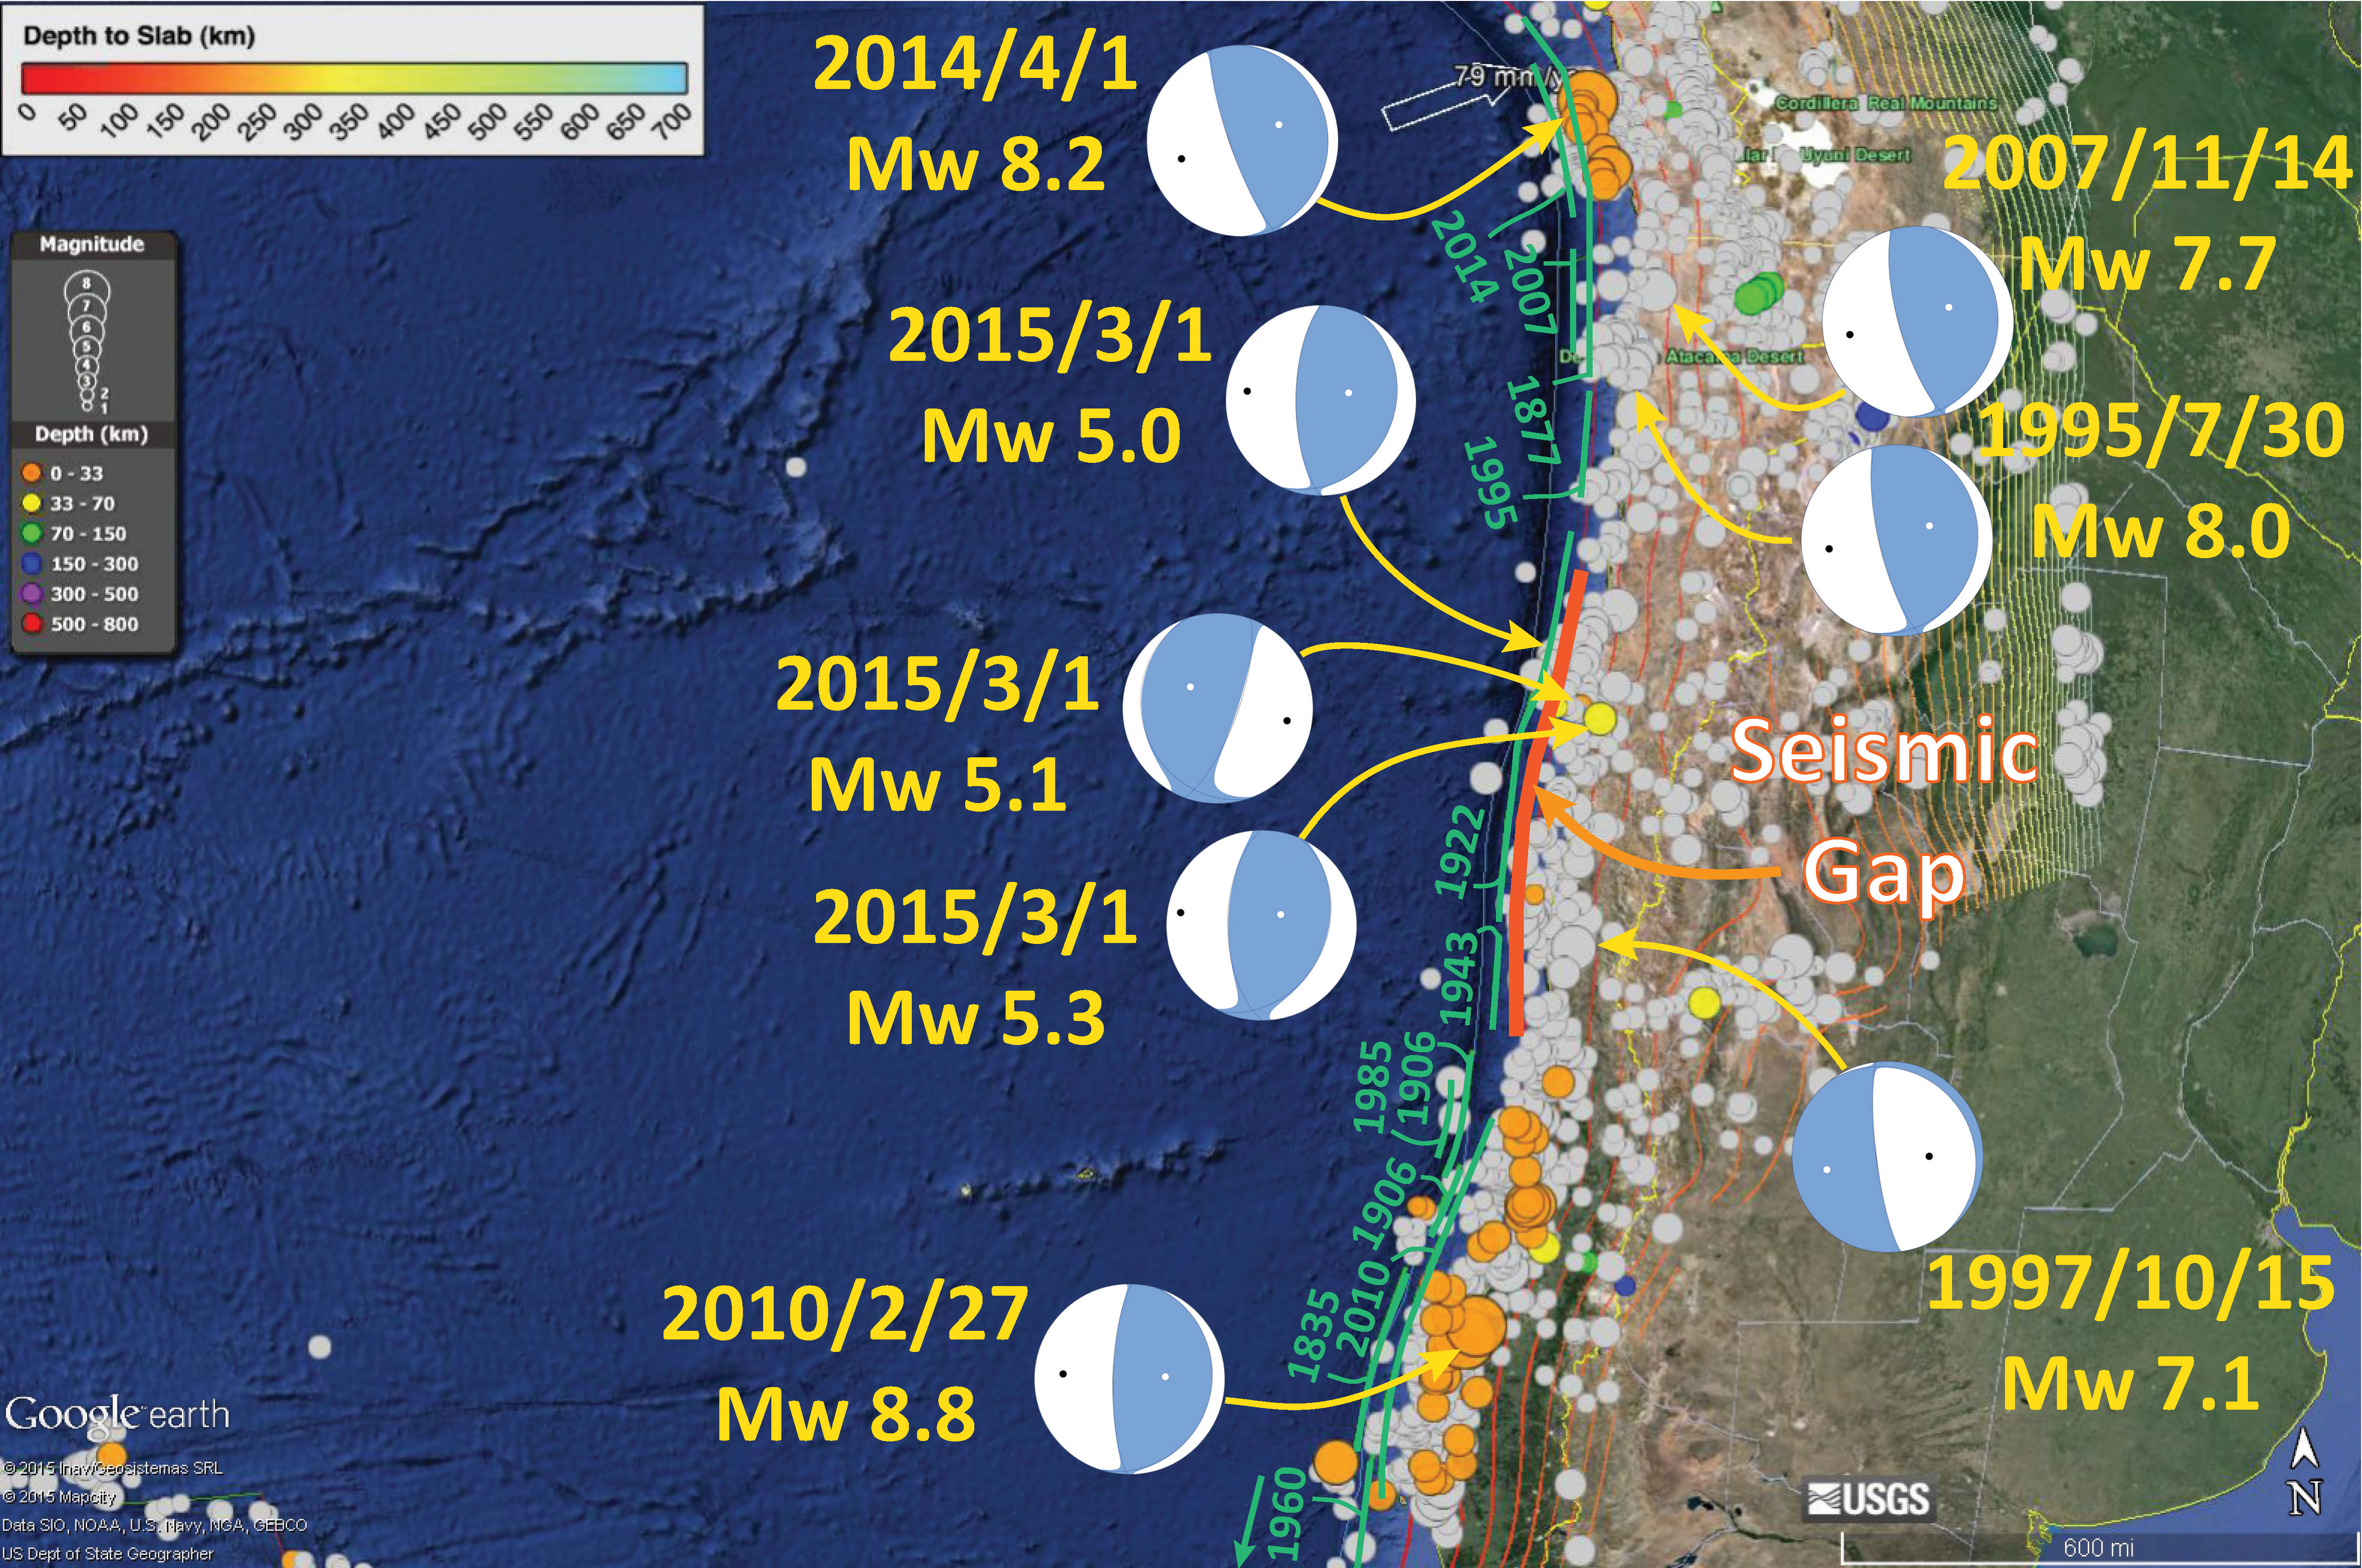
2015.09.16 Illapel, Chile
- First Map
- Second Map
- Third Map (made in November 2015 following a M 6.8 earthquake). Here is the first report and the second report for that M 6.8 earthquake.
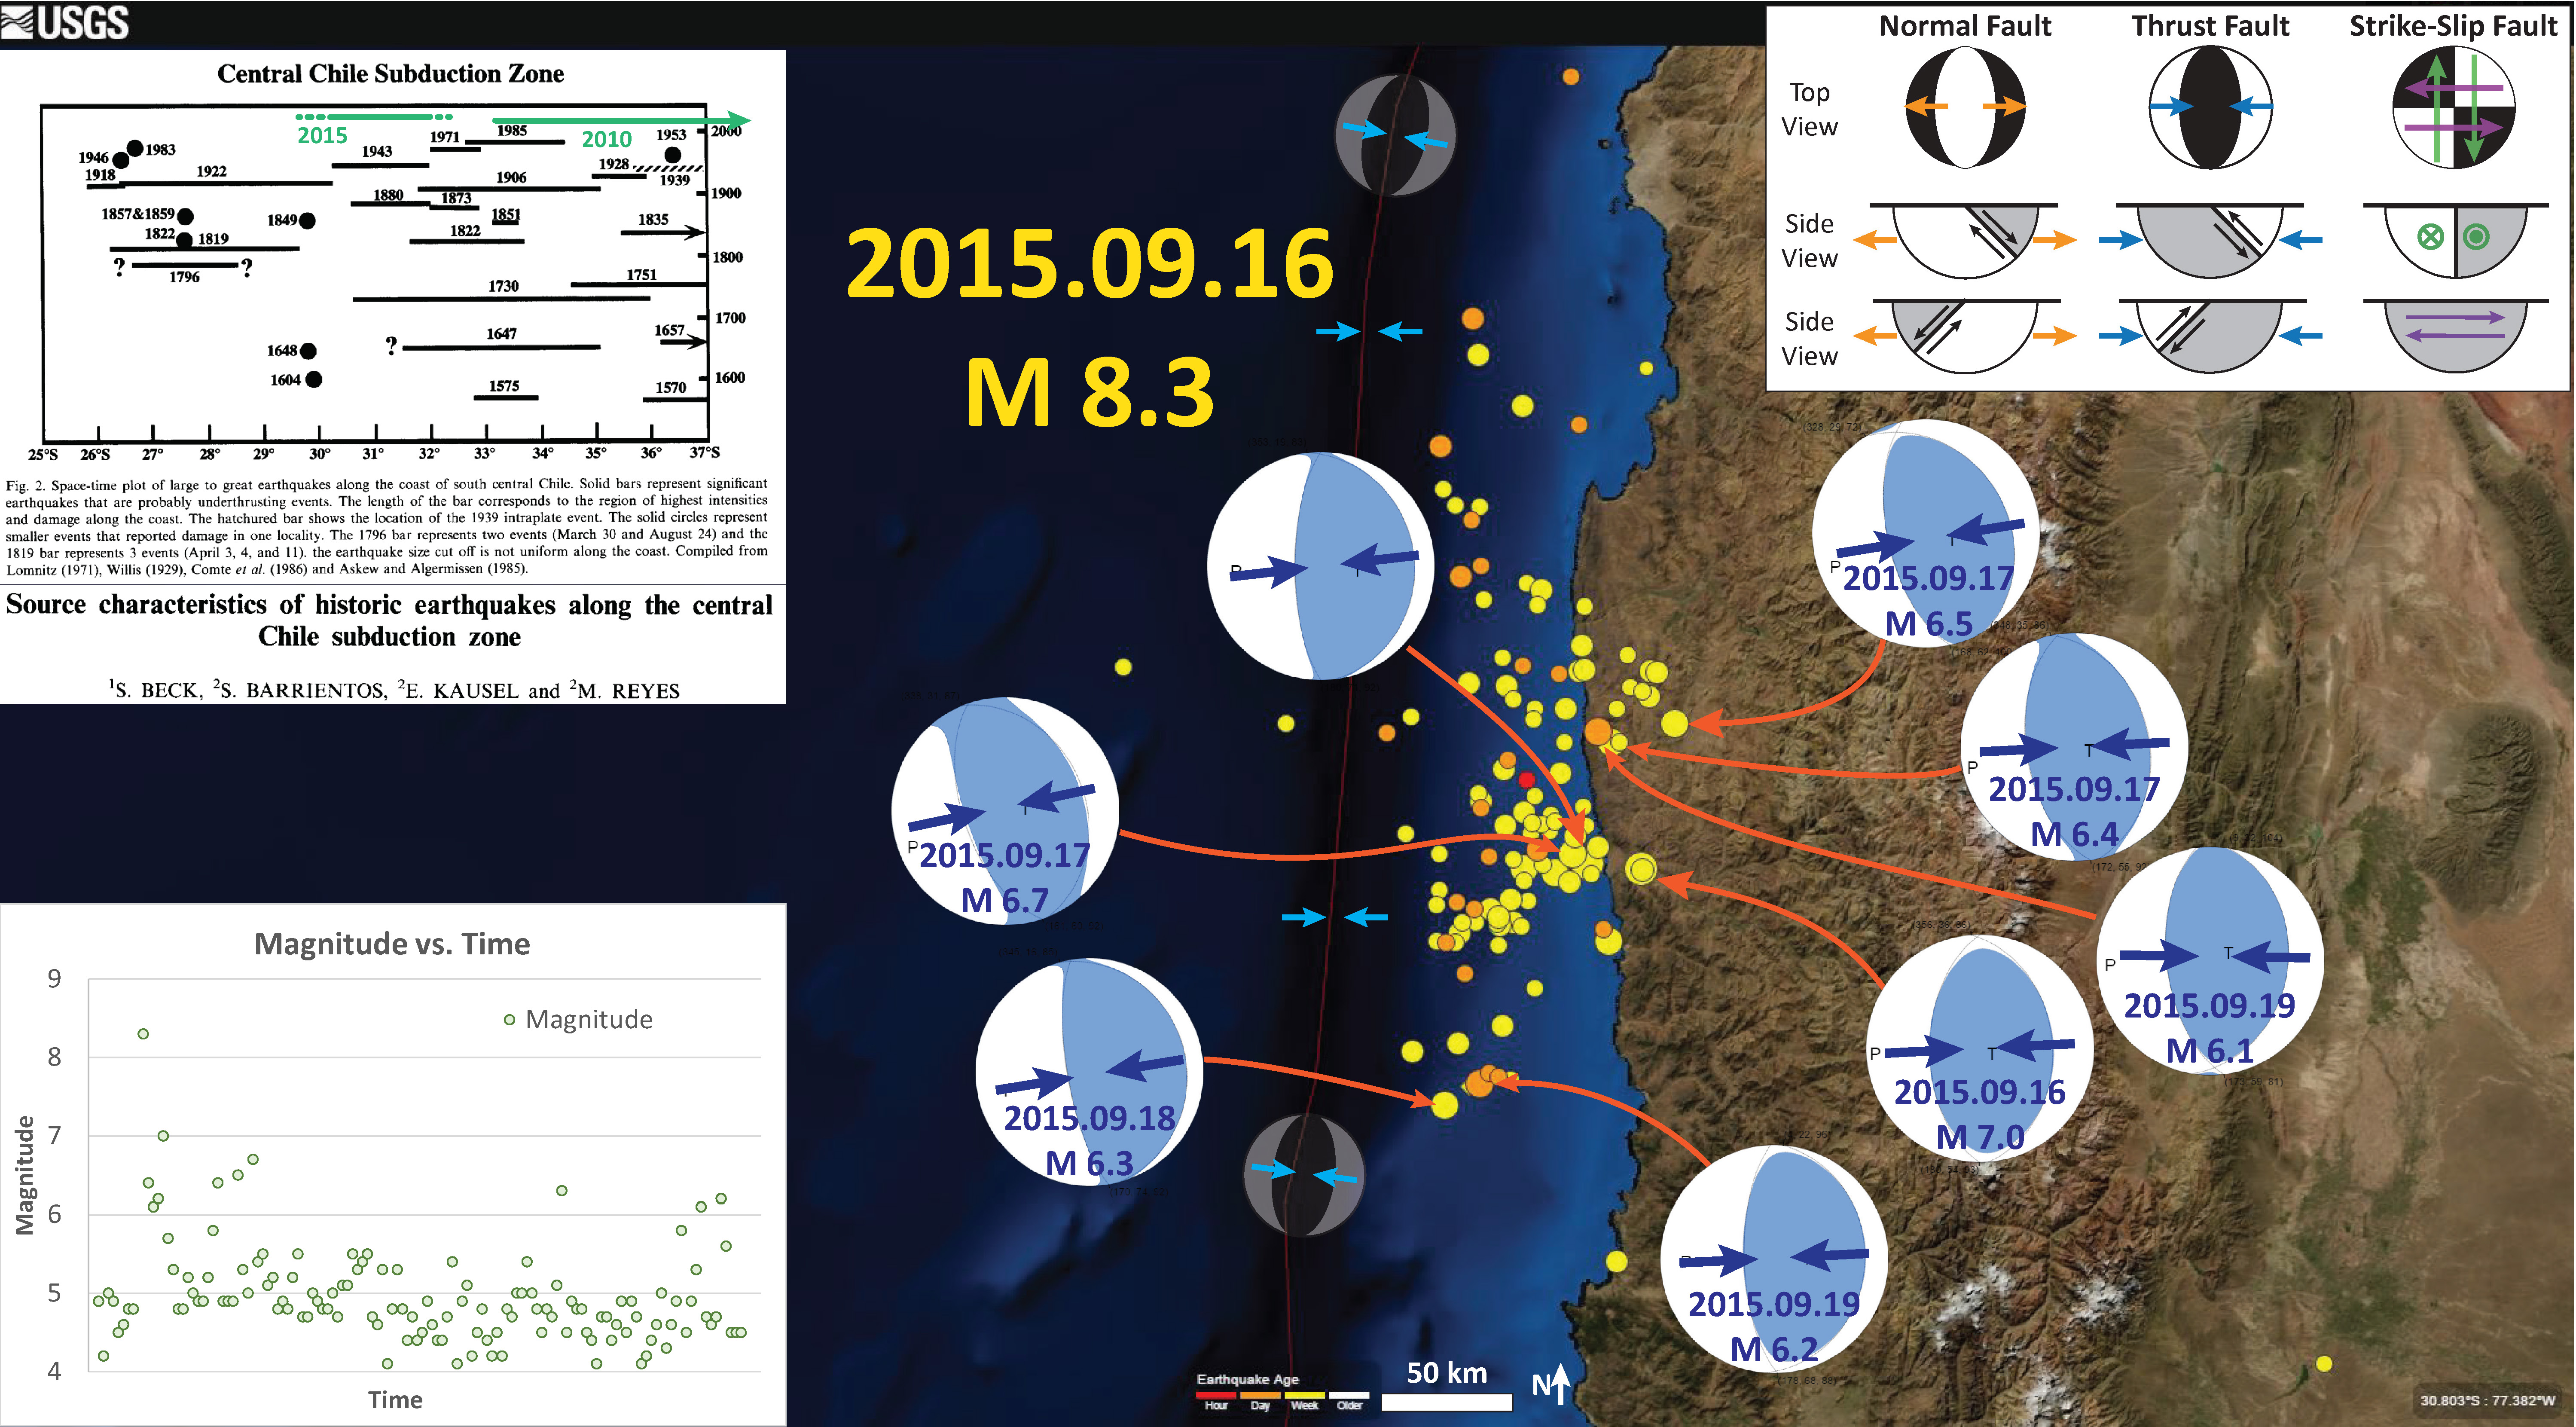
- Regional Historic Earthquake Comparison Map #1
- Large Scale Historic Earthquake Comparison Map
- Regional Historic Earthquake Comparison Map #2 (from here)
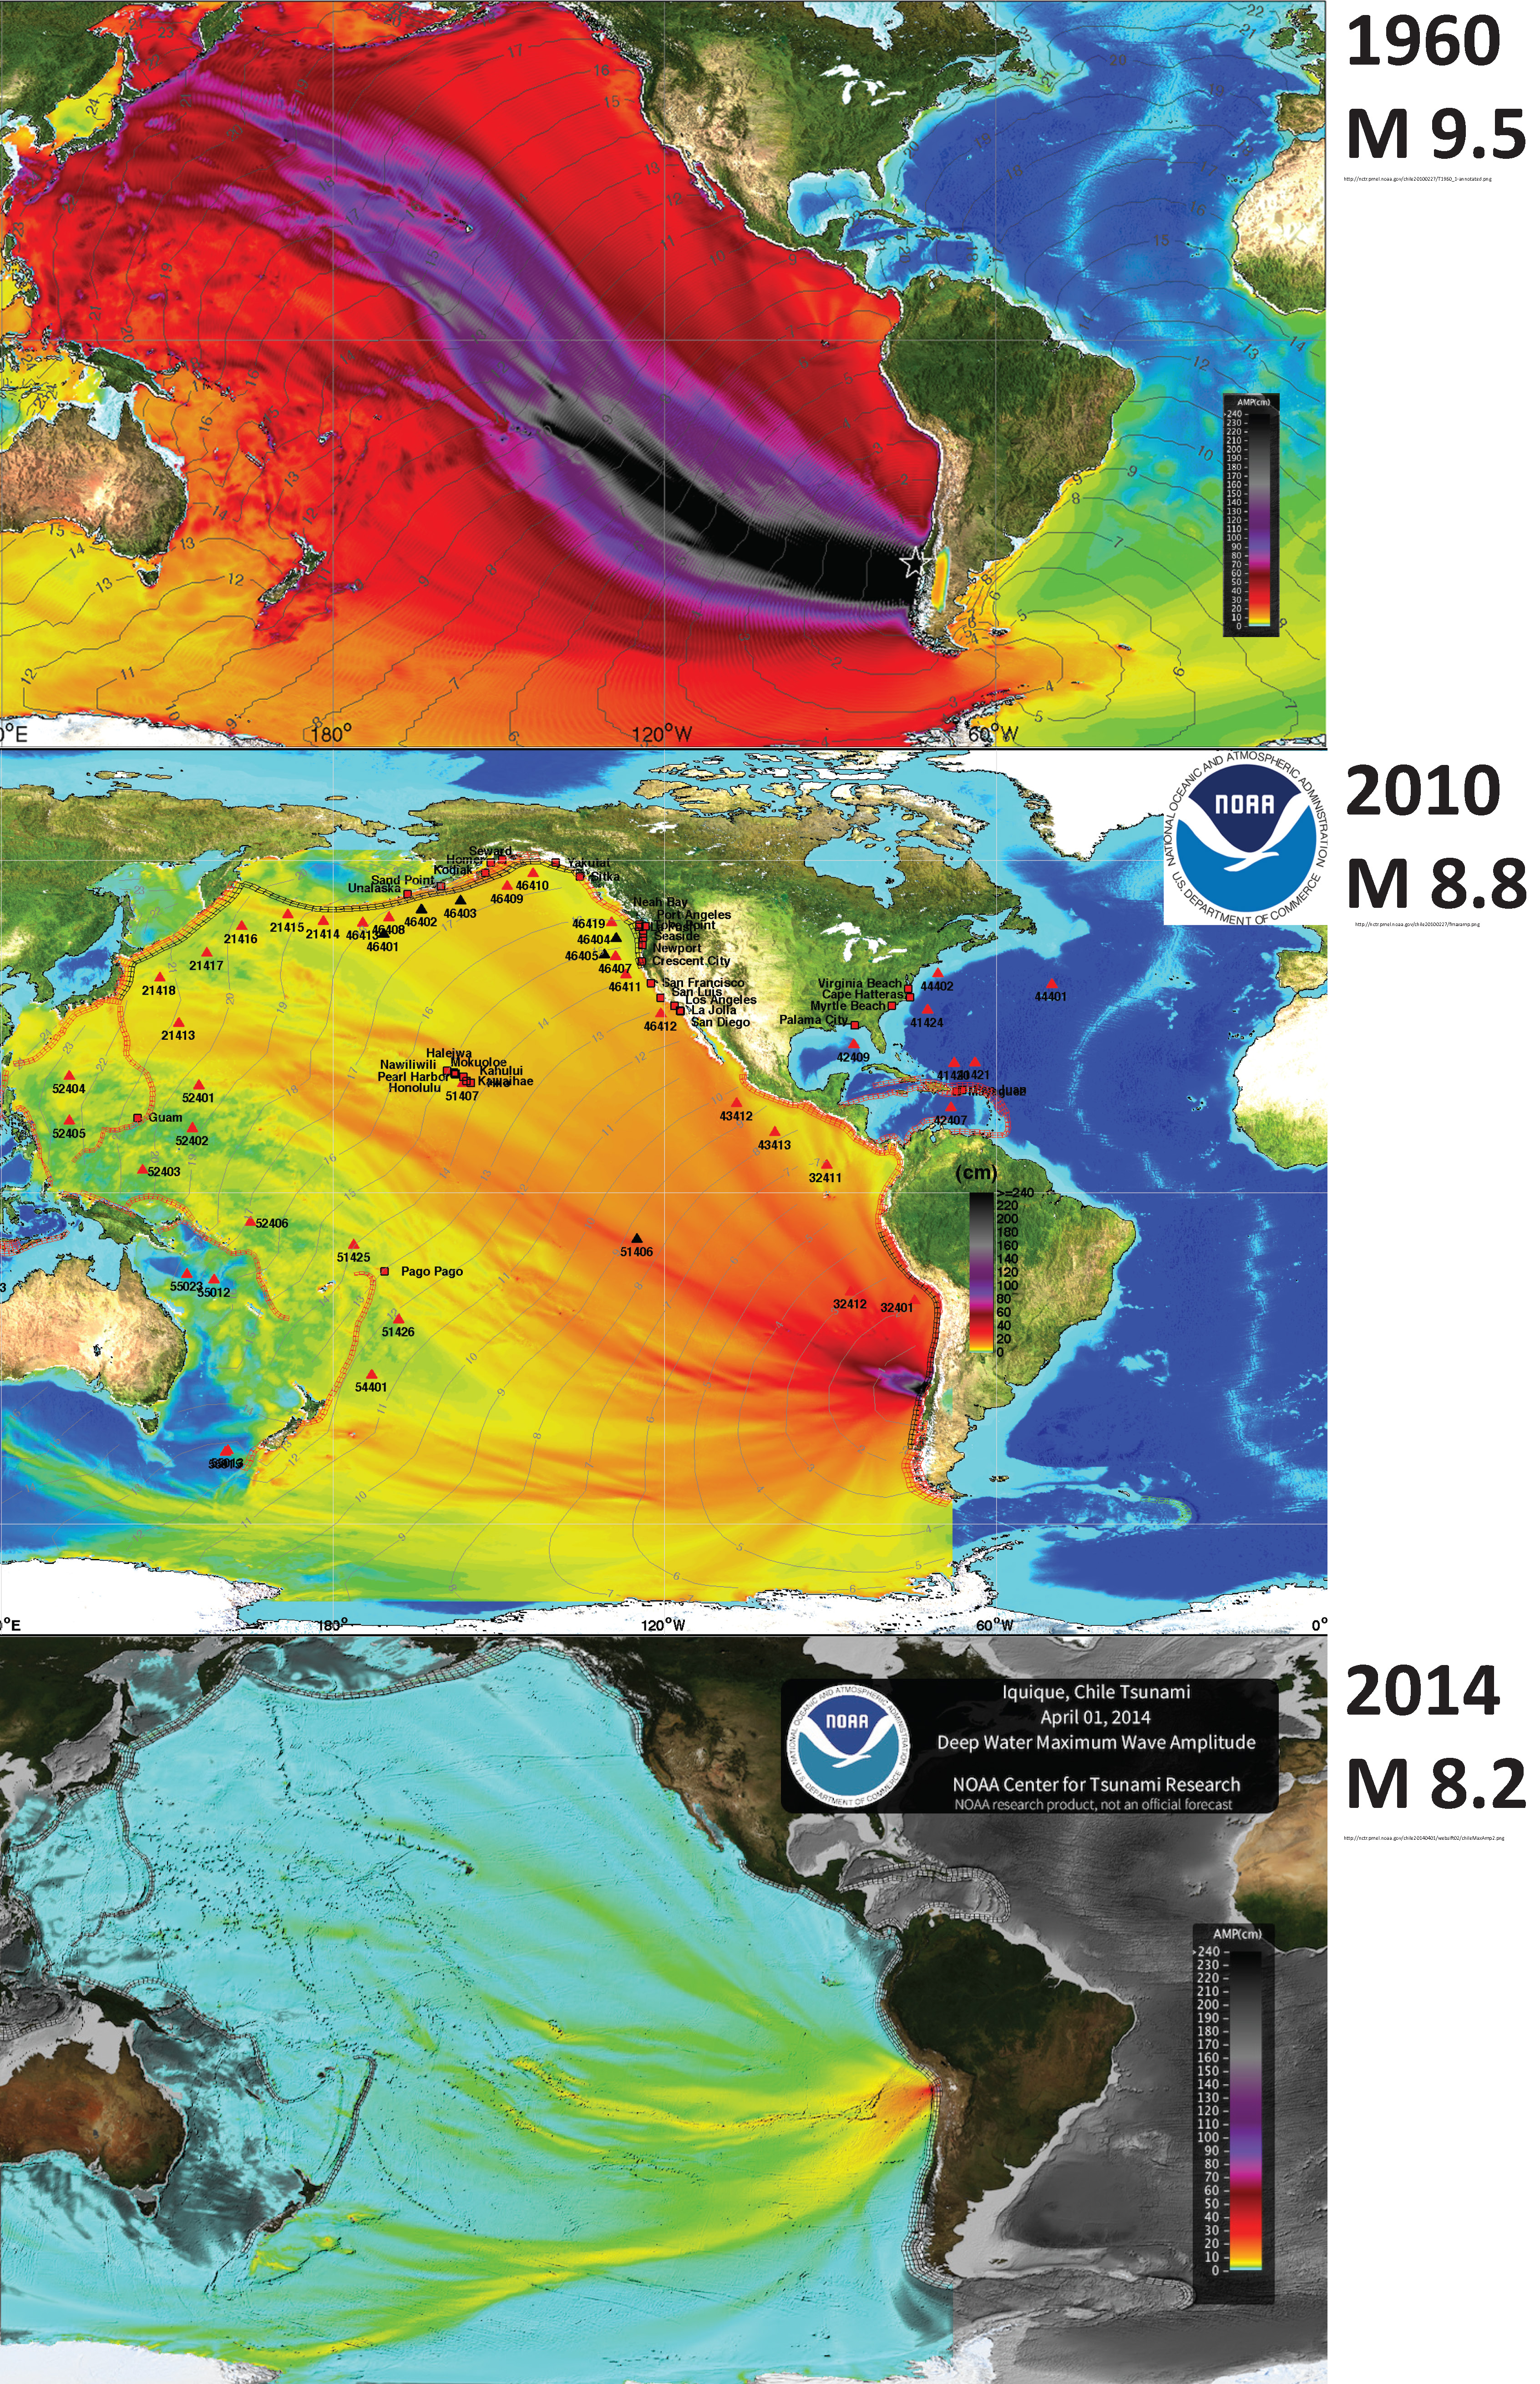
- Historic Tsunami Comparisons
- 1960.05.22 M 9.5 (There is no page for the 1960 earthquake, so this map is located on the 2010 page.)/li>
- 2010.02.27 M 8.8
- 2014.04.01 M 8.2
- 2015.09.16 M 8.3
-
Here are the NOAA Center for Tsunami Research websites for the three tsunamis plotted in the map below, plus the one from 2015.09.16 not shown on the map below.
Here is the map. These three maps use the same color scale. There is not yet a map with this scale for the 2015 tsunami, so we cannot yet make the comparison.
Here is an animation of these three tsunami from the US NWS Pacific Tsunami Warning Center (PTWC). This is the YouTube link.
2015.10.20 Vanuatu

2015.10.26 Afghanistan
2015.11.18 Solomon Islands
2015.11.24 Peru

- Updated Map
2015.12.04 Southeast Indian Ridge

2015.12.07 Tajikistan
-
References:
- See Earthquake Reports for the references in the maps from those individual earthquakes.
1 thought on “Earthquake Report: 2015 Summary M GT 7”