
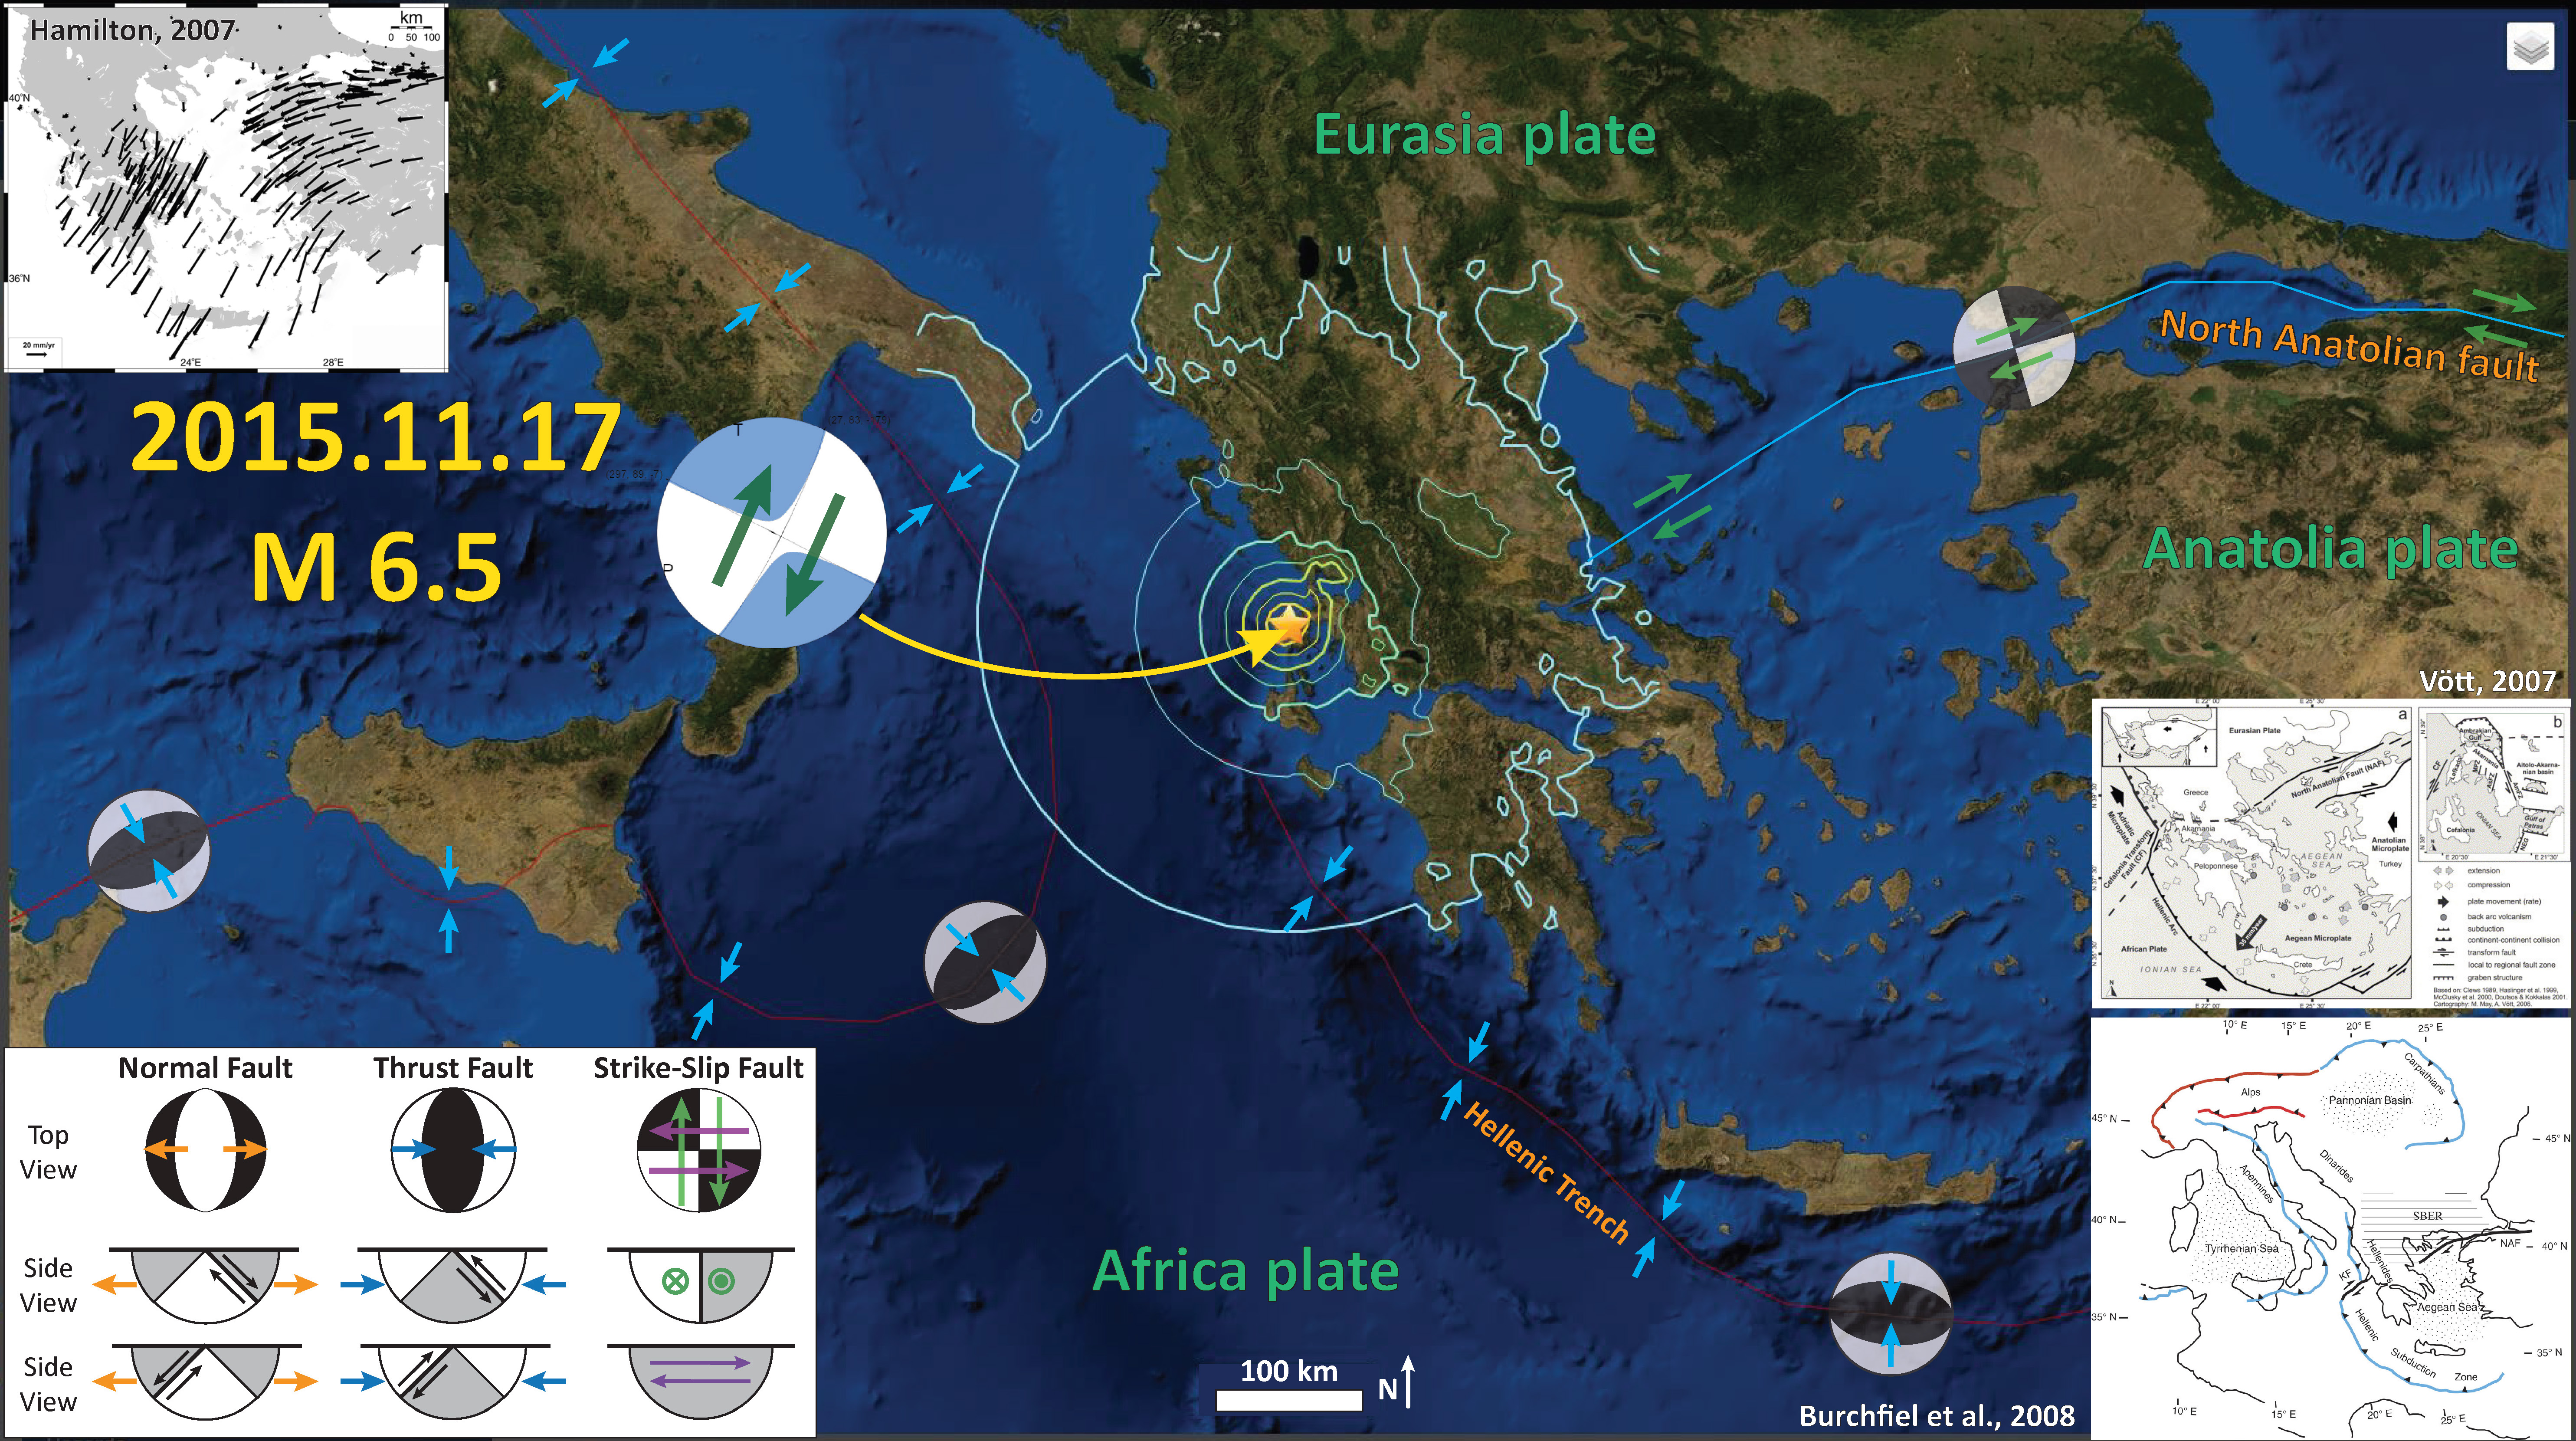
Late last night (my time) there was an earthquake in Greece with a USGS magnitude of M = 6.5. Here is the USGS web site for this earthquake. Greece is at the intersection of a complex configuration of plate boundaries. To the south is a subduction zone that is part of the plate boundary formed between the Africa/India-Australia plate to the south and the Eurasia plate to the north. This plate boundary extends from northeast of Australia to west of Portugal and is responsible for the uplift of the tallest mountains of the world in the Himalayas and the Alps. One of the most active and devastating strike slip faults, the North Anatolian fault (NAF), strikes from the north end of Turkey, through the Aegean Sea, and bifurcates (more than 2 splays) through Greece. Today’s earthquake appears to have ruptured a fault related to the Kefalonia fault (KF), the only strand extension of the NAF that makes it completely through Greece.
Here is a map that shows the earthquake epicenter as a gold star, with ground shaking contours that use the Modified Mercalli Intensity Scale. I include maps that others have produced that help us interpret the regional tectonics. See references below.
I placed a moment tensor / focal mechanism legend in the lower left corner of the map. There is more material from the USGS web sites about moment tensors and focal mechanisms (the beach ball symbols). Both moment tensors and focal mechanisms are solutions to seismologic data that reveal two possible interpretations for fault orientation and sense of motion. One must use other information, like the regional tectonics, to interpret which of the two possibilities is more likely.
Based on the tectonic maps from Vött (2007) and Burchfiel et al. (2008), and the moment tensor, I interpret this earthquake to be related to the Kefalonia fault (KF) system and is a right lateral strike-slip earthquake. I also include, as an inset, the GPS velocity field map from Hamilton (2007; see below).
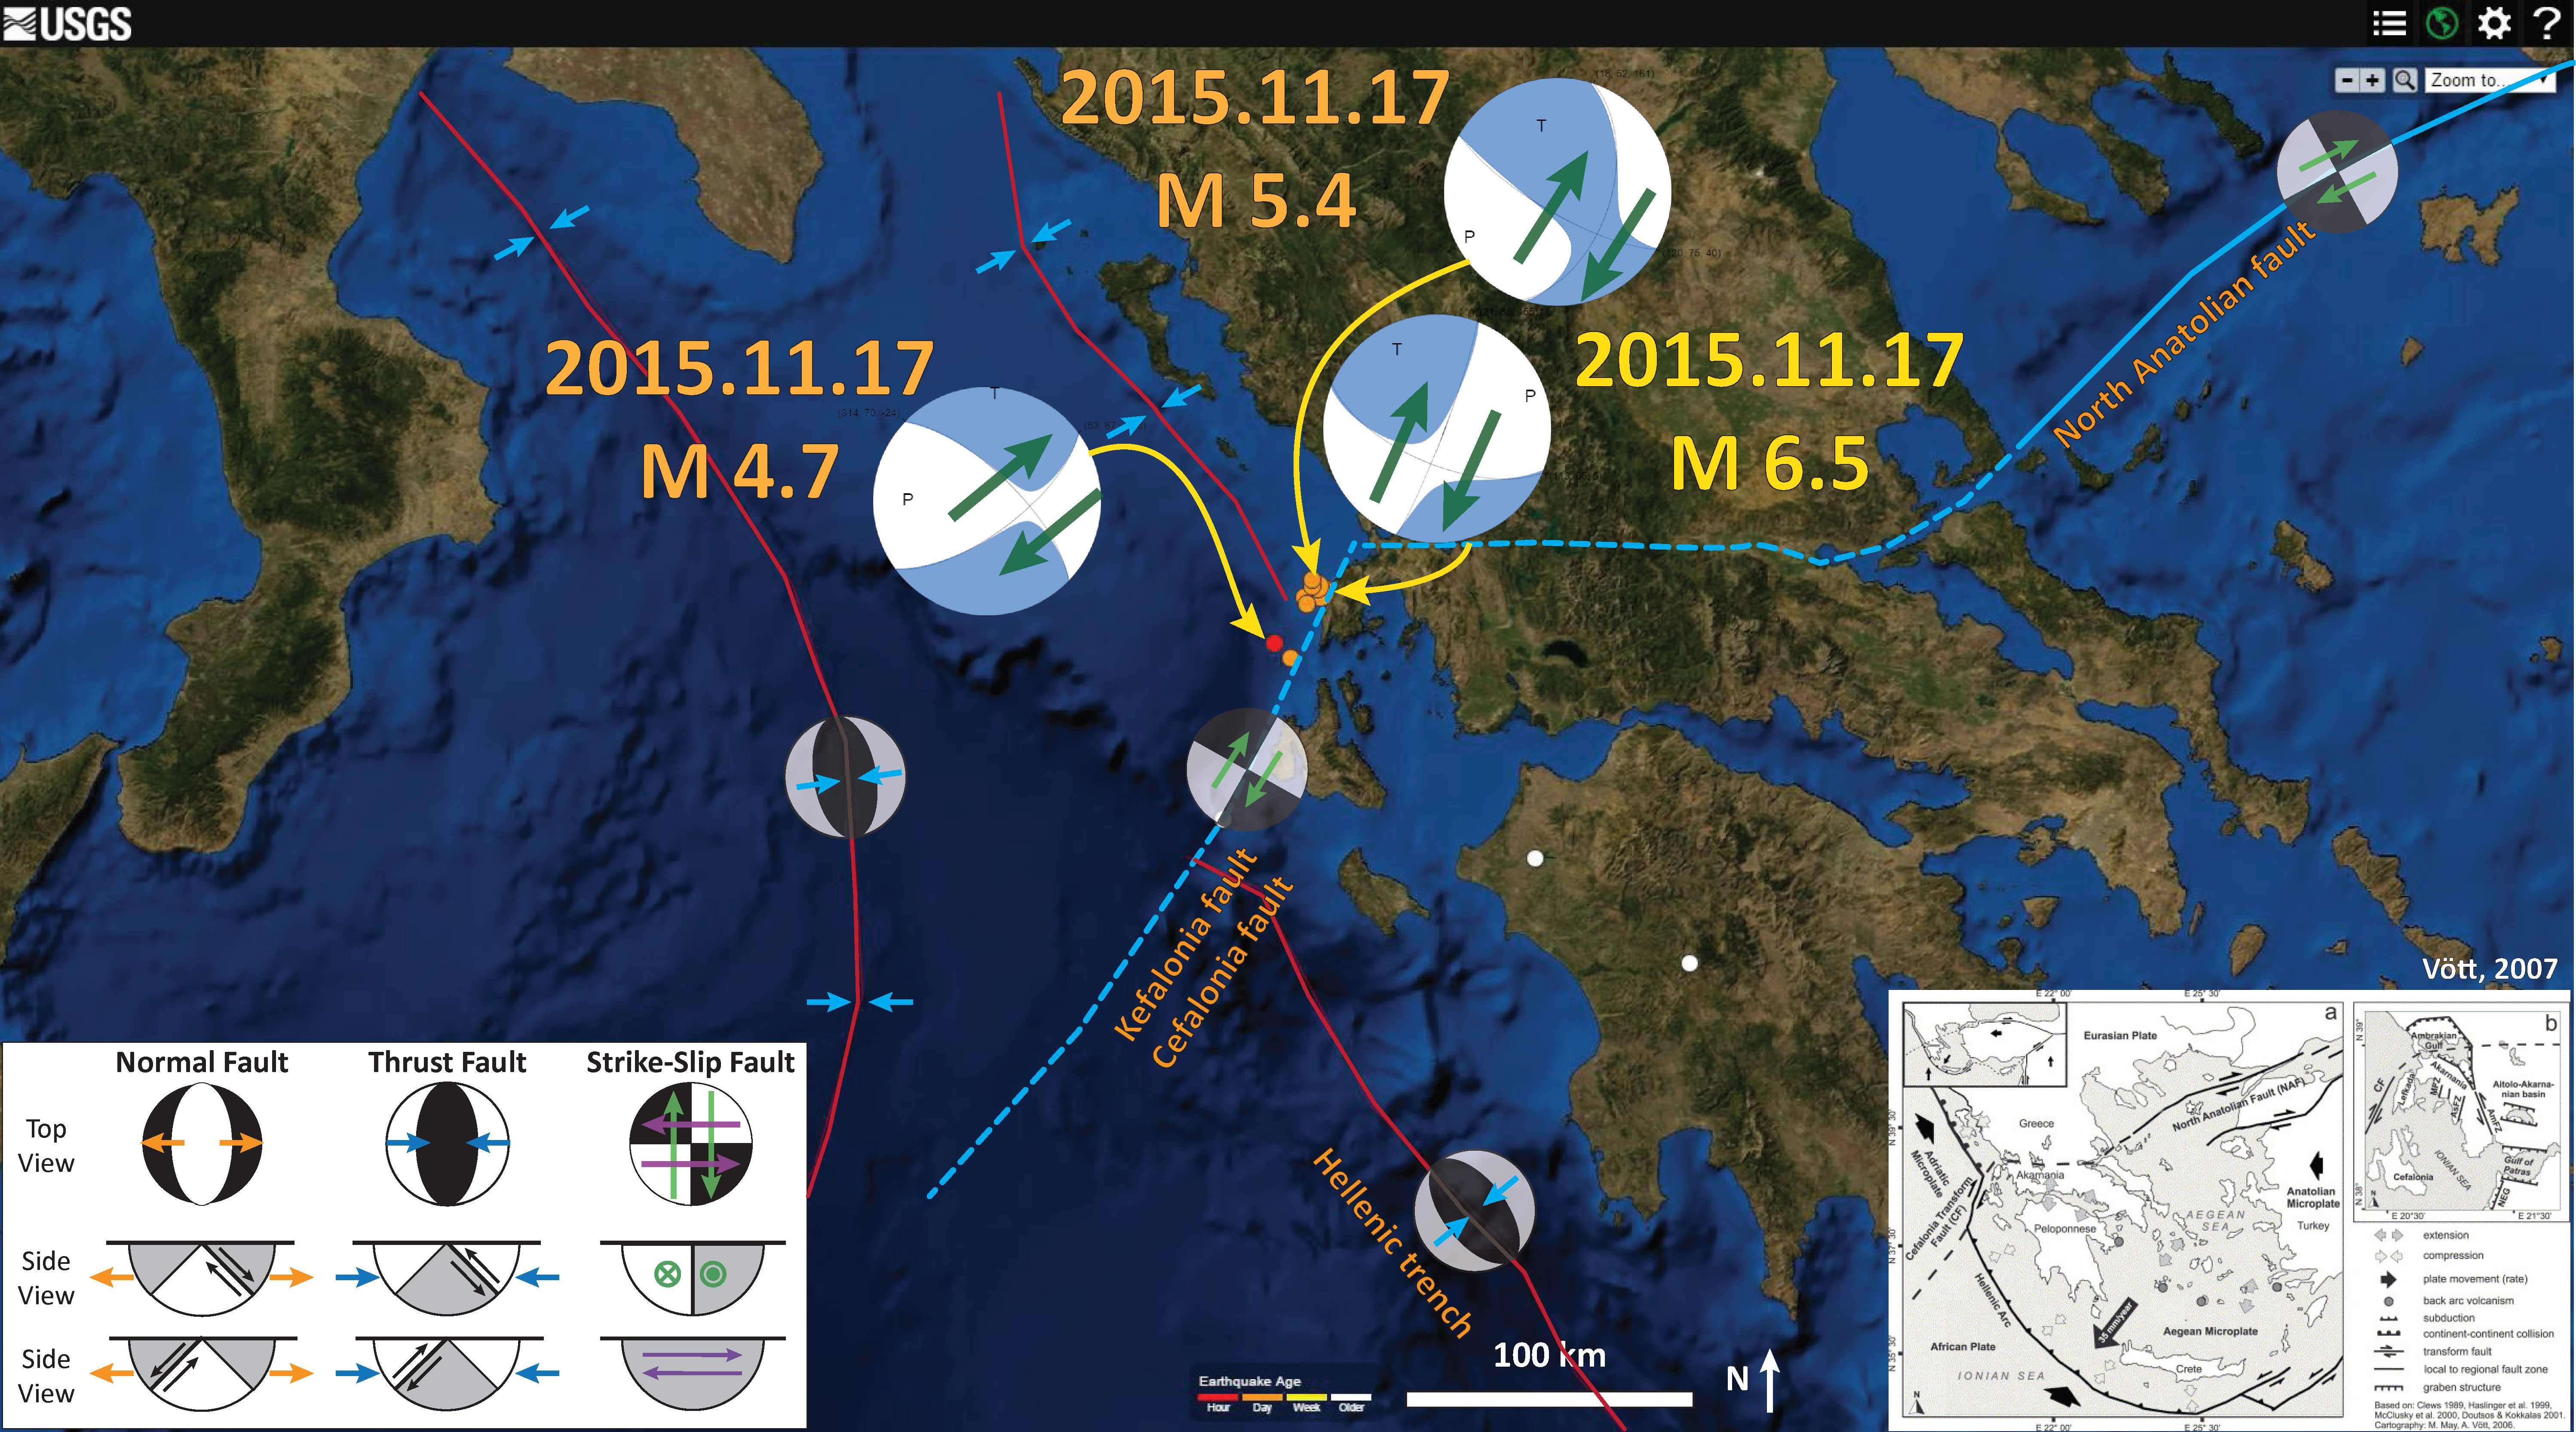
Here is an updated map that shows a couple more aftershocks, at a large (local) scale. I have included the moment tensors for the two largest aftershocks.
-
Here are the USGS web pages for these 3 earthquakes:
- 2015.11.17 M 6.5
- 2015.11.17 M 5.4
- 2015.11.18 M 4.7
This map (Hamilton, 2007) shows GPS vectors that represent secular motion of locations throughout this region. Note how the vectors on the lower part of the figure show larger motion to the west. At the latitudinal location of the NAF is where the vectors show a large change in magnitude. This shows how the NAF motion extends into Greece and is evidence for why the KF is the single through going fault system. I include the author’s figure caption below the figure as a blockquote.

Global Positioning System (satellite geodesy) velocity field of Aegean and Turkish region relative to internally stable northwest Eurasia. Velocities in the overriding plate increase along curving trajectories toward a south-facing subduction system. The trench is not shown but trends near SW and SE corners of map area, is convex southward, and is ~250 km south of Crete, the long island at bottom center. The overriding plate is being extended toward the retreating hinge (not shortened and crumpled against a fixed hinge), the free edge, as it is extruded between the converging Arabian and European plates. High-strain zones of strike slip and extension, not marked here, outline miniplates of lesser internal determination (Nyst and Thatcher, 2004). Other unmarked arc features: the forearc ridge (the crest of the active accretionary wedge) is ~100 km offshore from Peloponnisos (large peninsula of southern Greece, left center), 150 km south of Crete, and 100 km south of Turkish coast at far right; the magmatic arc is convex southward, and is 150 km north of Crete at closest. This image was slightly modified from a figure provided by Wayne Thatcher; cf. Nyst and Thatcher (2004, their Fig. 2).
There was a tsunami recorded, possibly from an observed landslide. The Eurpoen Commission hosts tide gage data online and here is the website for the tide gage in Crotone, Italy.
Here is the map that shows the location of this gage.

Here is the tide gage record.

Here is a photo that shows a landslide triggered by this earthquake. This was taken by a photographer for meteonews. This photo was posted on the International Tsunami Information Center listserv.

Here is a map from the University of Athens that shows the seismicity aligning with the KF.

Based on the PAGER estimate (an estimate generated by a numerical model that estimates ground shaking and the possible damage to people and their belongings), this earthquake could lead to up to 10 fatalities (30% probability). Also, there is a 34% probability that there is damage to their infrastructure of between 10 and 100 million USD.

For comparison, here is the map that shows results from the USGS “Did You Feel It?” online reporting web site. This is based upon real observations, not just modeled estimates (as the PAGER is above). For larger earthquakes, fault models are constructed and models are re-run to improve the PAGER estimates, but not in this case.

Here is another way of comparing the difference between the model based estimates and the real observations. Below is a plot showing the attenuation of shaking intensity with distance from the earthquake. The green and orange lines are the results of from the numerical model and the blue dots are the results from the observational reports. There is not a very good relation between these two data sets, likely because there is a paucity of observational data. But there assumptions about fault geometry of the numerical model also plays a big role as this model assumes a point location for the earthquake, while earthquakes are not point sources of ground motion.

-
References:
- Burchfiel, B.C., et al., 2008. Evolution and dynamics of the Cenozoic tectonics of the South Balkan extensional system in Geosphere, v. 4, no. 6, doi: 10.1130/GES00169.1, p. 919-938.
- Hamilton, W.B., 2007. Driving mechanism and 3-D circulation of plate tectonics, in Sears, J.W., Harms, T.A., and Evenchick, C.A., eds., Whence the Mountains?
Inquiries into the Evolution of Orogenic Systems: A Volume in Honor of Raymond A. Price: Geological Society of America Special Paper 433, p. 1–25, doi:
10.1130/2007.2433(01). - Nyst, M., and Thatcher, W., 2004, New constraints on the active tectonic deformation of the Aegean: Journal of Geophysical Research, v. 109, no. B11, paper 406, 23 p., doi: 10.1029/2003JB002830.
- Vött, A., et al., 2007. Late Holocene Tsunami Imprint on Actio Headland at the entrance to the Ambrakian Gulf in Mediterranee, v. 108, p. 43-57.
6 thoughts on “Earthquake Report: Greece!”