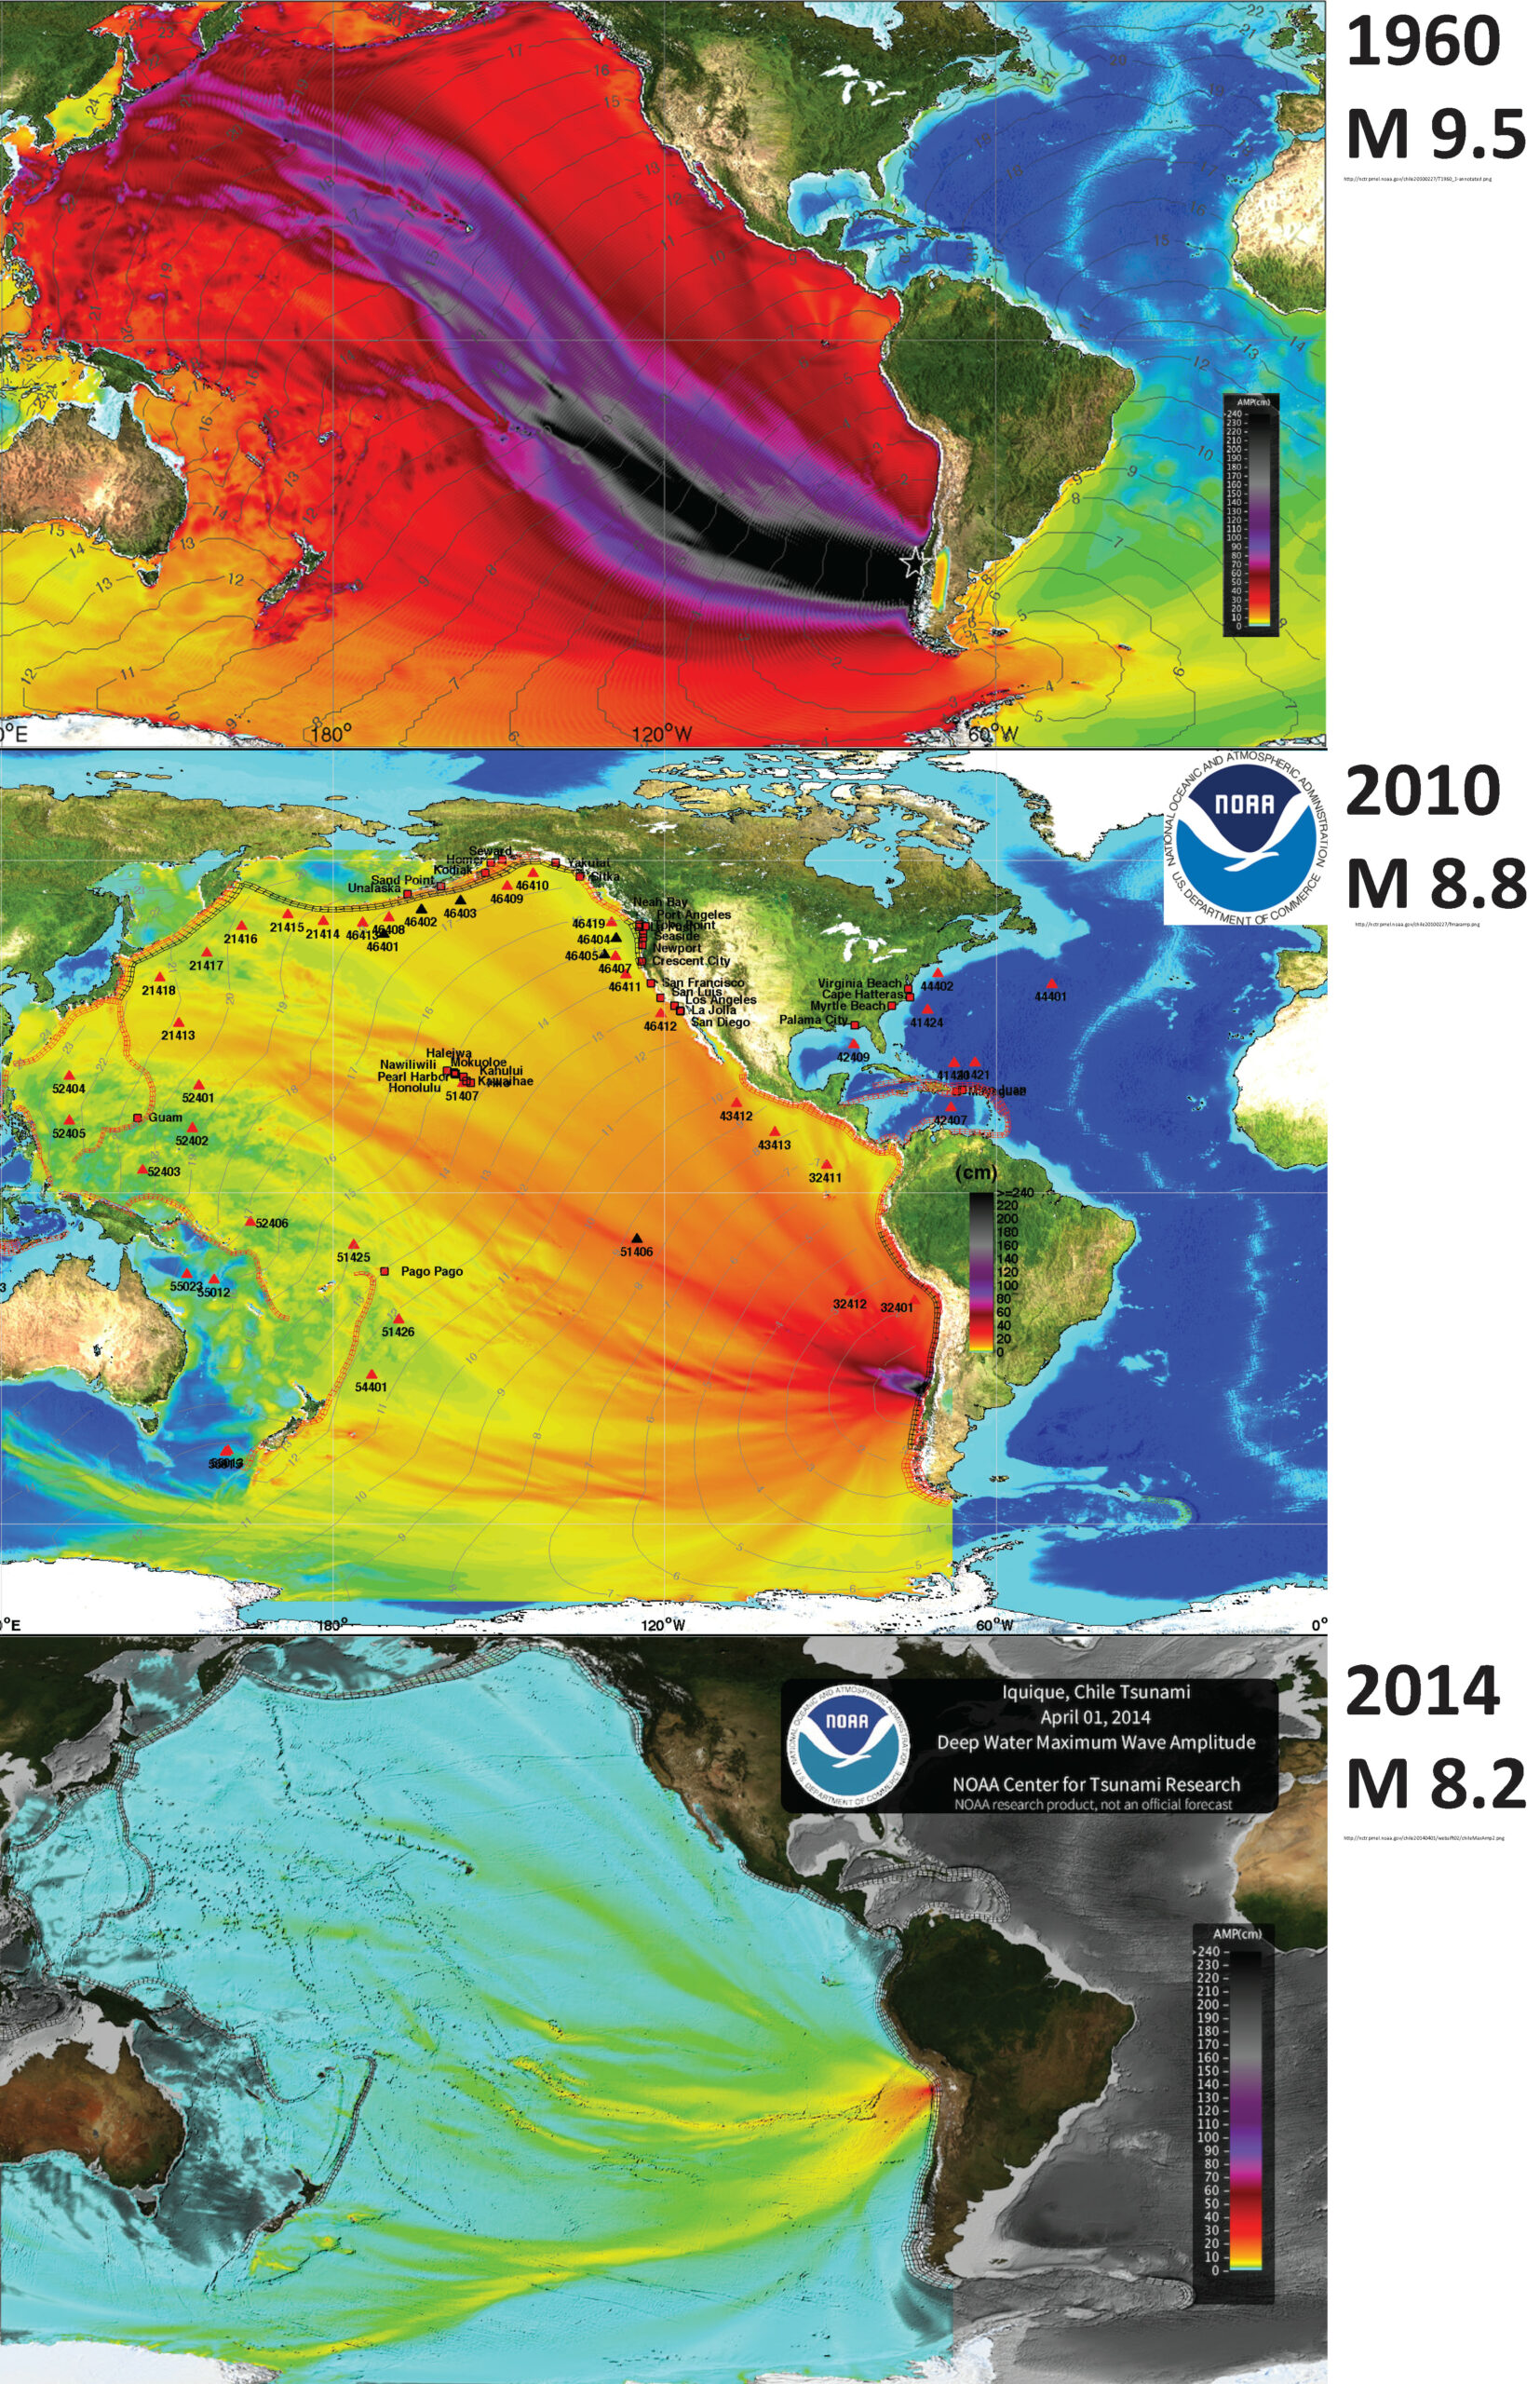
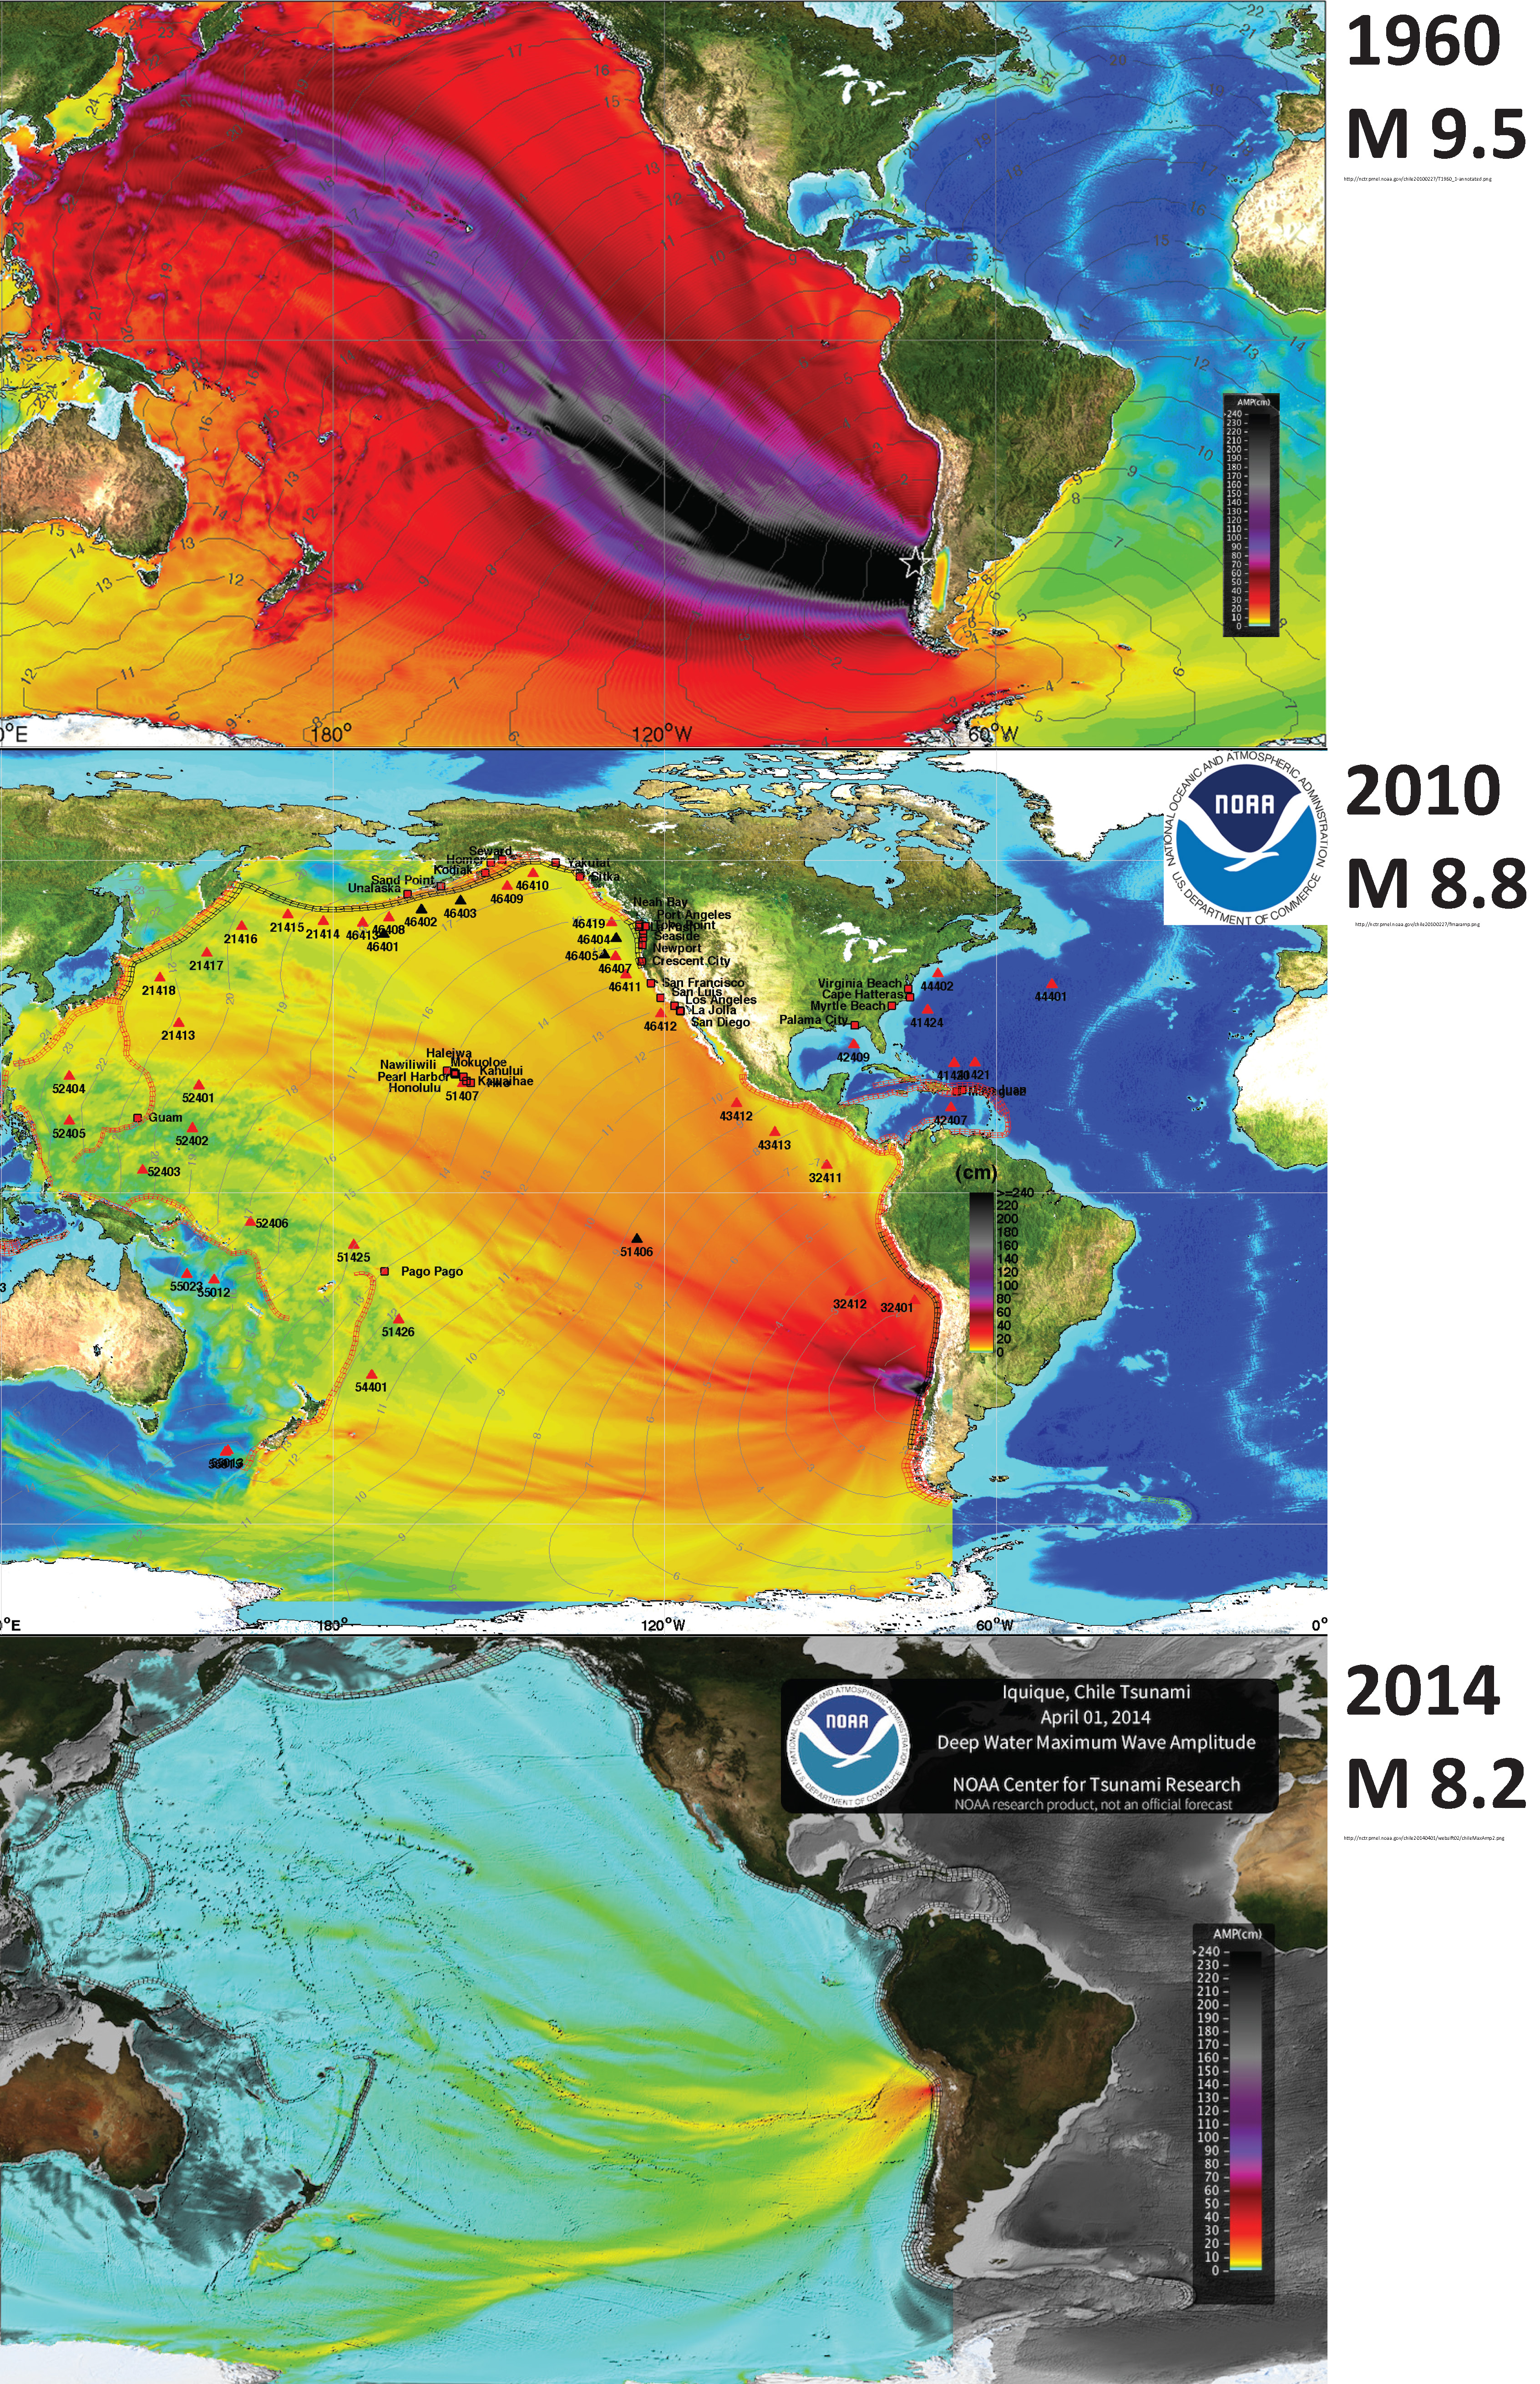
Here are three tsunami wave amplitude models from NOAA for three Great (magnitude > 8.0) earthquakes in Chile.
-
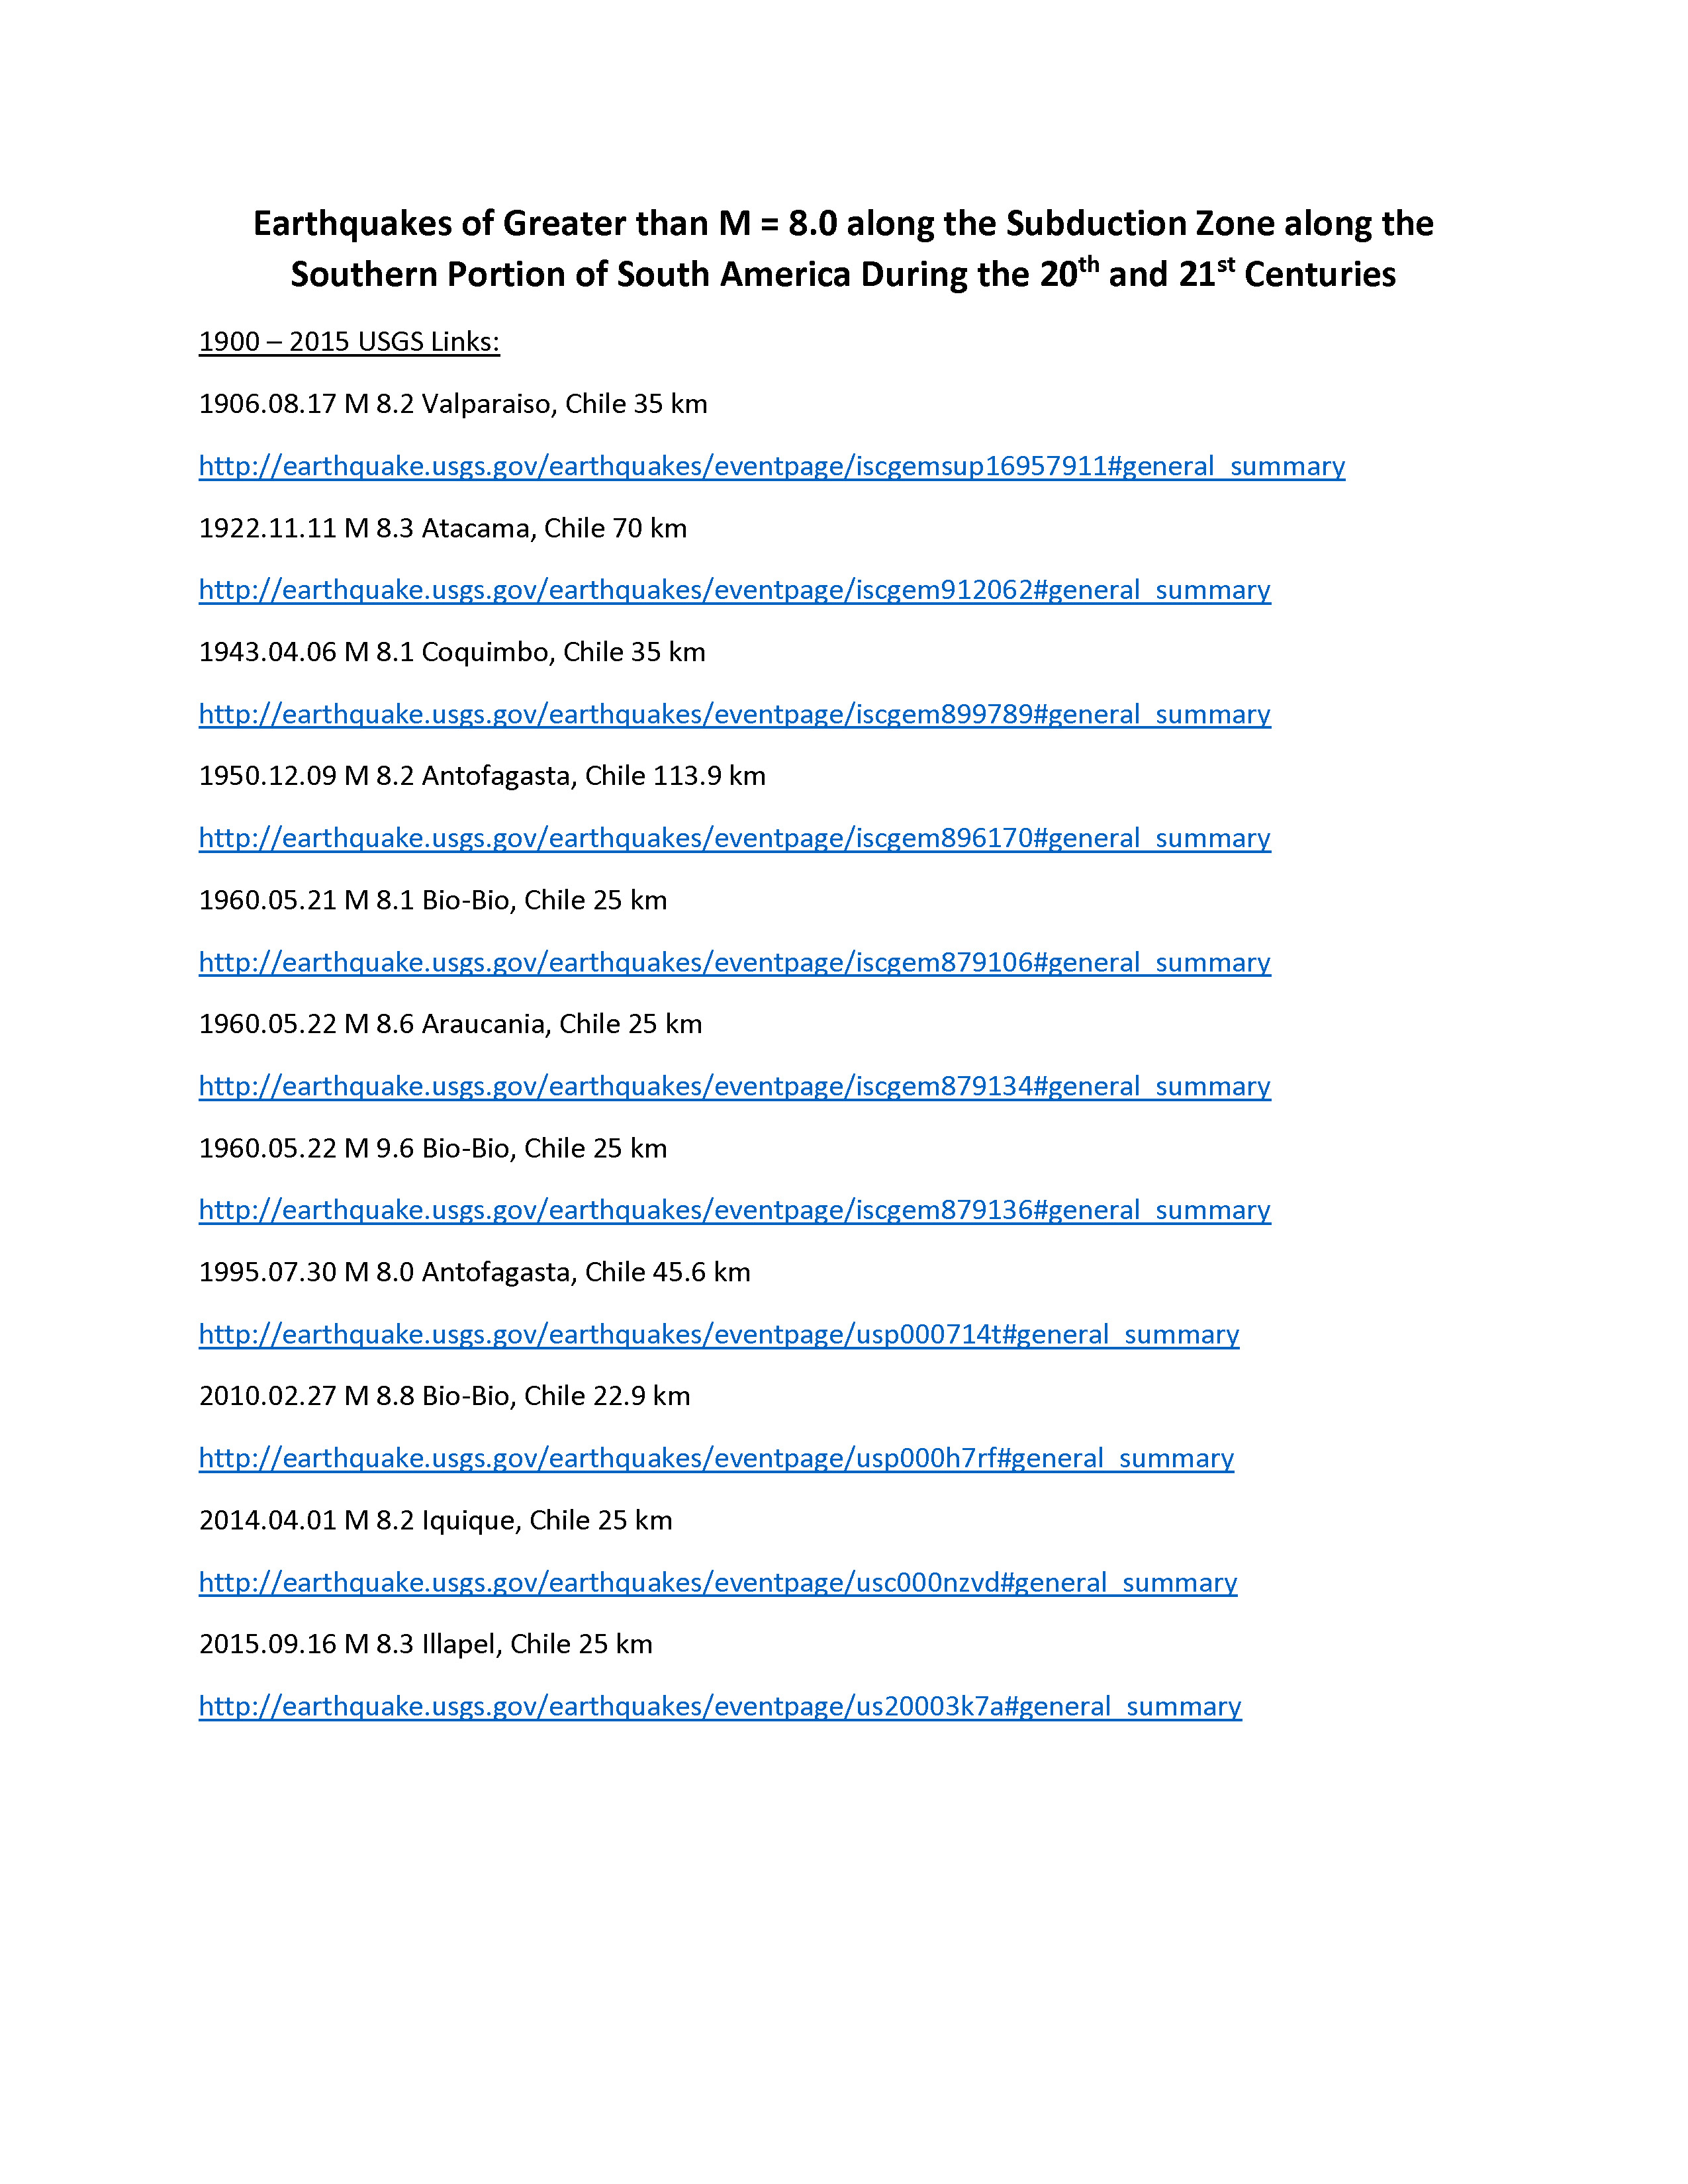
Here are the USGS websites for the three earthquakes that generated these earthquakes, plus the one from 2015.09.16 not shown on the map below. The USGS magnitudes are listed.
- 1960.05.22 M 9.6 Bio-Bio, Chile 25 km (the USGS lists the M as 9.6, while most everyone else states M = 9.5
- 2010.02.27 M 8.8 Bio-Bio, Chile 22.9 km
- 2014.04.01 M 8.2 Iquique, Chile 25 km
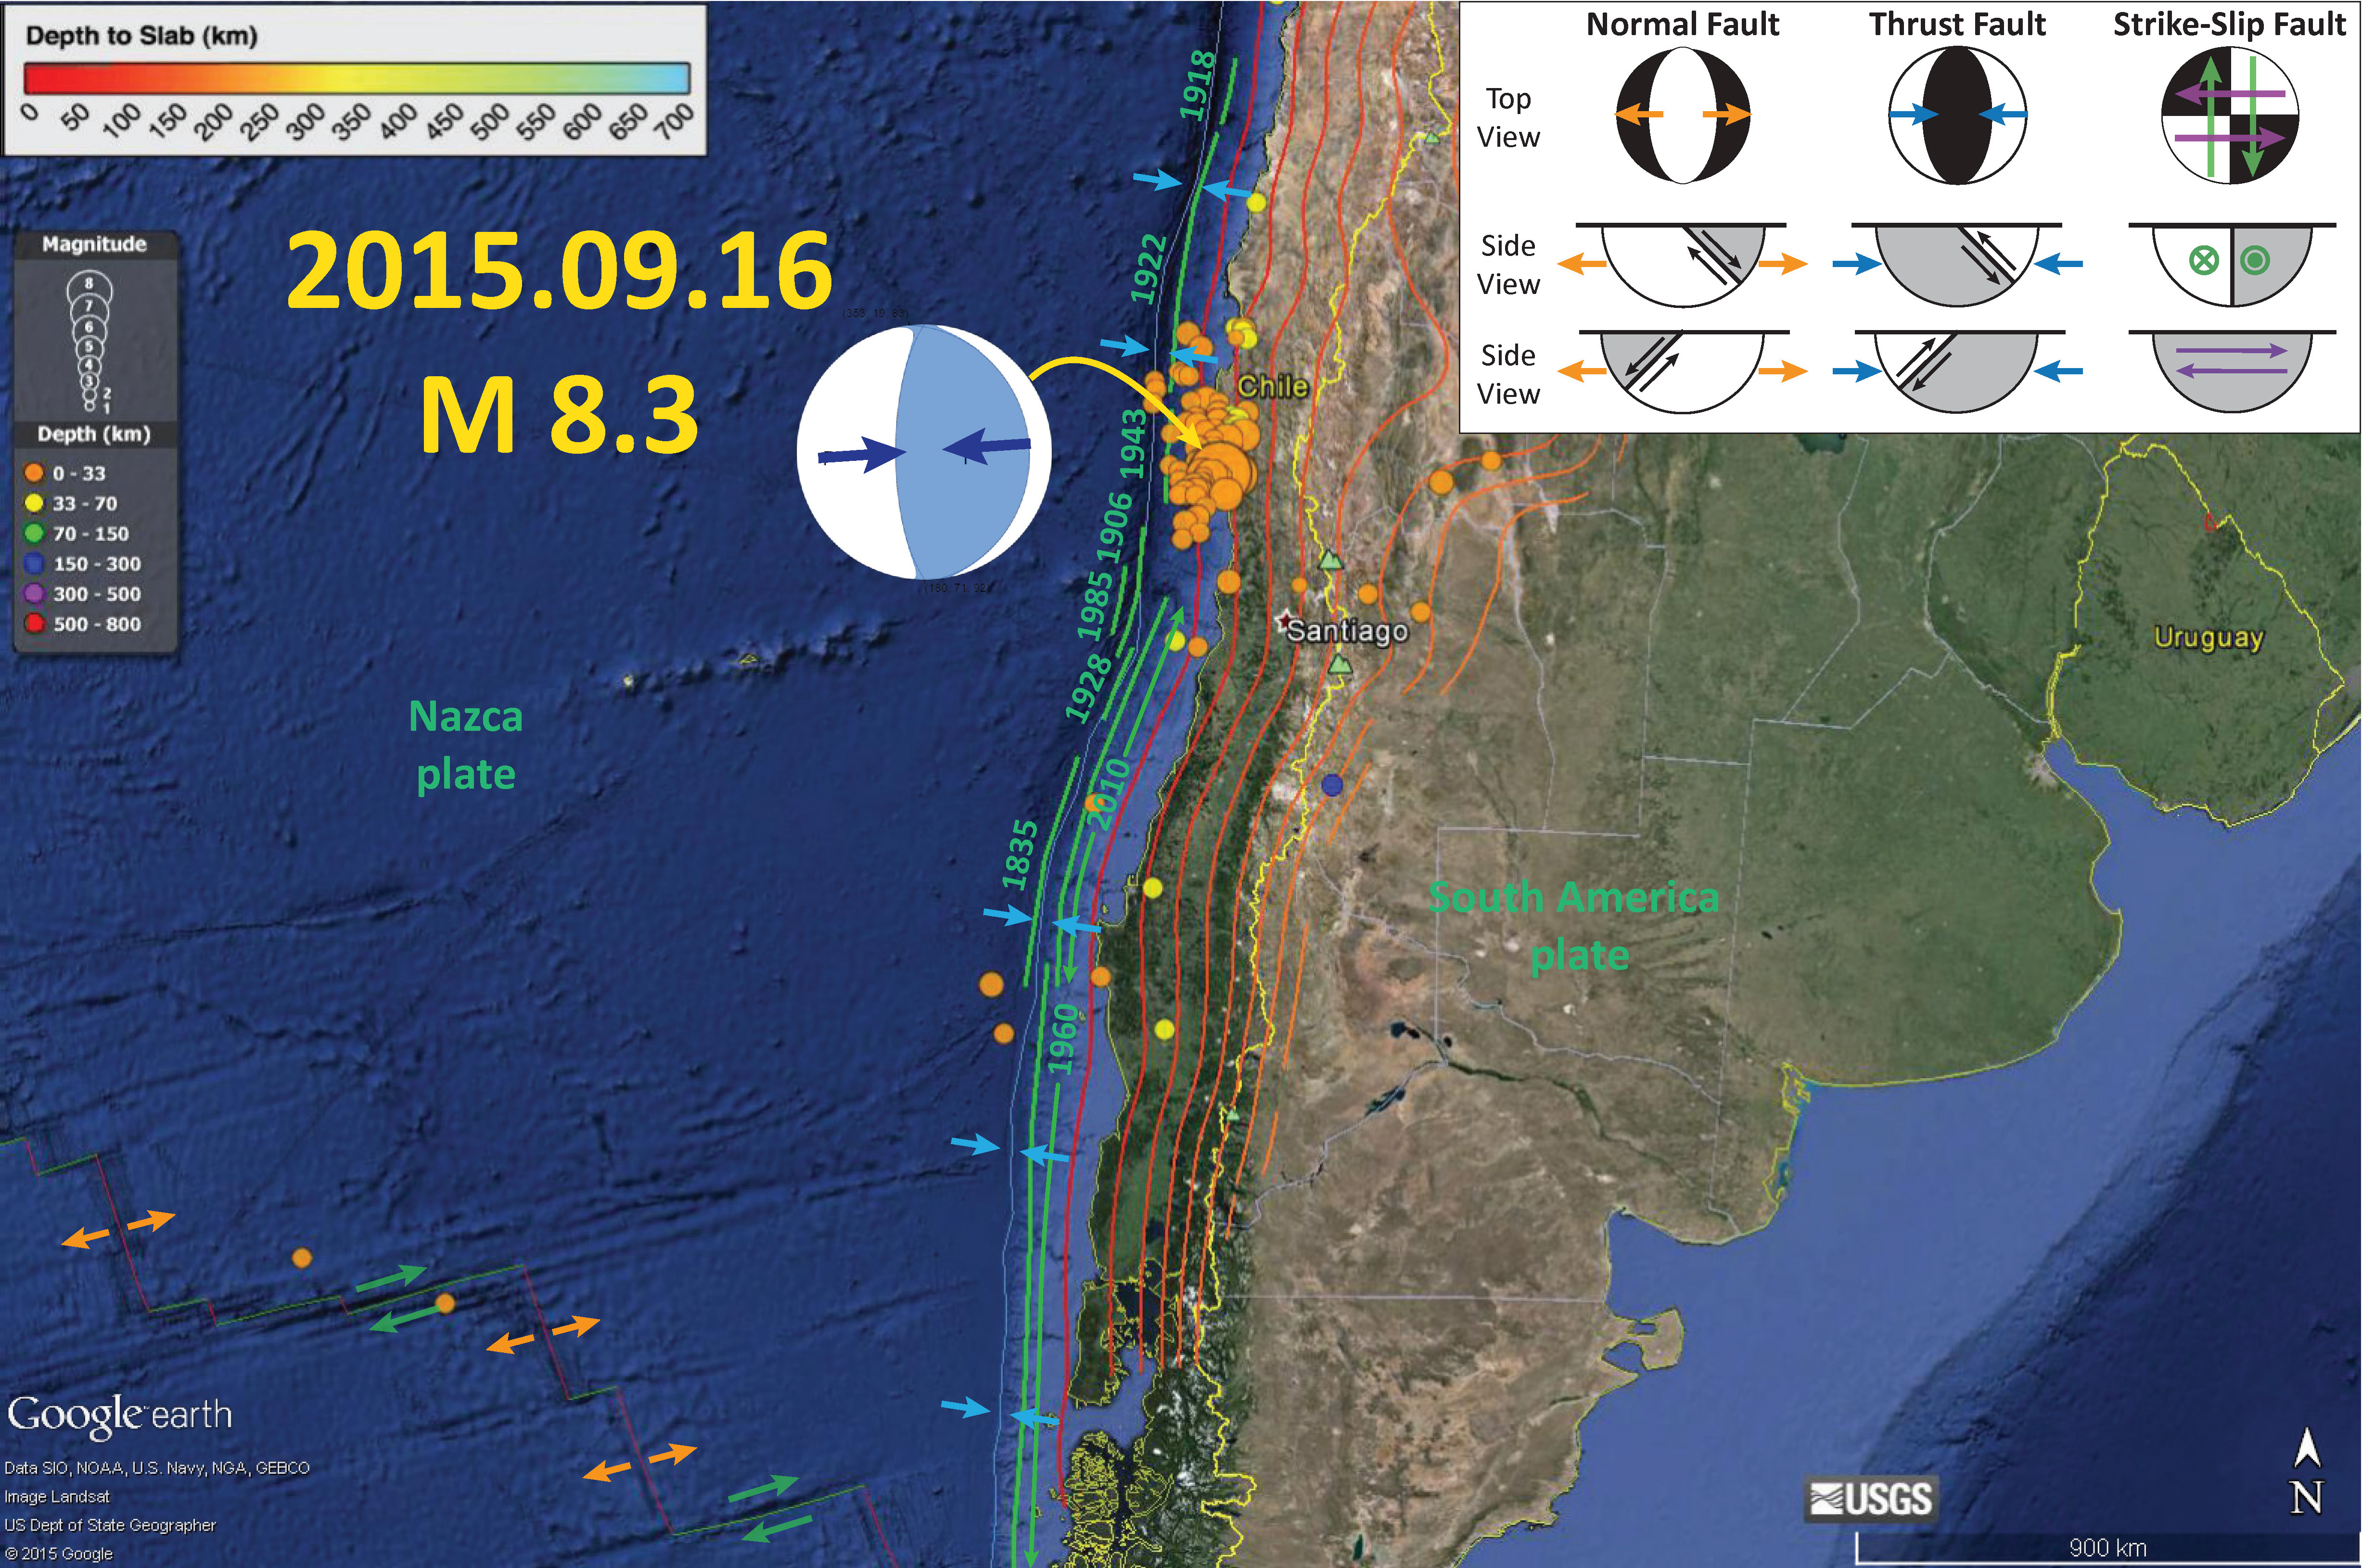
- 2015.09.16 M 8.3 Illapel, Chile 25 km
-
Here are the NOAA Center for Tsunami Research websites for the three tsunamis plotted in the map below, plus the one from 2015.09.16 not shown on the map below.
- 1960.05.22 M 9.5 (There is no page for the 1960 earthquake, so this map is located on the 2010 page.)/li>
- 2010.02.27 M 8.8
- 2014.04.01 M 8.2
- 2015.09.16 M 8.3
Here is the map. These three maps use the same color scale. There is not yet a map with this scale for the 2015 tsunami, so we cannot yet make the comparison.
Here is an animation of these three tsunami from the US NWS Pacific Tsunami Warning Center (PTWC). This is the YouTube link.
Here are all the earthquakes of magnitude greater than M 8.0 in Chile from between 1900 and today (2015.09.18 ).
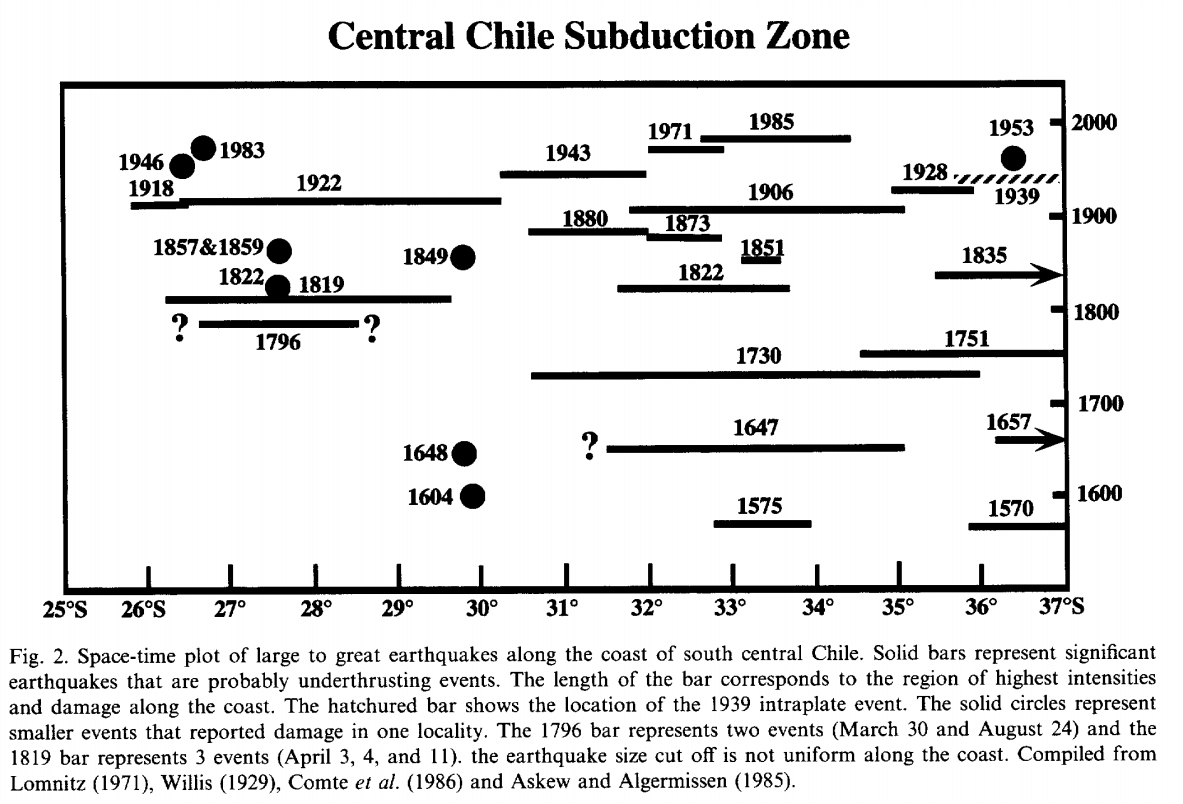
Here is a space time diagram from Beck et al. (1998 ). The 2015 earthquake occurs in the region of the 1943 and 1880 earthquakes.
Here is the latest map that shows the 2015 earthquake and aftershocks in relation to some of the historic maps shown on the Beck et al. (1998 ) space time diagram. I describe this map and its contents more on this page (Hayes et al., 2012).
-
These are the posts that I have put together regarding the 2015.09.16 earthquake and tsunami.
- 2015.09.16 First Post
- 2015.09.16 First Update
- 2015.09.17 Tsunami Observations
- 2015.09.17 Second Update
-
References:
- Beck, S., Barientos, S., Kausel, E., and Reyes, M., 1998. Source Characteristics of Historic Earthquakes along the Central Chile Subduction Zone in Journal of South American Earth Sciences, v. 11, no. 2., p. 115-129.
- Hayes, G.P., Wald, D.J., and Johnson, R.L., 2012. Slab1.0: A three-dimensional model of global subduction zone geometries in, J. Geophys. Res., 117, B01302, doi:10.1029/2011JB008524
5 thoughts on “Chile Historic Tsunami Comparisons”