
Tonight we had a large earthquake along the Aleutian subduction zone. Here is the USGS web page for this M = 6.9 earthquake.
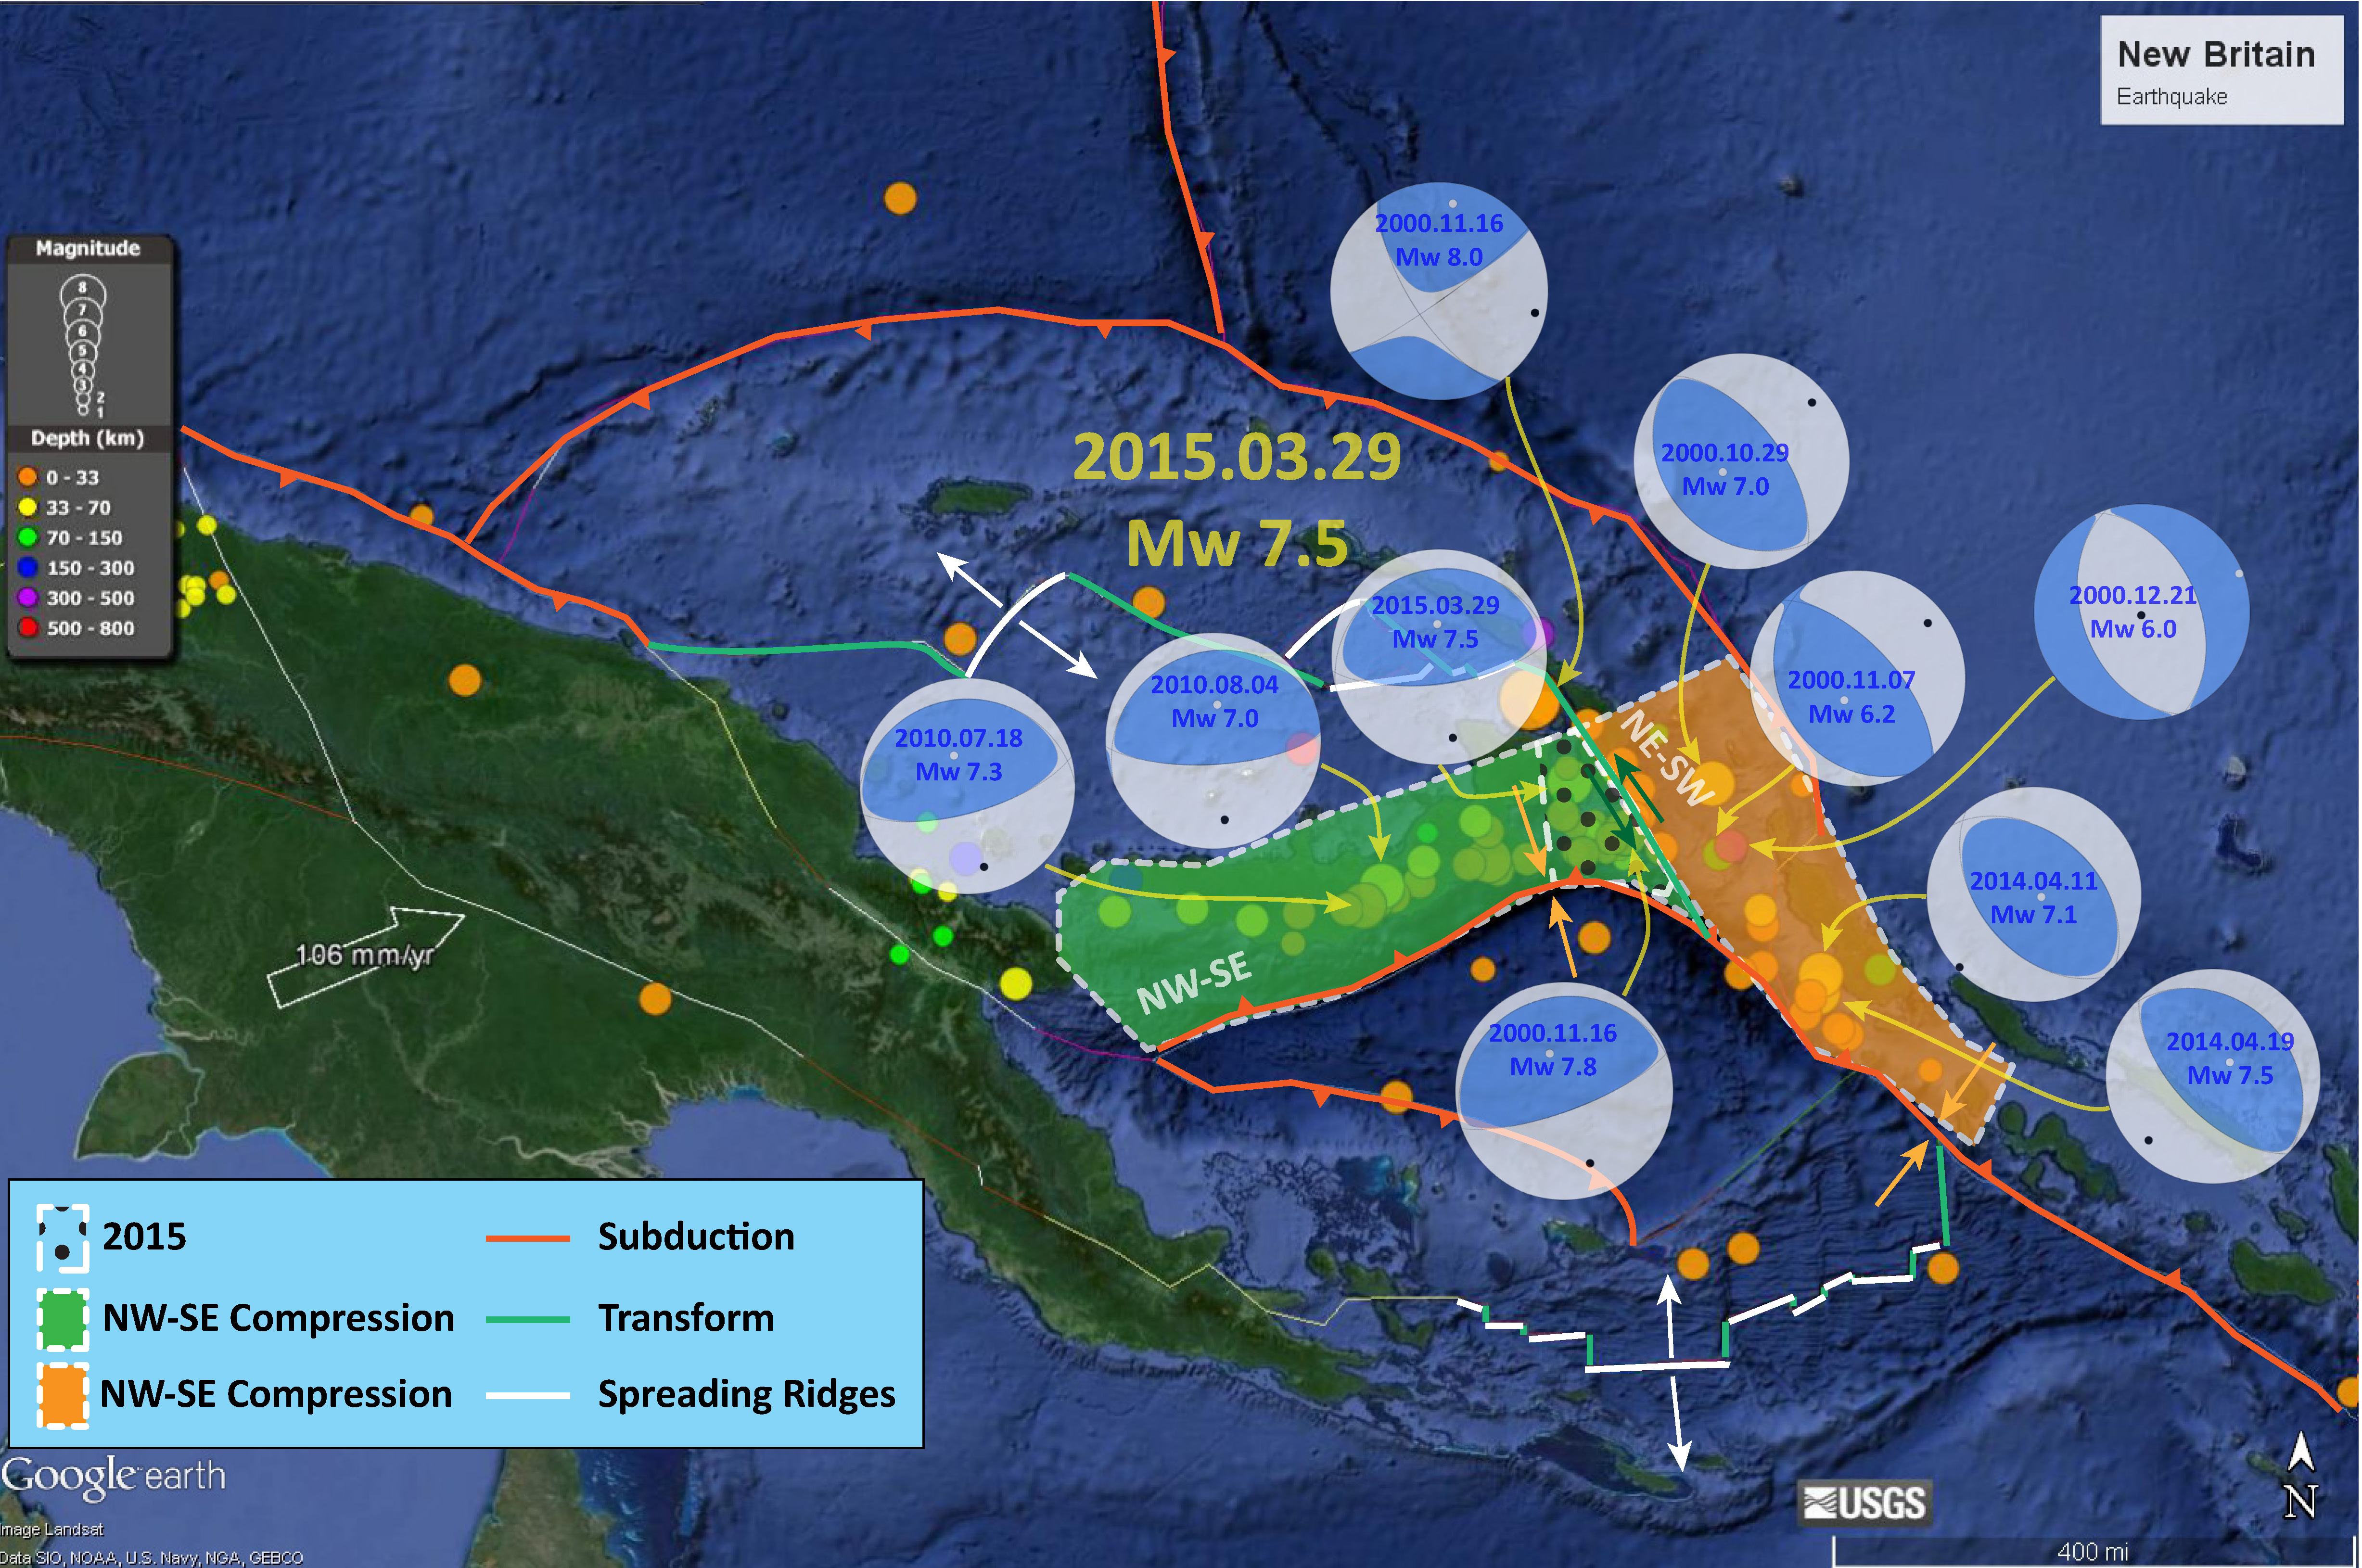
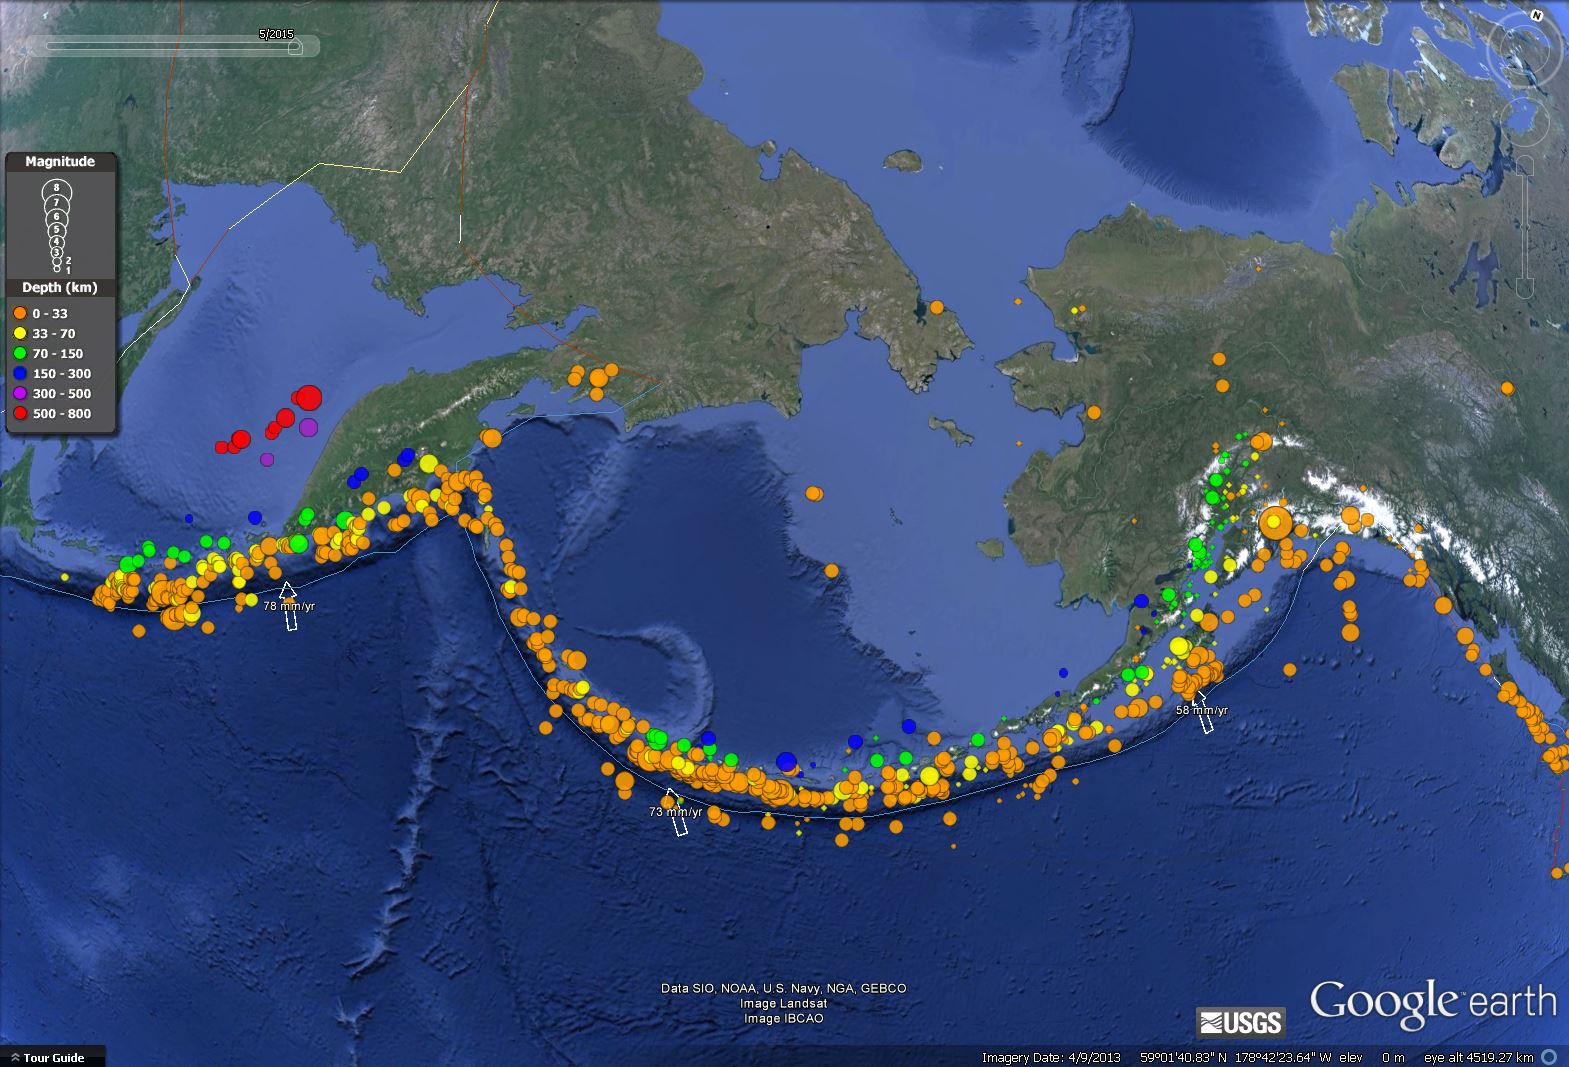
Here is a map that shows some of the large earthquakes in this region from 1996 through 2015. Refer to the moment tensor legend to help interpret the moment tensors for each earthquake. All, but one, are compressional solutions. Note how all the compressional earthquakes have roughly the same strike, oriented relative to the plate convergence vectors (blue arrows). The Aleutian arc may have slip partitioning that results in clockwise rotation of blocks instead of forearc sliver faults. I would have suspected that the strike of the thrust earthquakes would rotate with the strike of the subduction zone (like that occurs at the intersection of the New Britain and Solomon trenches).
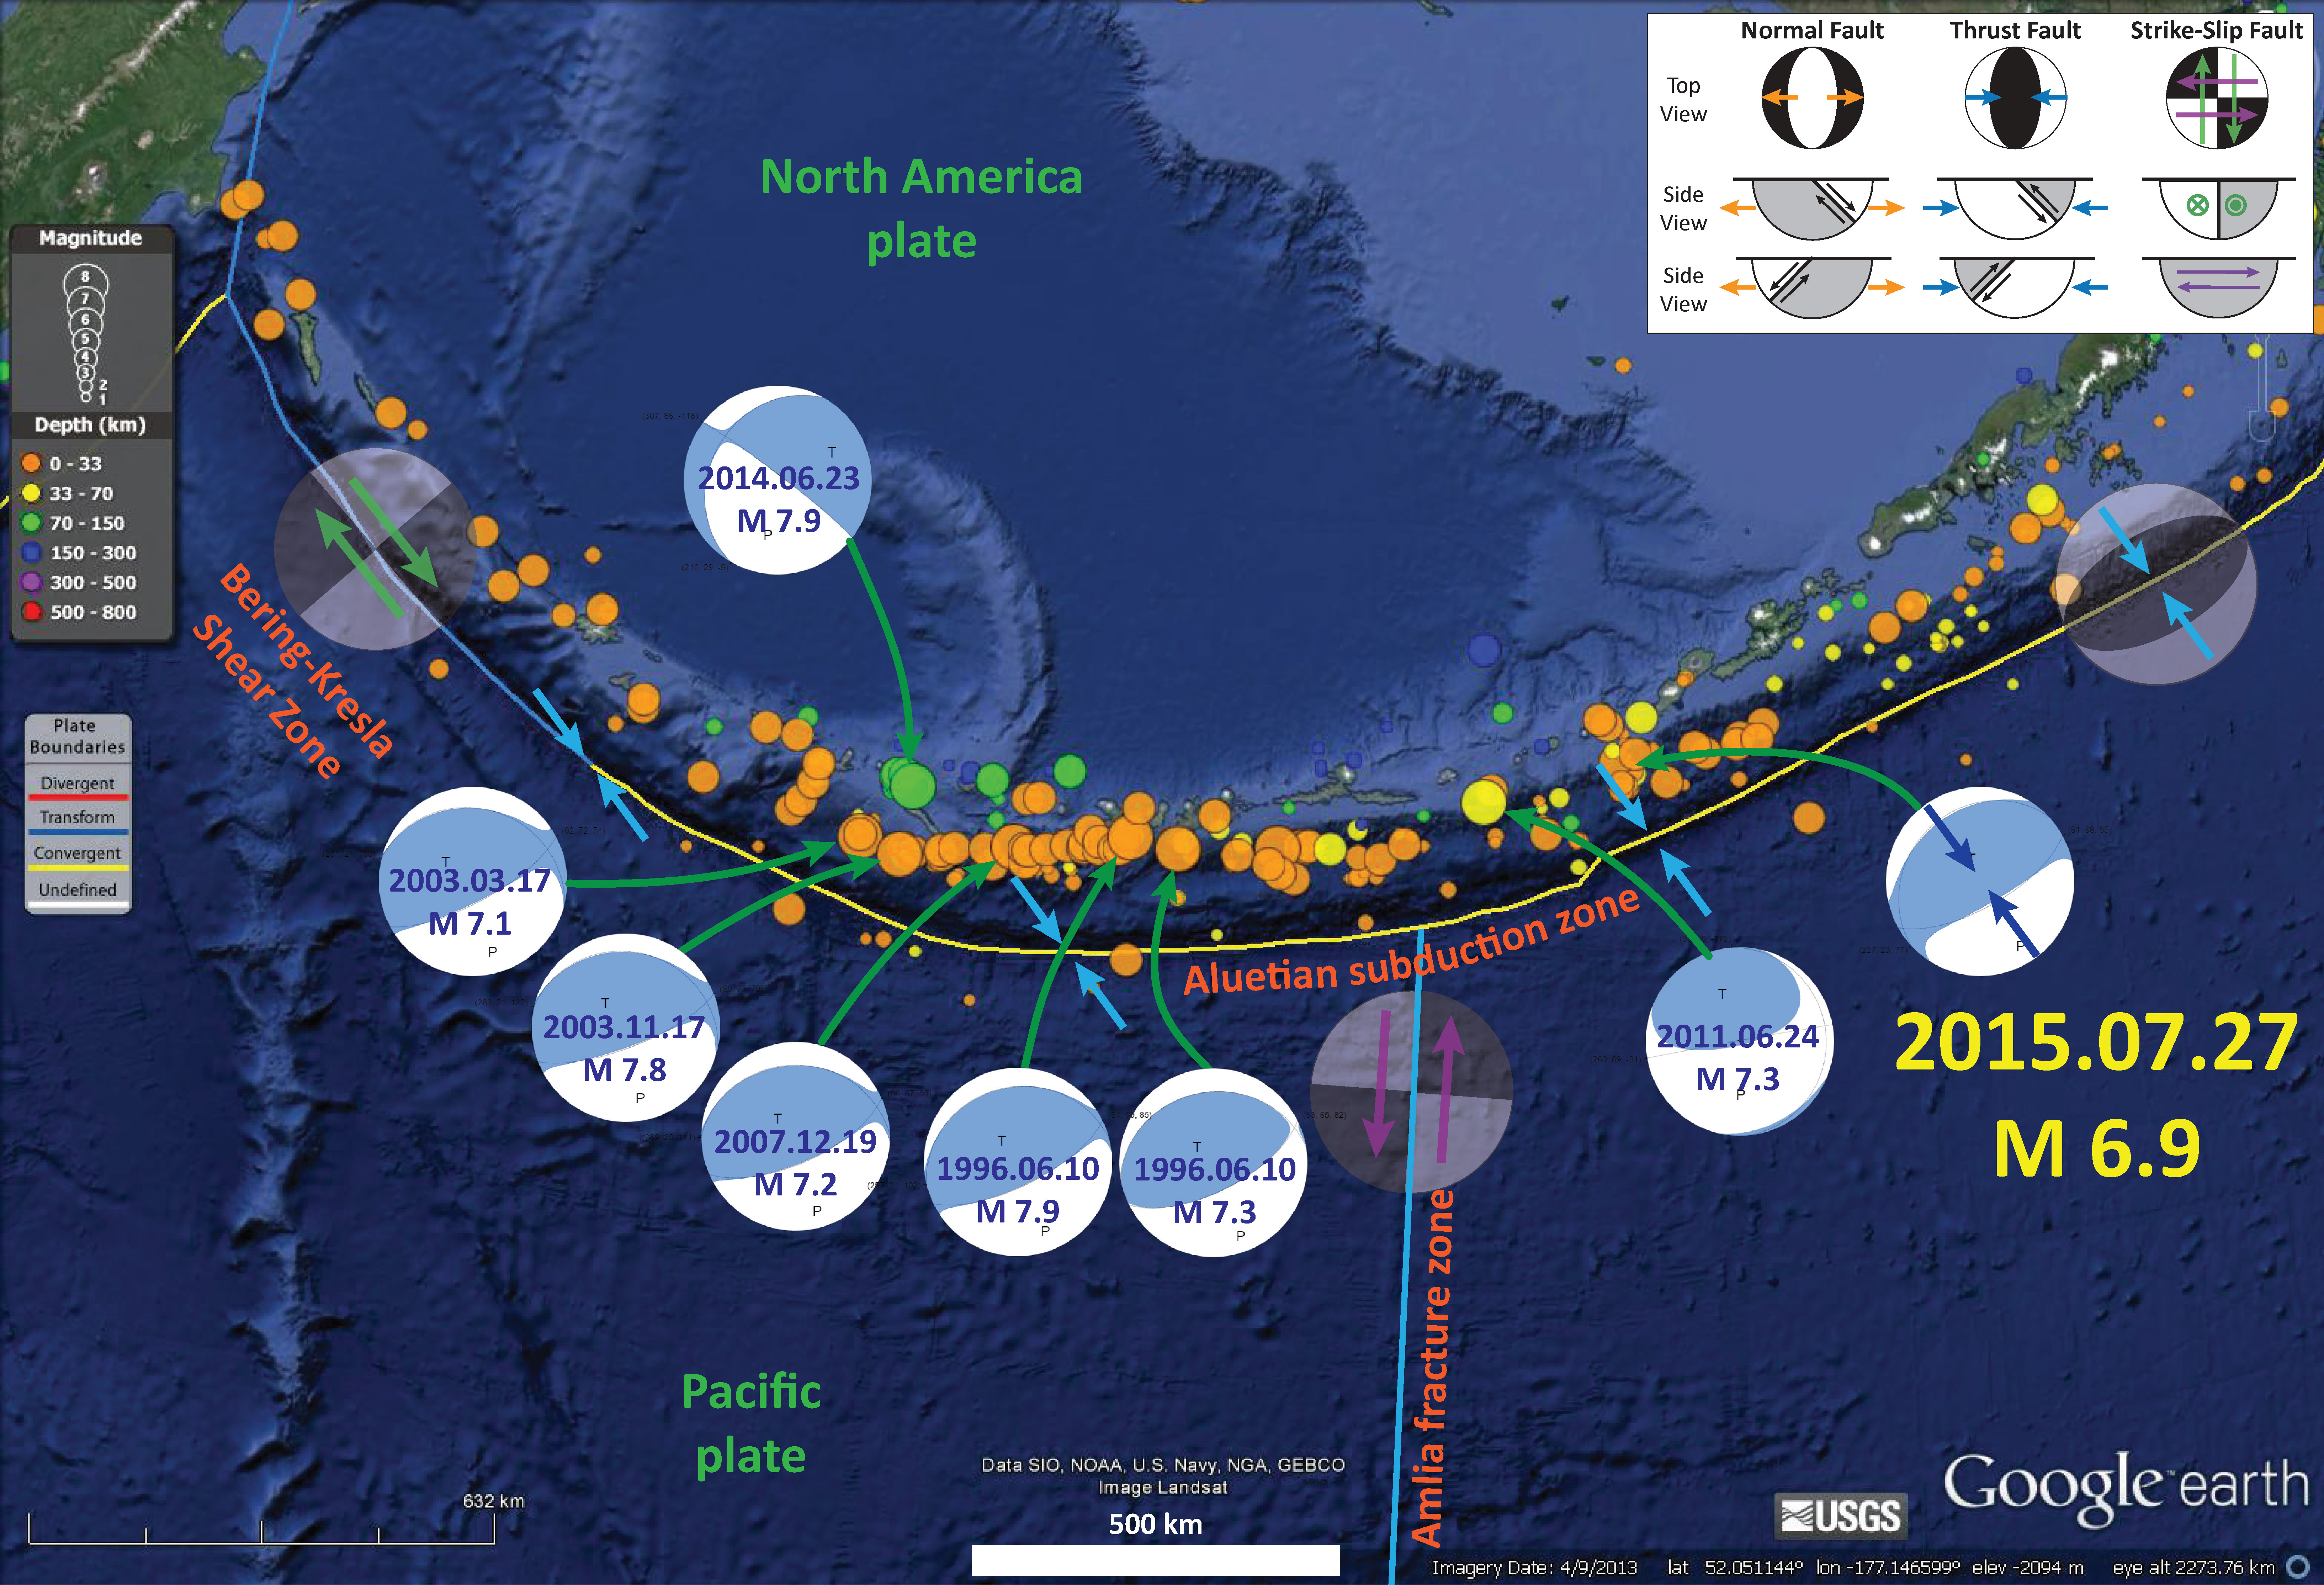
Note how the thrust earthquakes are aligned with the subduction zone faults. I have another map that shows more place names for this region.
This map shows today’s earthquakes and some aftershocks (orange and red circles).

-
Here are the USGS web pages for the earthquakes in the above map that have moment tensors plotted.
- 1996/06/10 M 7.9
- 1996/06/10 M 7.3
- 2003/03/17 M 7.1
- 2003/11/17 M 7.8
- 2007/12/19 M 7.2
- 2011/06/24 M 7.3
- 2014/06/23 M 7.9
- 2015/07/27 M 6.9
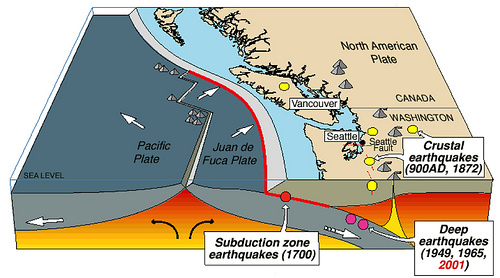
Along the Aleutian subduction zone, the Pacific plate subducts beneath the North America plate. Here is a map and cross section showing how the Juan de Fuca plate subducts beneath the North America plate, an analogy to the Aleutian subduction zone.
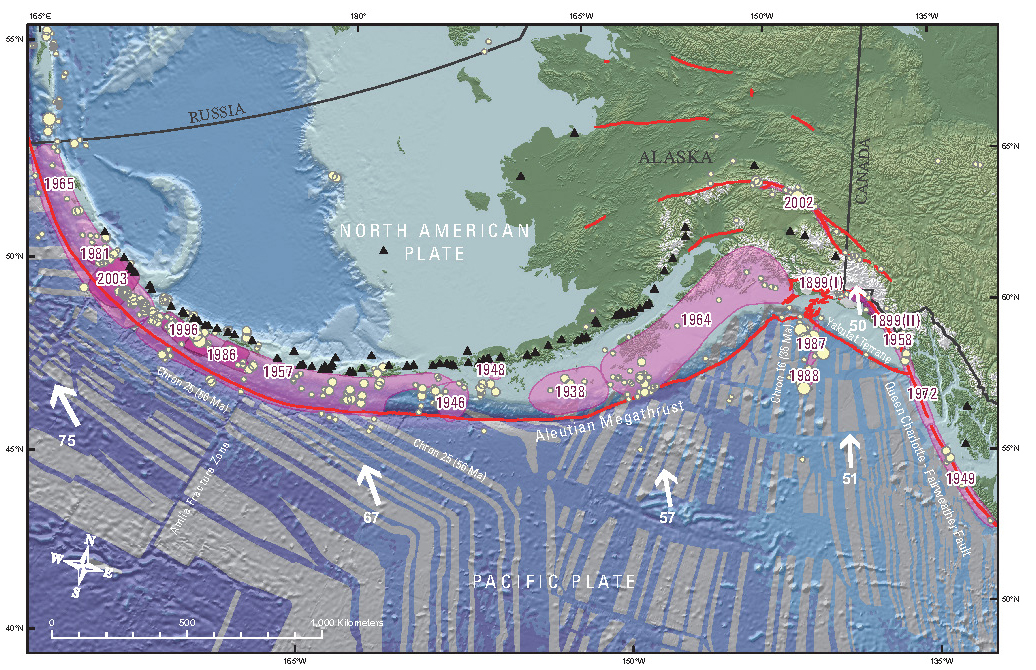
Here is a map that shows historic earthquake slip regions as pink polygons (Peter Haeussler, USGS). Dr. Haeussler also plotted the magnetic anomalies (grey regions), the arc volcanoes (black diamonds), and the plate motion vectors (mm/yr, NAP vs PP). Today’s M 6.9 earthquake occurred in the eastern part of the 1957 M = 8.6 earthquake region.
I put together some maps and animations for the 2014/06/23 M = 7.9 Rat Islands Earthquake. Here is a map showing the epicenters for the earthquakes from about a month prior to the 7.9 earthquake.
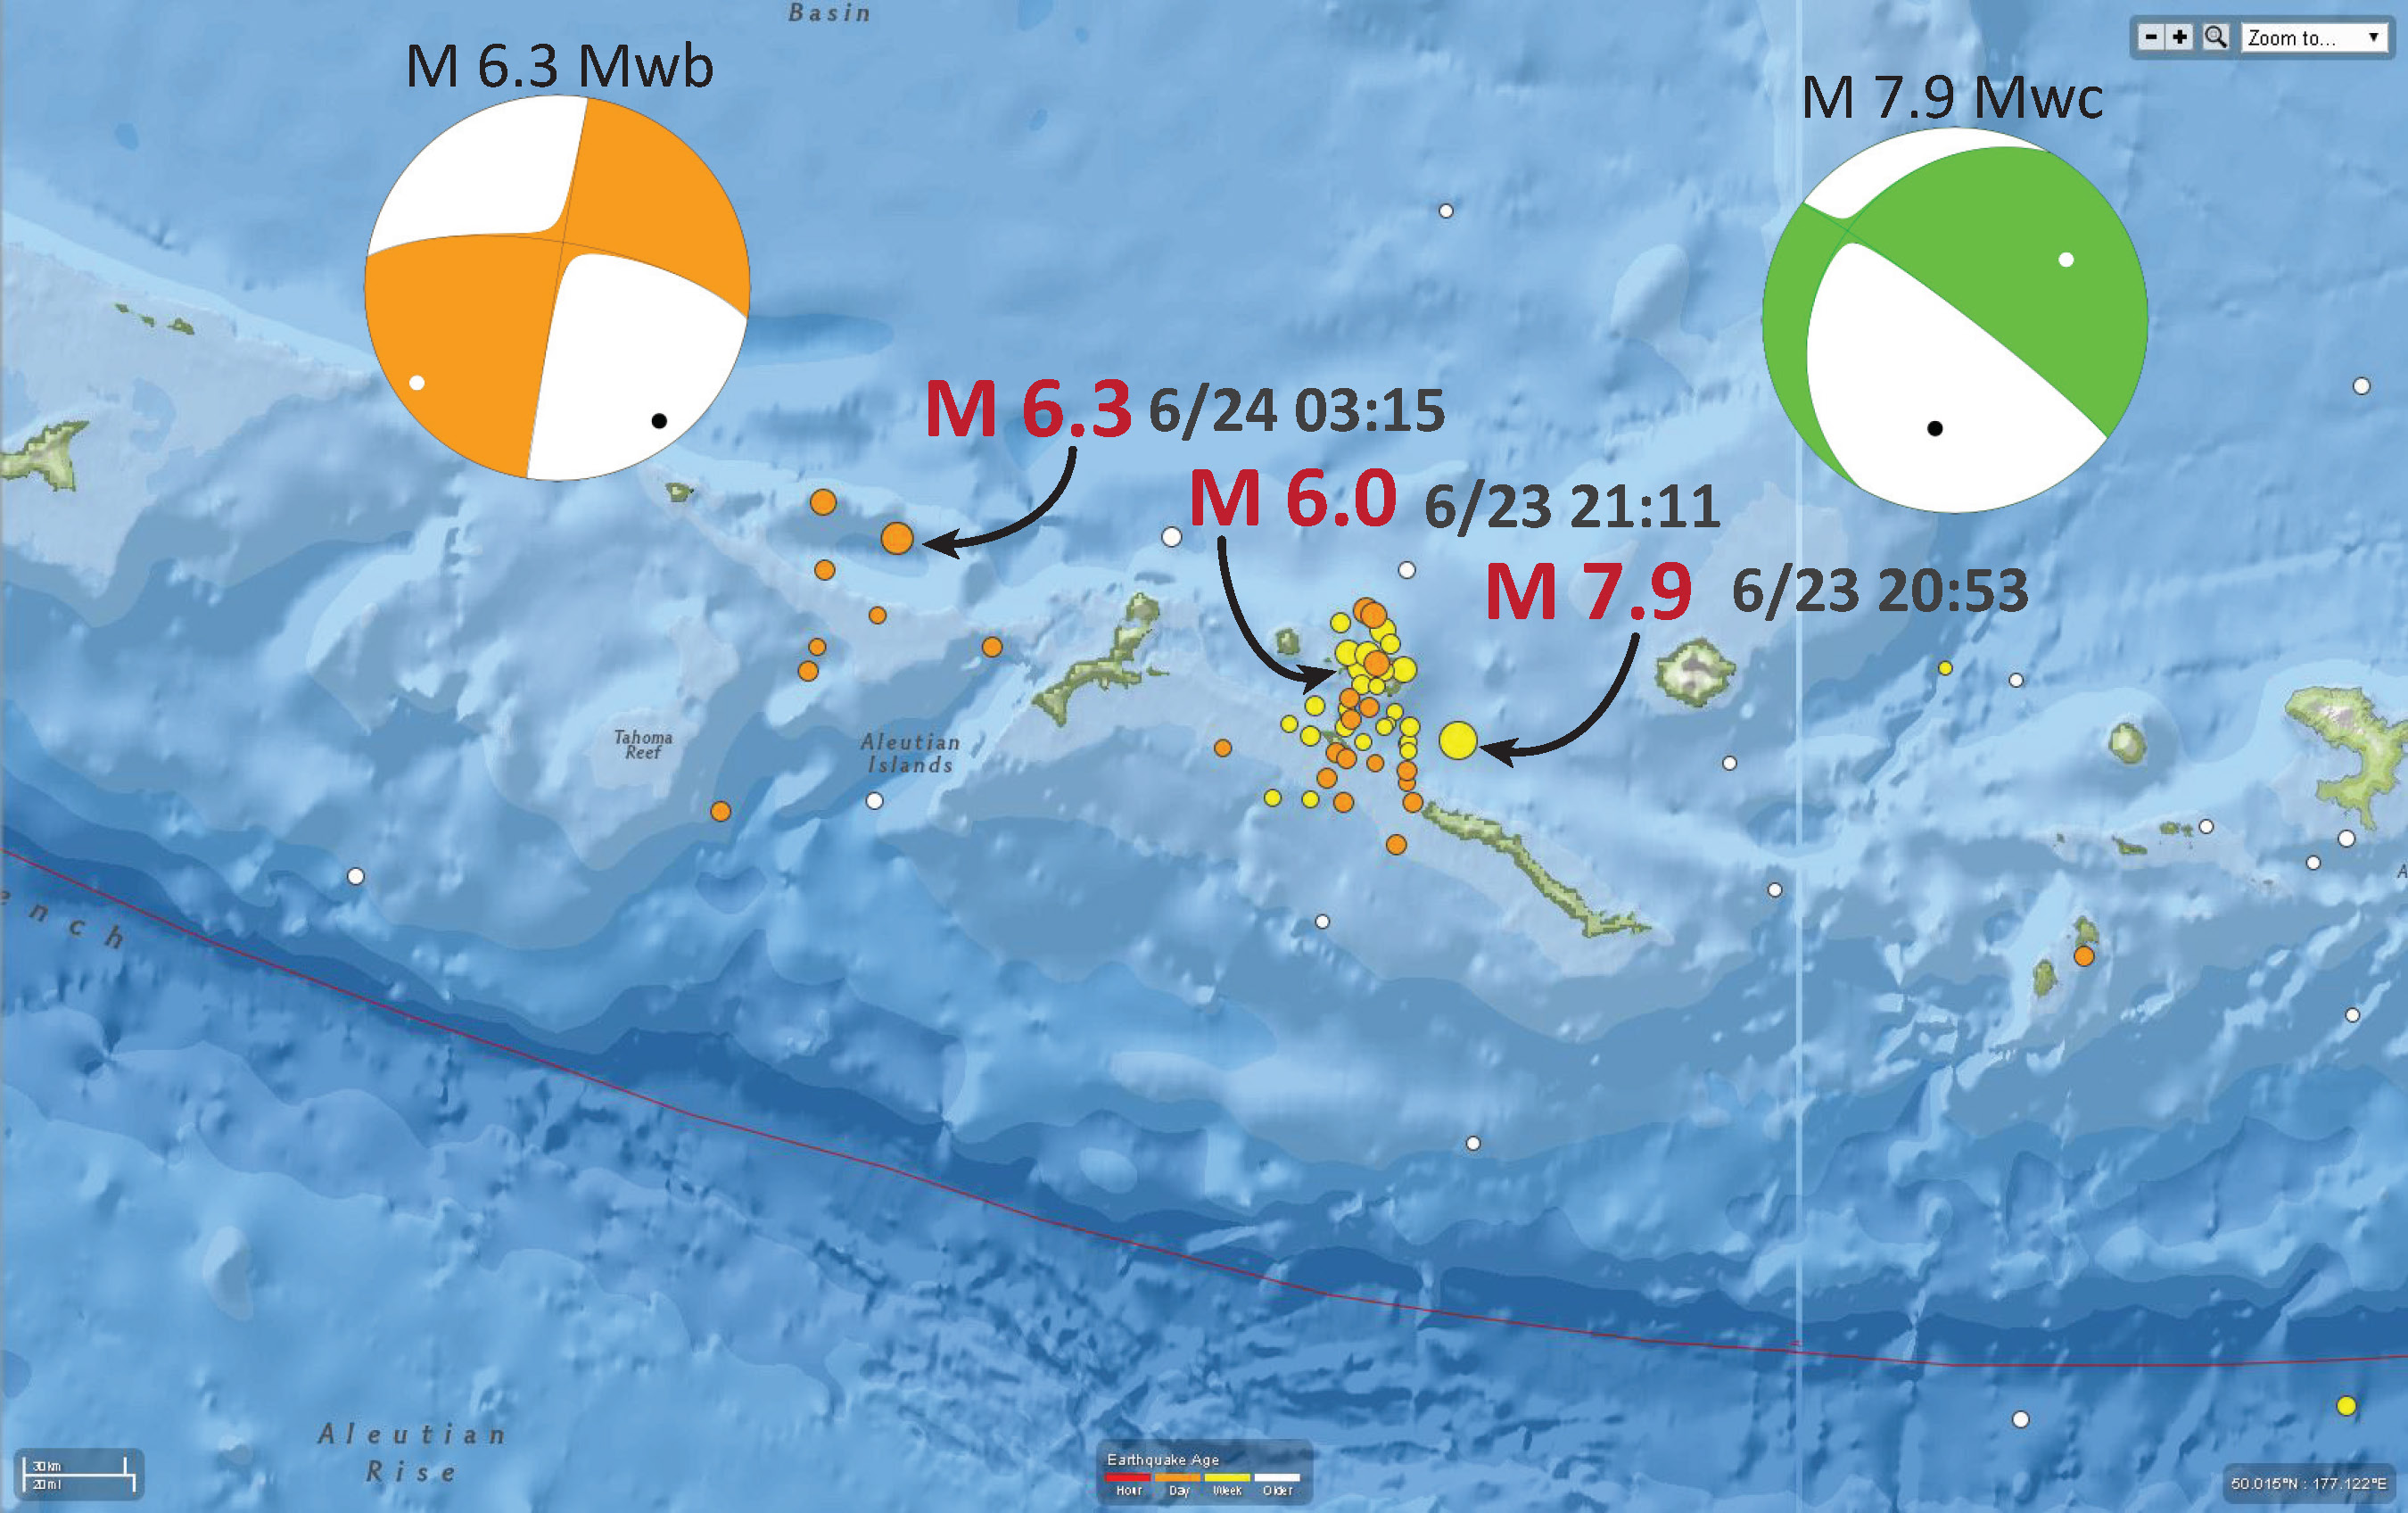
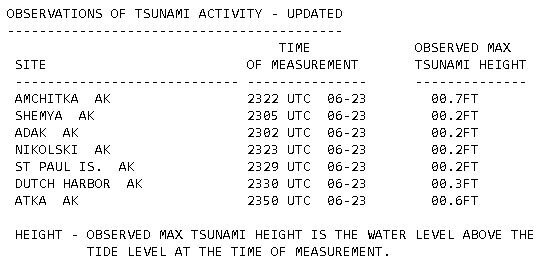
There were some recorded tsunami waves generated by the M = 7.9 earthquake. These were posted online by the NWS NATIONAL TSUNAMI WARNING CENTER PALMER AK
435 PM AKDT MON JUN 23 2014.
Here is a map that shows the seismicity (1960-2014) for this plate boundary. This is the spatial extent for the videos below.
Here are two videos that show animations of the seismicity from 1960 until today.
The first one leaves the epicenters on the screen for the entire animation. Here is a link to the file to save to your computer.
This animation has a moving time window (~1 year), so that 1 year after the earthquake, it is removed from the map. Here is a link to the file to save to your computer.
Further to the east was the 1964/03/27 M 9.2 Good Friday Earthquake. Below is an educational video from the USGS that presents material about subduction zones and the 1964 earthquake and tsunami in particular.
Youtube Source IRIS
WMV file for downloading.
mp4 file for downloading.
Animation & graphics by Jenda Johnson, geologist
Directed by Robert F. Butler, University of Portland
U.S. Geological Survey consultants: Robert C. Witter, Alaska Science Center Peter J. Haeussler, Alaska Science Center
Narrated by Roger Groom, Mount Tabor Middle School
Maps from Google Earth. Video from US Army Corps of Engineers. Tsunami animation from National Oceanic & Atmospheric Administration (NOAA). Photographs from US Geological Survey.
Errata: 1) Fourth Ave., not Fourth St. 2) After 2min48sec the epicenter was shifted N. Should be ESE of that, closer to Prince William Sound. Apologies from animator.
3 thoughts on “Fox Islands Earthquake!”