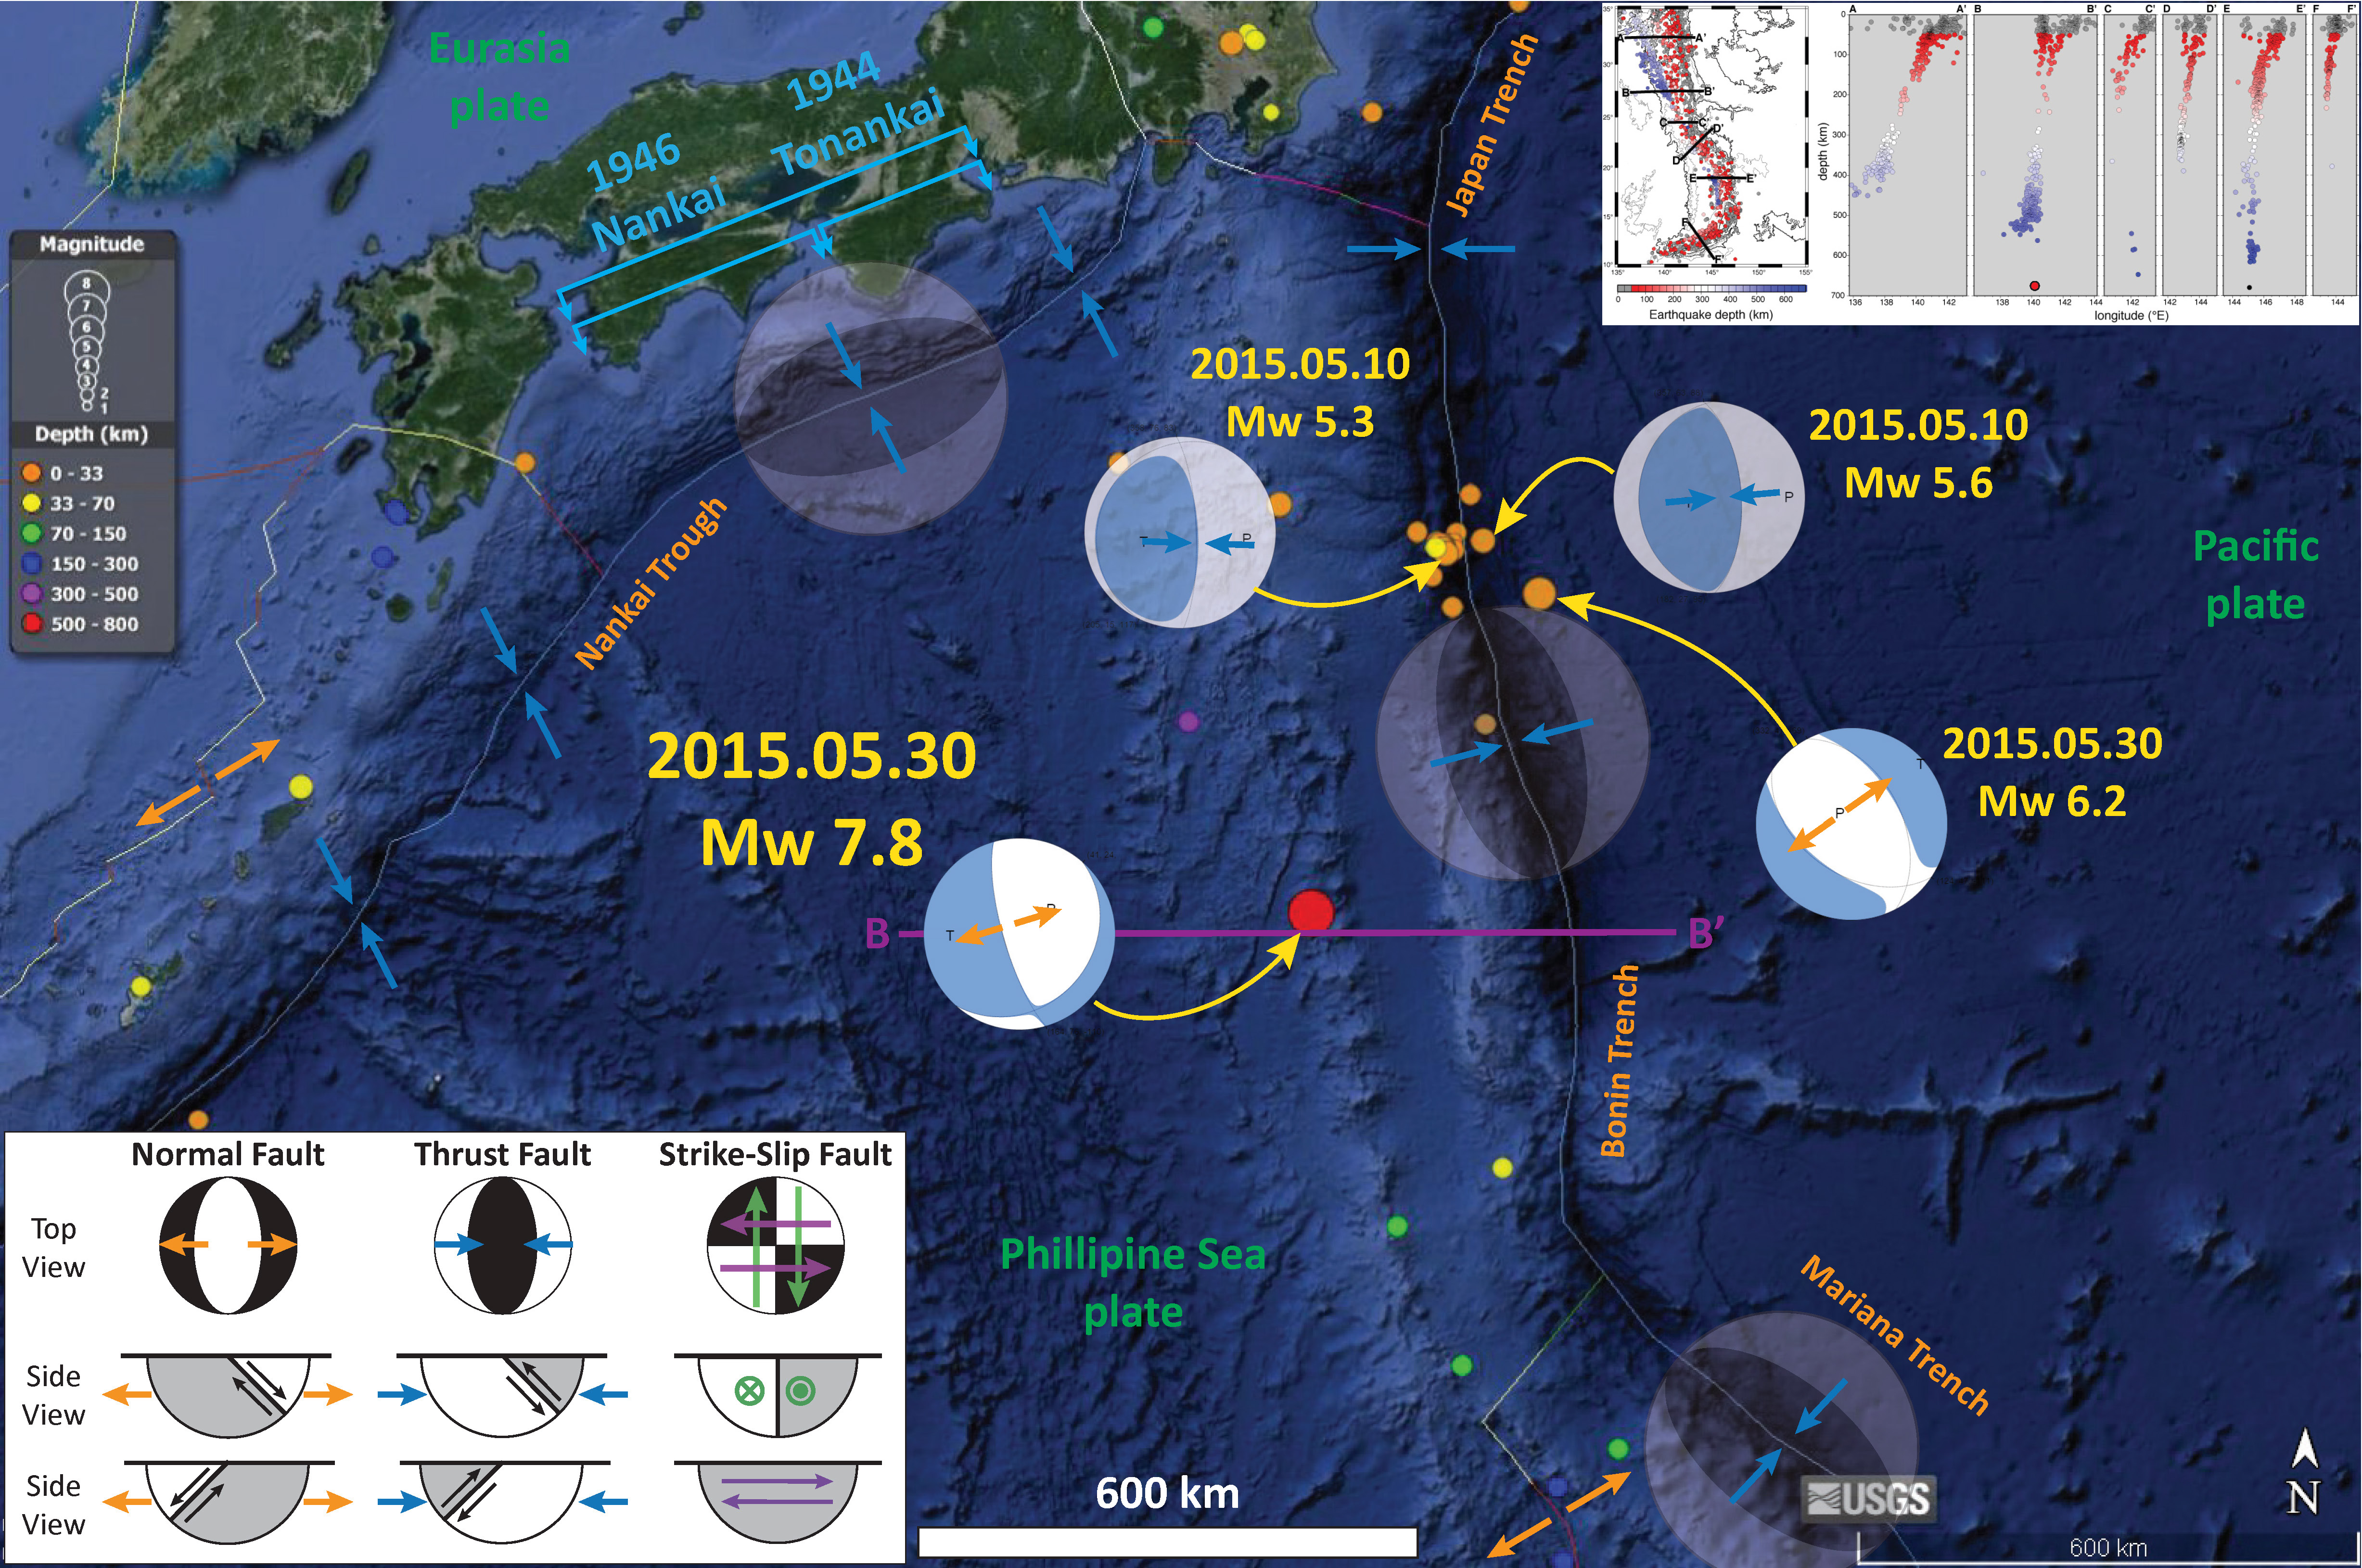
Well, we had a large magnitude earthquake (M = 6.2) triggered by the M 7.8 deep earthquake along the Izu-Bonin Trench. Here is my post from yesterday. Note the triggered earthquake is in a region where there were earthquakes about 2 weeks prior to the M 7.8. These “foreshocks” (not really foreshocks since they are on different faults) are thrust or reverse earthquakes (the result of compression from the convergent plate boundary). The M 7.8 and triggered M 6.2 are, instead, normal earthquakes (the result of extension).
I have included a cross section on the map (also include this below). The cross section B-B’ is in a great location compared to the M 7.8. Note the purple line, as this coincides with the B-B’ cross section on seismicity in the inset figure. I placed a red circle on the inset, approximately where the M 7.8 hypocenter would plot. This M 7.8 is the deepest earthquake in this part of the subduction zone, but on cross section E-E’ shows an earthquake with a similar hypocentral depth. I also show where the 1944 M 8.1 Tonankai and 1946 M 8.3 Nankai subduction zone earthquakes are.
-
Here are the USGS web sites for the earthquakes with moment tensors plotted on the above map.
- 2015.05.10 M 5.3
- 2015.05.10 M 5.6
- 2015.05.30 M 6.2
- 2015.05.30 M 7.8
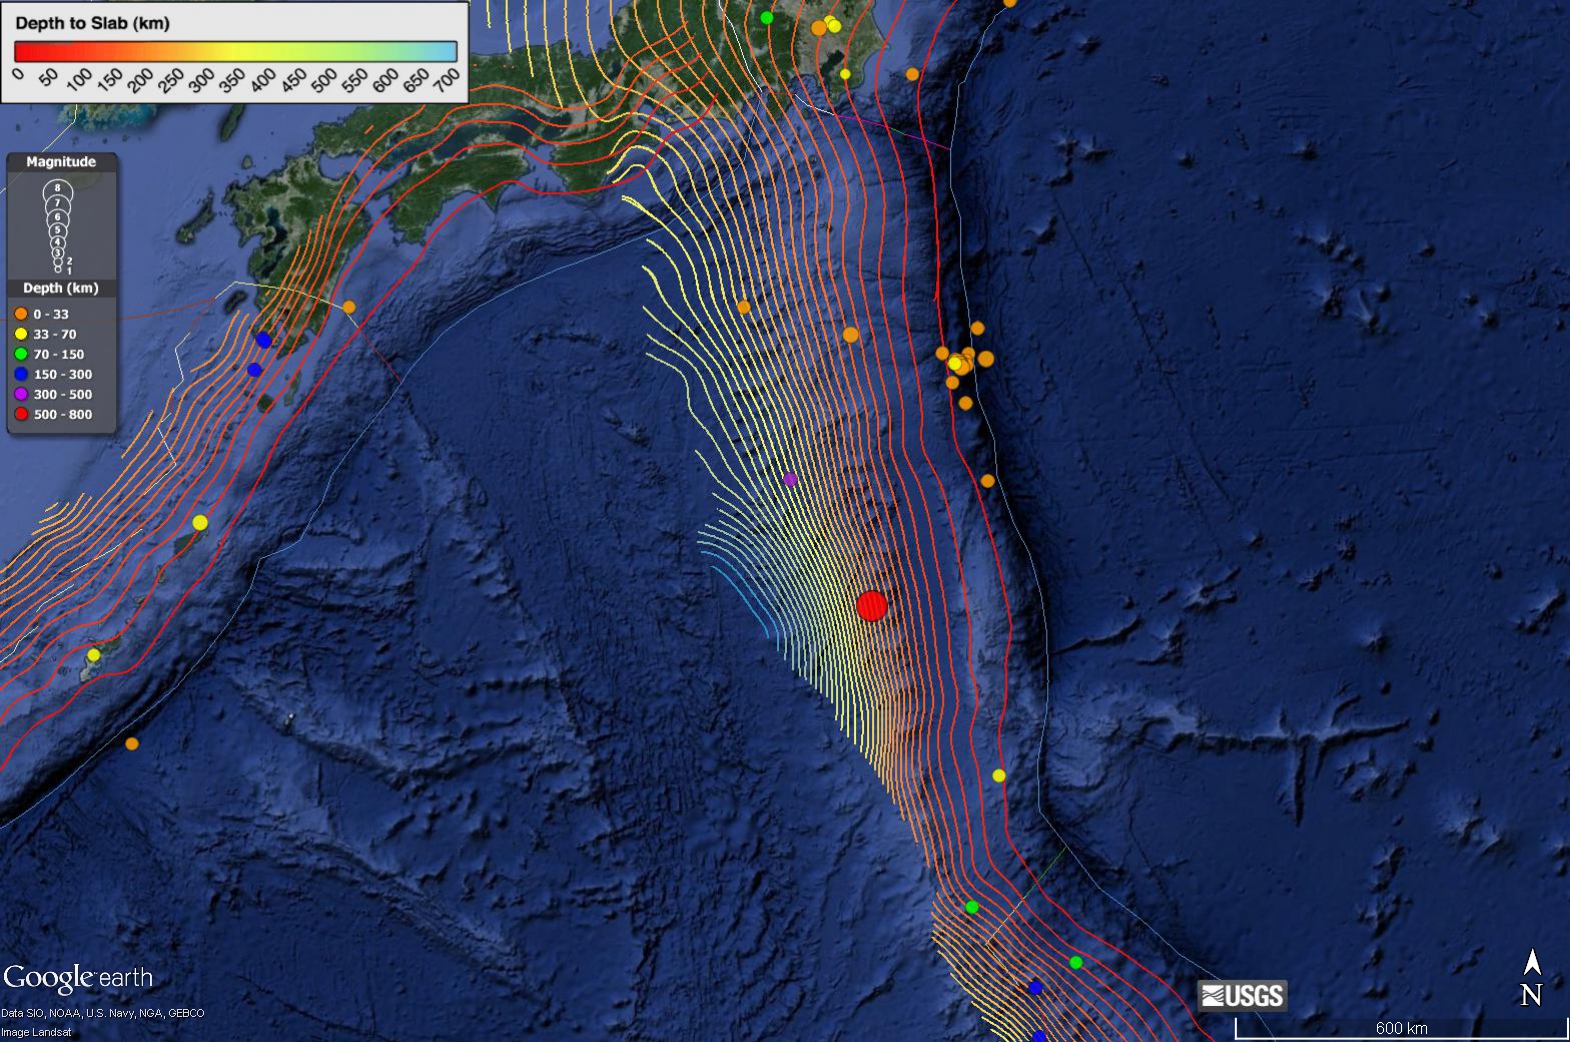
Something that is interesting, possibly, is that the M 7.8 earthquake is at a much deeper position than is suggested by the slab model from Hayes et al. (2012). Based upon these slab contours (the depth contours for where the subduction zone fault may be, based upon seismicity), the slab is at a depth of 200-220 km in the region of the M 7.8 earthquake, yet this earthquake has a USGS hypocentral depth of 677 km. These slab contours are free to download and then they can be plotted in Google Earth (or ArcGIS). However, if we examine the cross section on the inset figure (or below), we will see that the M 7.8 fits well with the earlier seismicity. Perhaps the Hayes et al. (2012) slab model could be updated for this subduction zone.
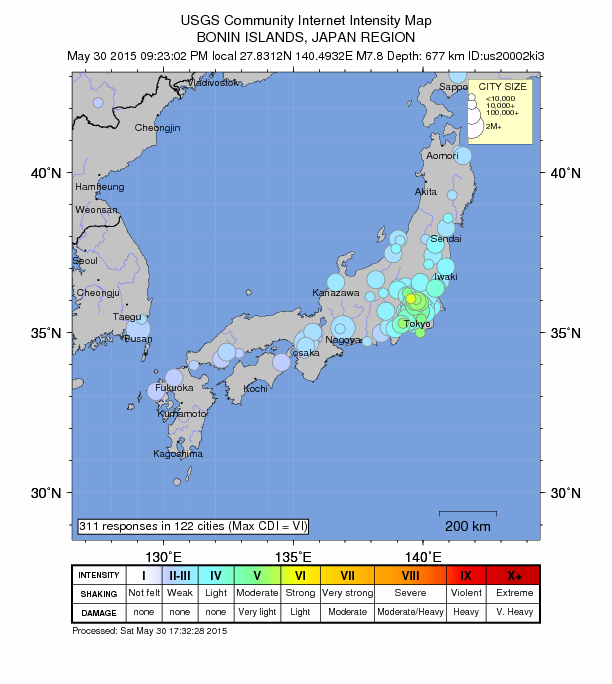
The M 7.8 was felt broadly in Japan.
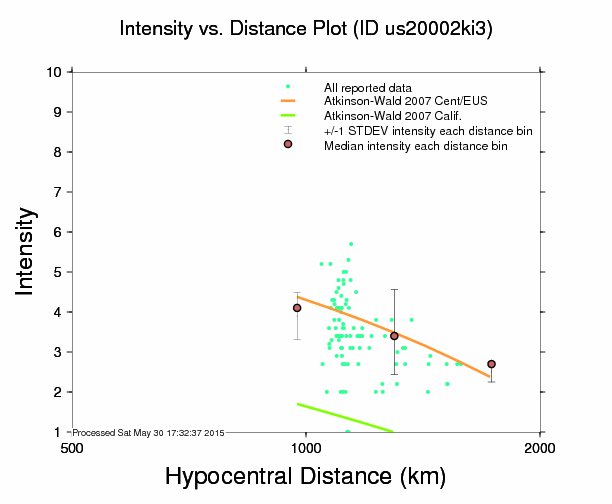
This shows how the seismic energy attenuates (diminishes) with distance from the earthquake. Note how the observations are at such a great distance.
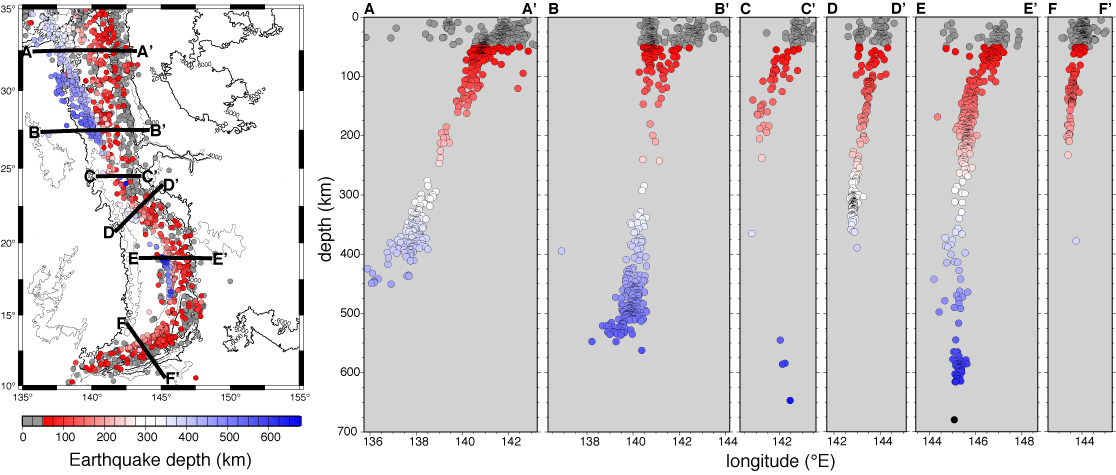
Here is the cross section figure that is an inset on the above map. This comes from Dr. Matt Fouch from Arizona State University. Here is some text from the wiki page.
“Map view of bathymetry and seismicity in the IBM subduction zone using the earthquake catalog of Engdahl, van der Hilst & Buland 1998. Circles denote epicentral locations; lighter circles represent shallower events, darker circles represent deeper events. Black lines denote cross sectional areas depicted in 6 profiles on right, organized from N to S. Black circles represent hypocentral locations in volume ~60 km to each side of the lines shown on the map at left. Large variations in slab dip and maximum depth of seismicity are apparent. Distance along each section is measured from the magmatic arc.”
“B) Central Izu Bonin region. Slab dip is nearly vertical; seismicity tapers off from ~100 km to ~325 km but increases in rate and extends horizontally around 500 km, and terminates at ~550 km.”
-
References:
- Engdahl, E.R.; van der Hilst, R.D.; Buland, R., 1998. Global teleseismic earthquake relocation with improved travel times and procedures for depth determination. Bulletin of the Seismological Society of America 88: 722–743.
- Hayes, G. P., D. J. Wald, and R. L. Johnson (2012), Slab1.0: A three-dimensional model of global subduction zone geometries, J. Geophys. Res., 117, B01302, doi:10.1029/2011JB008524
2 thoughts on “Triggered Earthquakes: Izu-Bonin”