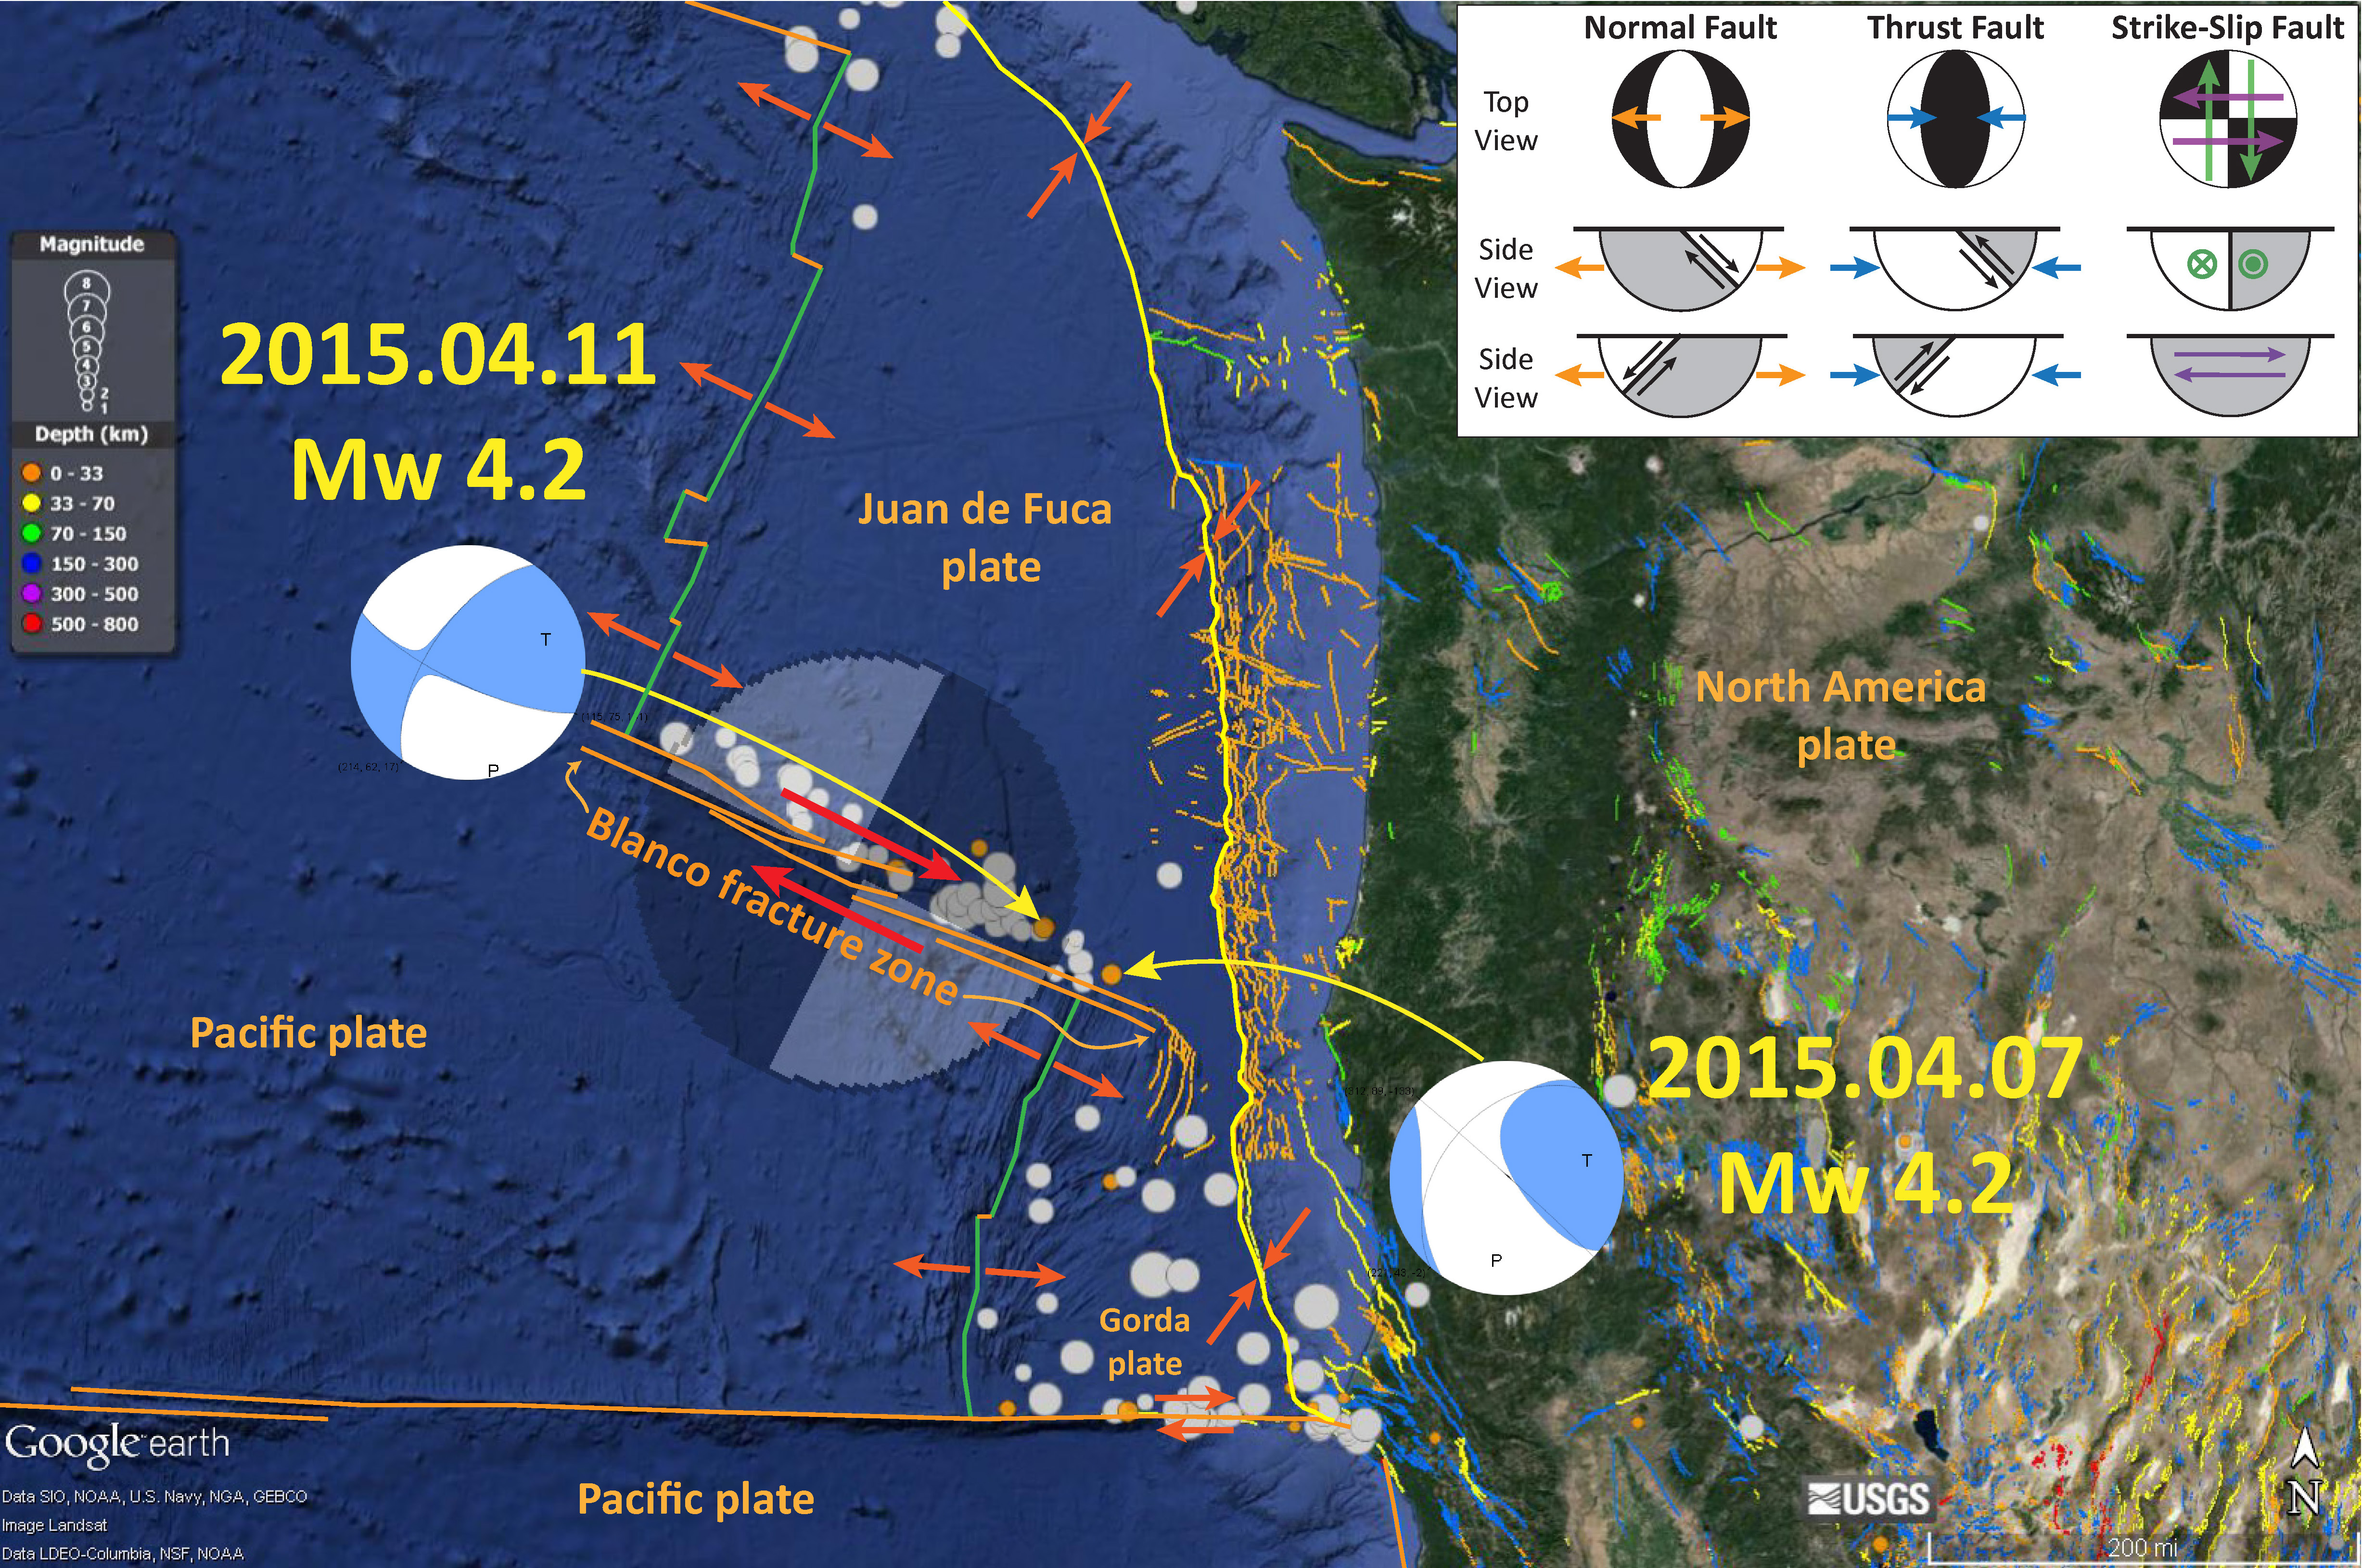
The Blanco fracture zone (BFZ) is a transform plate boundary that connects the Juan de Fuca ridge with the Gorda rise spreading centers. This active fault zone consists of numerous right-lateral (dextral) faults. There is some debate as to how far east the BFZ extends beyond the Gorda rise (some pose it extends far past the trench and ambient noise tomographic data supports this interpretation; Porritt et al., 2011). I remember a colleague of mine who once adamantly stated that there is no evidence for the extension of the BFZ eastwards past the megathrust fault tip. However, they were working on faulting in the North America plate along coastal Oregon, so their view was limited (compared to the plot I share below). However, this colleague made this statement a decade before the Porritt et al. (2011) data were to be published.
There were two Mw 4.2 earthquakes associated with this plate boundary fault system in the past week. I plot the moment tensors for these earthquakes (USGS pages: 4/7/15 and 4/11/15) in this map below. I also have placed the relative plate motions as arrows, labeled the plates, and placed a transparent focal mechanism plot above the BFZ showing the general sense of motion across this plate boundary. There have been several earthquakes along the Mendocino fault recently and I write about them 1/2015 here and 4/2015 here.
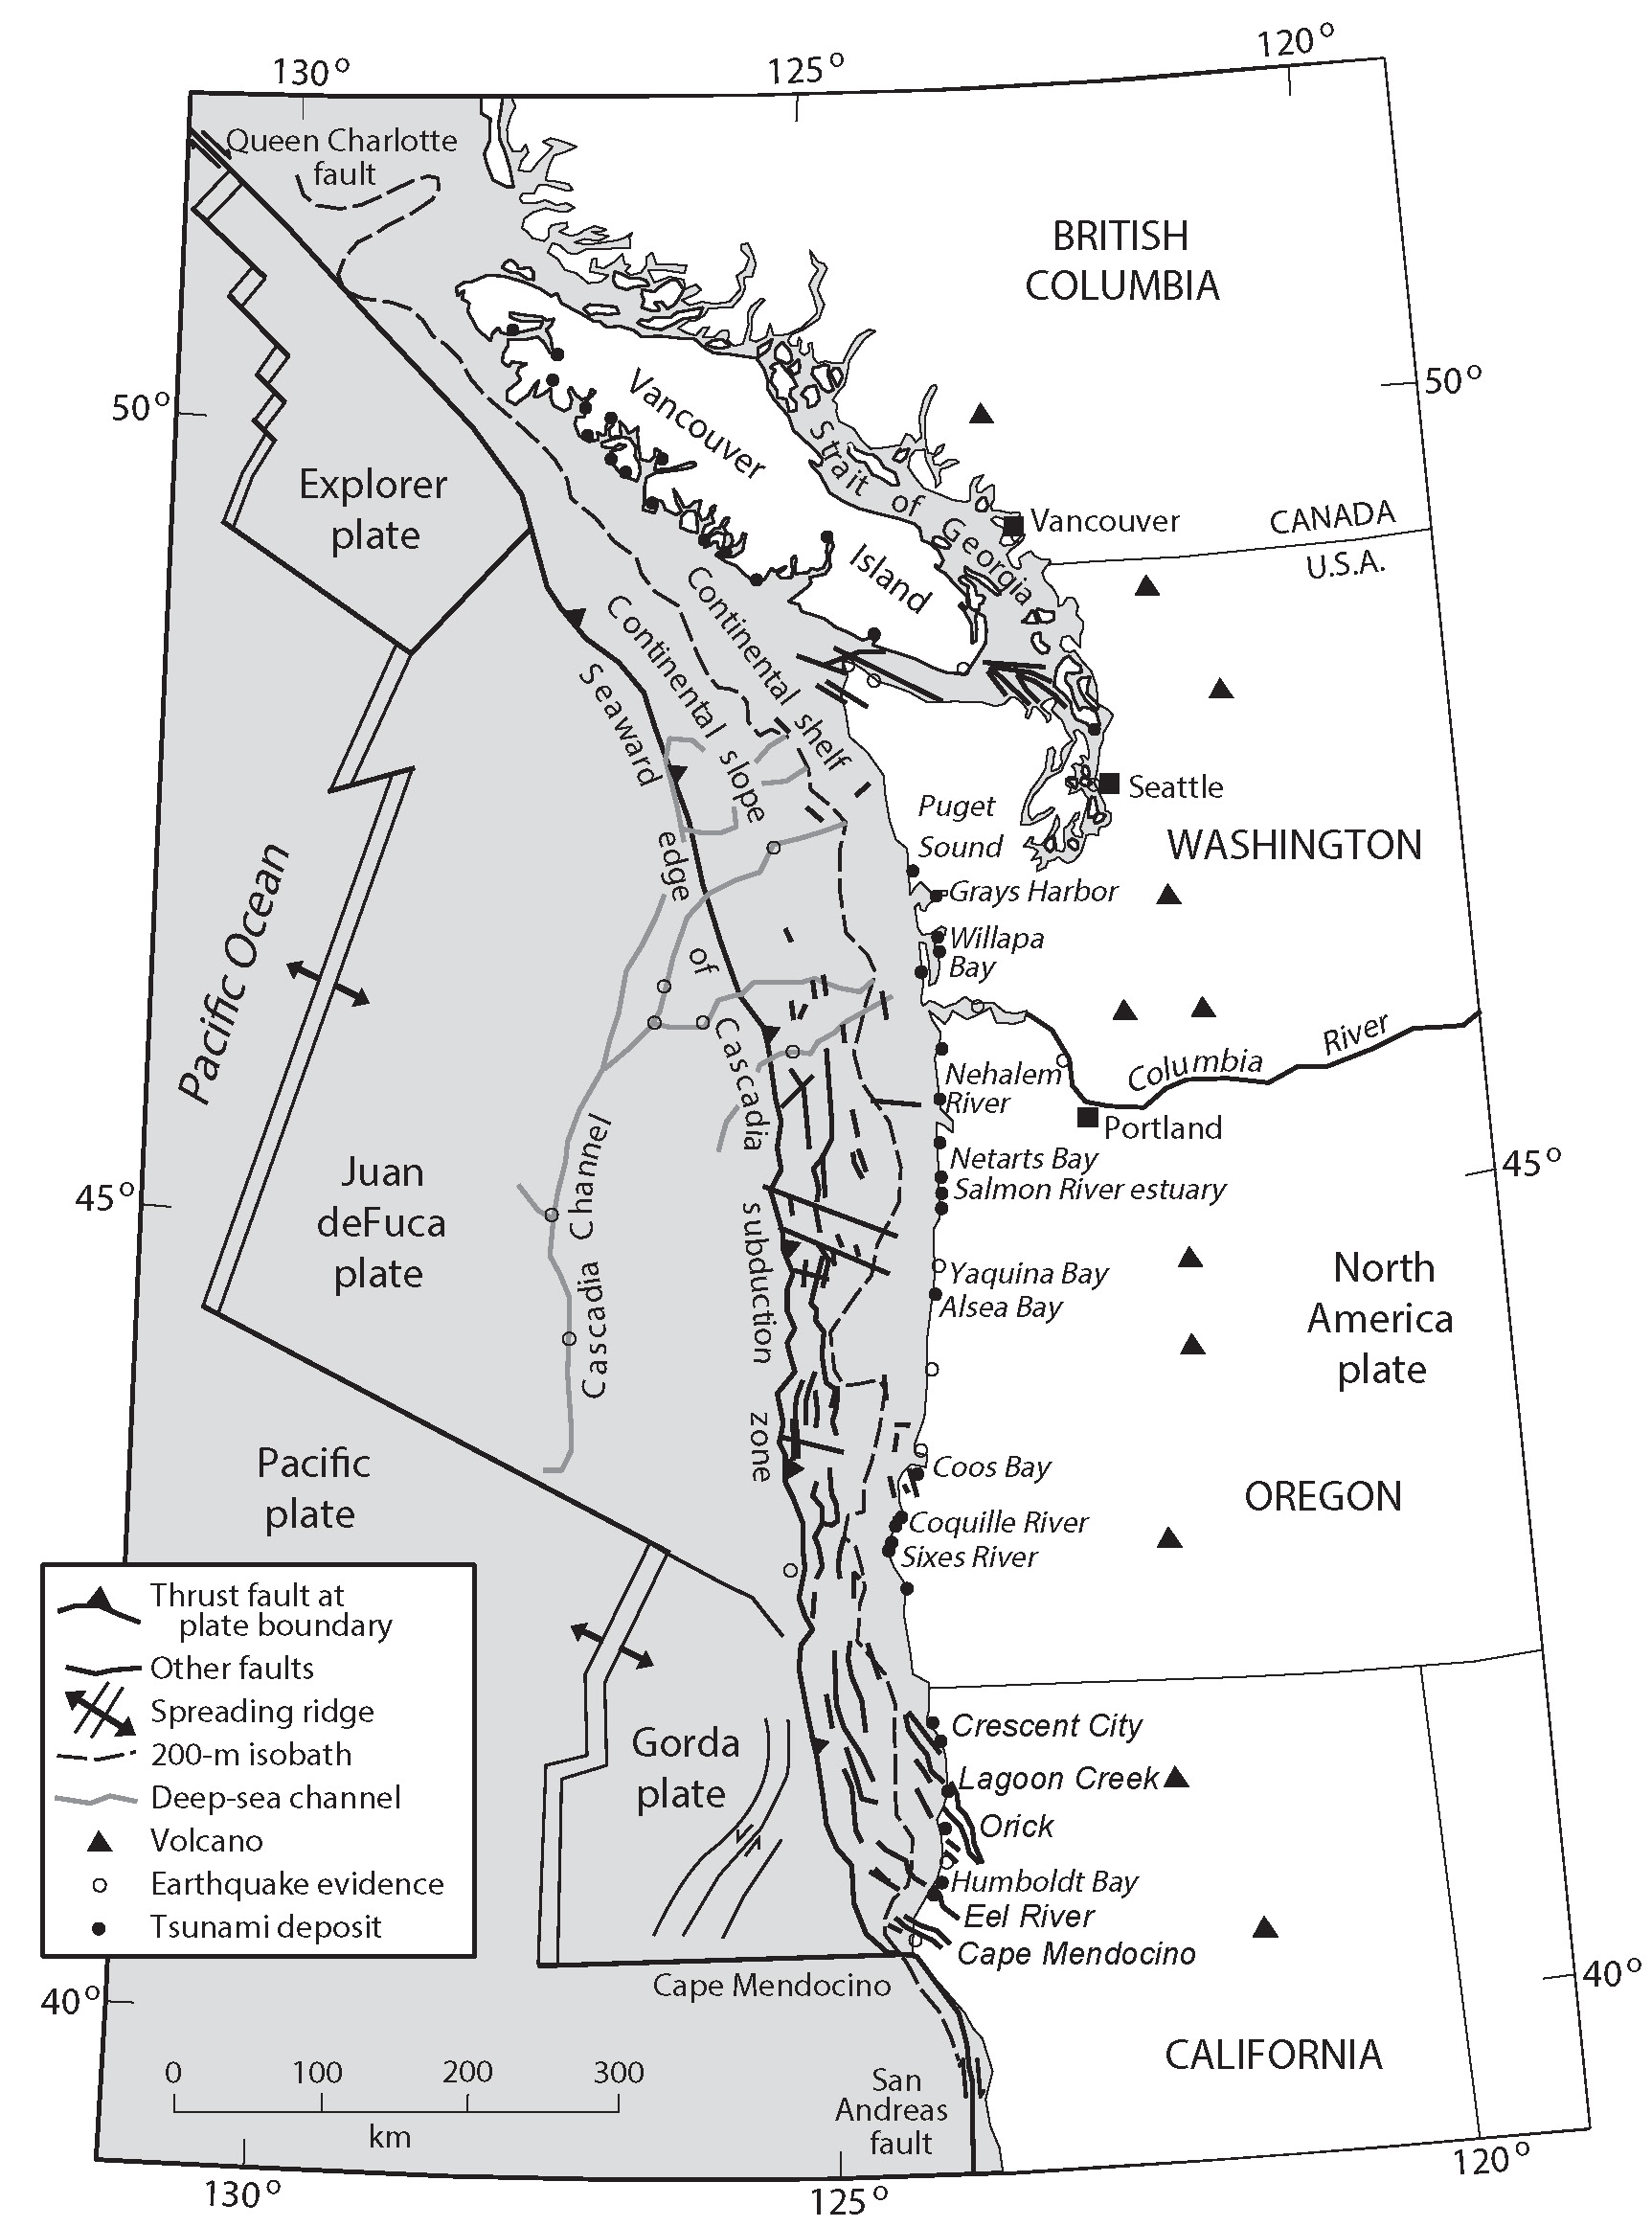
Here is a map of the CSZ that shows the orientation and configuration of these left-lateral strike-slip faults within the Gorda plate (modified from Chaytor et al., 2004 and Nelson et al., 2006).
Tomography is a technique that uses data collected from different locations to determine the structure of some interior phenomenon. Or, from Merriam Webster: a method of producing a three-dimensional image of the internal structures of a solid object (as the human body or the earth) by the observation and recording of the differences in the effects on the passage of waves of energy impinging on those structures. CT scans, or CAT scans (Computed Tomography of X-Rays), are an example that most people are familiar with. X-Rays are sent through a part of one’s body at different angles. The measurements of these X-Rays are compared with each other (cross-correlated) to produce the 3-D image of the interior of that body part.
Then the 3-D data can be sub-sampled into slices in order to evaluate the structure in more detail, at specific locations. Here is an example showing two “slices” from Wikipedia Commons:

Here is an example of a 3-D CT “volume” showing the tip of a finger, also from Wikipedia Commons. “Rotating image of Optical Coherence Tomography (OCT) tomogram of a fingertip, depicting stratum corneum (~500µm thick) with stratum disjunctum on top and stratum lucidum (connection to stratum spinosum) in the middle. At the bottom are superficial parts of the dermis. Sweatducts are clearly visible.”
I use CT data to look at sediment cores. Others use seismic waves to look at the interior structure of Earth. Porritt et al. (2011) use Ambient Noise Tomography (ANT) to look at the interior structure of the Cascadia subduction zone region. Porritt et al. (2011) use low amplitude seismic “noise” present at all seismic stations that is generated from a wide range of sources like waves and wind along shorelines to local man-made activities such as cars, trucks, and trains. These seismic data are known as “Ambient Noise”, noise in the background. By cross correlating long time series between stations, the common signal is retrieved while the incoherent energy cancels out. This leaves a signal that reveals information about seismic velocity between the two seismometers. By making measurements on these signals and using an array of stations for many ray paths, a three-dimensional image of the subsurface shear velocity can be determined.
Here is a vertical cross section, running North-South, of the Earth materials in the Cascadia subduction zone. They plot a histogram (a) of the percent of non volcanic tremor also plotted N-S (from Boyarko and Brudzinski, 2010). The topography is plotted also (b). Then they plot the “relative shear velocity structure along a profile where the slab is at 30 km depth (profile location shown in d). Vertical lines on profile at 43°N and 46.7°N indicate the tremor segmentation bounds of Brudzinski and Allen (2007) with the names and recurrence interval given. The horizontal line is the top of the ocean crust from Audet et al. (2010). Also labeled are the slab sections corresponding to the Gorda, Southern Juan de Fuca (S. JdF) and Northern Juan de Fuca (N. JdF).” Based upon the differences in position of the Gorda and S. JDF plates, we can see why I interpret these data to support the hypothesis that the Blanco fracture zone extends east past the Cascadia subduction zone fault tip. dVs% is the deviation of S-wave seismic velocity from some value. Blue colors represent Earth materials with high S-wave velocities and red colors represent Earth materials with low S-Wave velocities. Siletizia and the Klamath Mountains are regions of high seismic velocity in the upper North America plate. The propagation velocity of the waves depends on density and elasticity of Earth’s materials. Velocity tends to increase with depth, and ranges from approximately 2 to 8 km/s in the Earth’s crust up to 13 km/s in the deep mantle (Shearer, 1999).

Here is a primer for those that want to learn about moment tensors (MT) and focal mechanisms (FM). While MT and FM are determined differently, their graphical depiction is analogous. Here is the USGS web page that describes the figure below in detail. Here is the USGS web page that describes how a moment tensor is determined.
- References:
- Audet, P., Bostock, M.G., Boyarko, D.C., Brudzinski, M.R., Allen, R.M., 2010. Slab morphology in the Cascadia fore arc and its relation to episodic tremor and slip. J. Geophys. Res. 115, B00A16. doi:10.1029/2008JB006053.
- Boyarko, D.C., Brudzinski, M.R., 2010. Spatial and temporal patterns of nonvolcanic tremor along the southern Cascadia subduction zone. J. Geophys. Res. 115, B00A22. doi:10.1029/2008JB006064.
- Brudzinski, M., Allen, R.M., 2007. Segmentation in episodic tremor and slip all along Cascadia. Geology 35 (10), 907–910. doi:10.1130/G23740A.1.
- Chaytor, J.D., Goldfinger, C., Dziak, R.P., and Fox, C.G., 2004. Active deformation of the Gorda plate: Constraining deformation models with new geophysical data: Geology v. 32, p. 353-356.
- Nelson, A.R., Kelsey, H.M., and Witter, R.C., 2006. Great earthquakes of variable magnitude at the Cascadia subduction zone: Quaternary Research, doi:10.1016/j.yqres.2006.02.009, p. 354-365.
- Porritt, R.W., Allen, R.M., Boyarko, D.C., Brudzinski, M.R., 2011. Investigation of Cascadia segmentation with ambient noise tomography. Earth and Planetary Science Letters 309, 67-76.
- Shearer, P.M. 1999. Introduction to seismology. Cambridge Univ. Press, 1999, isbn 0 521 669 53 7
5 thoughts on “Blanco fracture zone strikes again”