Yesterday (I was busy getting a Mt. St. Helens field trip together, here is the link for that) we had an earthquake with a magnitude M = 6.1. While this is not a large earthquake, it is notable because this part of the subduction zone fault is thought to have a large slip deficit. In other words, this part of the fault has been accumulating sufficient strain that we think it is ready to go. In today’s post, I will discuss the seismicity of the past decade in this region and I will follow up with a post where I present more on what we think about the current state of stress on the fault, based on the work of my colleagues.
Here are the USGS web pages for the earthquakes I will discuss in this post:
- 2004.12.26 Mw 9.15
- 2005.3.28 Mw 8.6
- 2007.9.12 Me 8.5
- 2007.9.12 Mw 7.9
- 2007.9.13 Mw 7.0
- 2012.4.11 Mw 8.2
- 2012.4.11 Mw 8.6
- 2015.3.3 Mw 6.1
Here are a couple posts I put together regarding the initial instigator to this entire series of earthquakes (Mw = 9.15) and then the two largest strike slip earthquakes ever recorded (Mw = 82 and 8.6).
- Looking Back Part 1
- Looking Back Part 2
- 2012 Outer Rise Earthquakes
- Updated maps for the Outer Rise Earthquakes
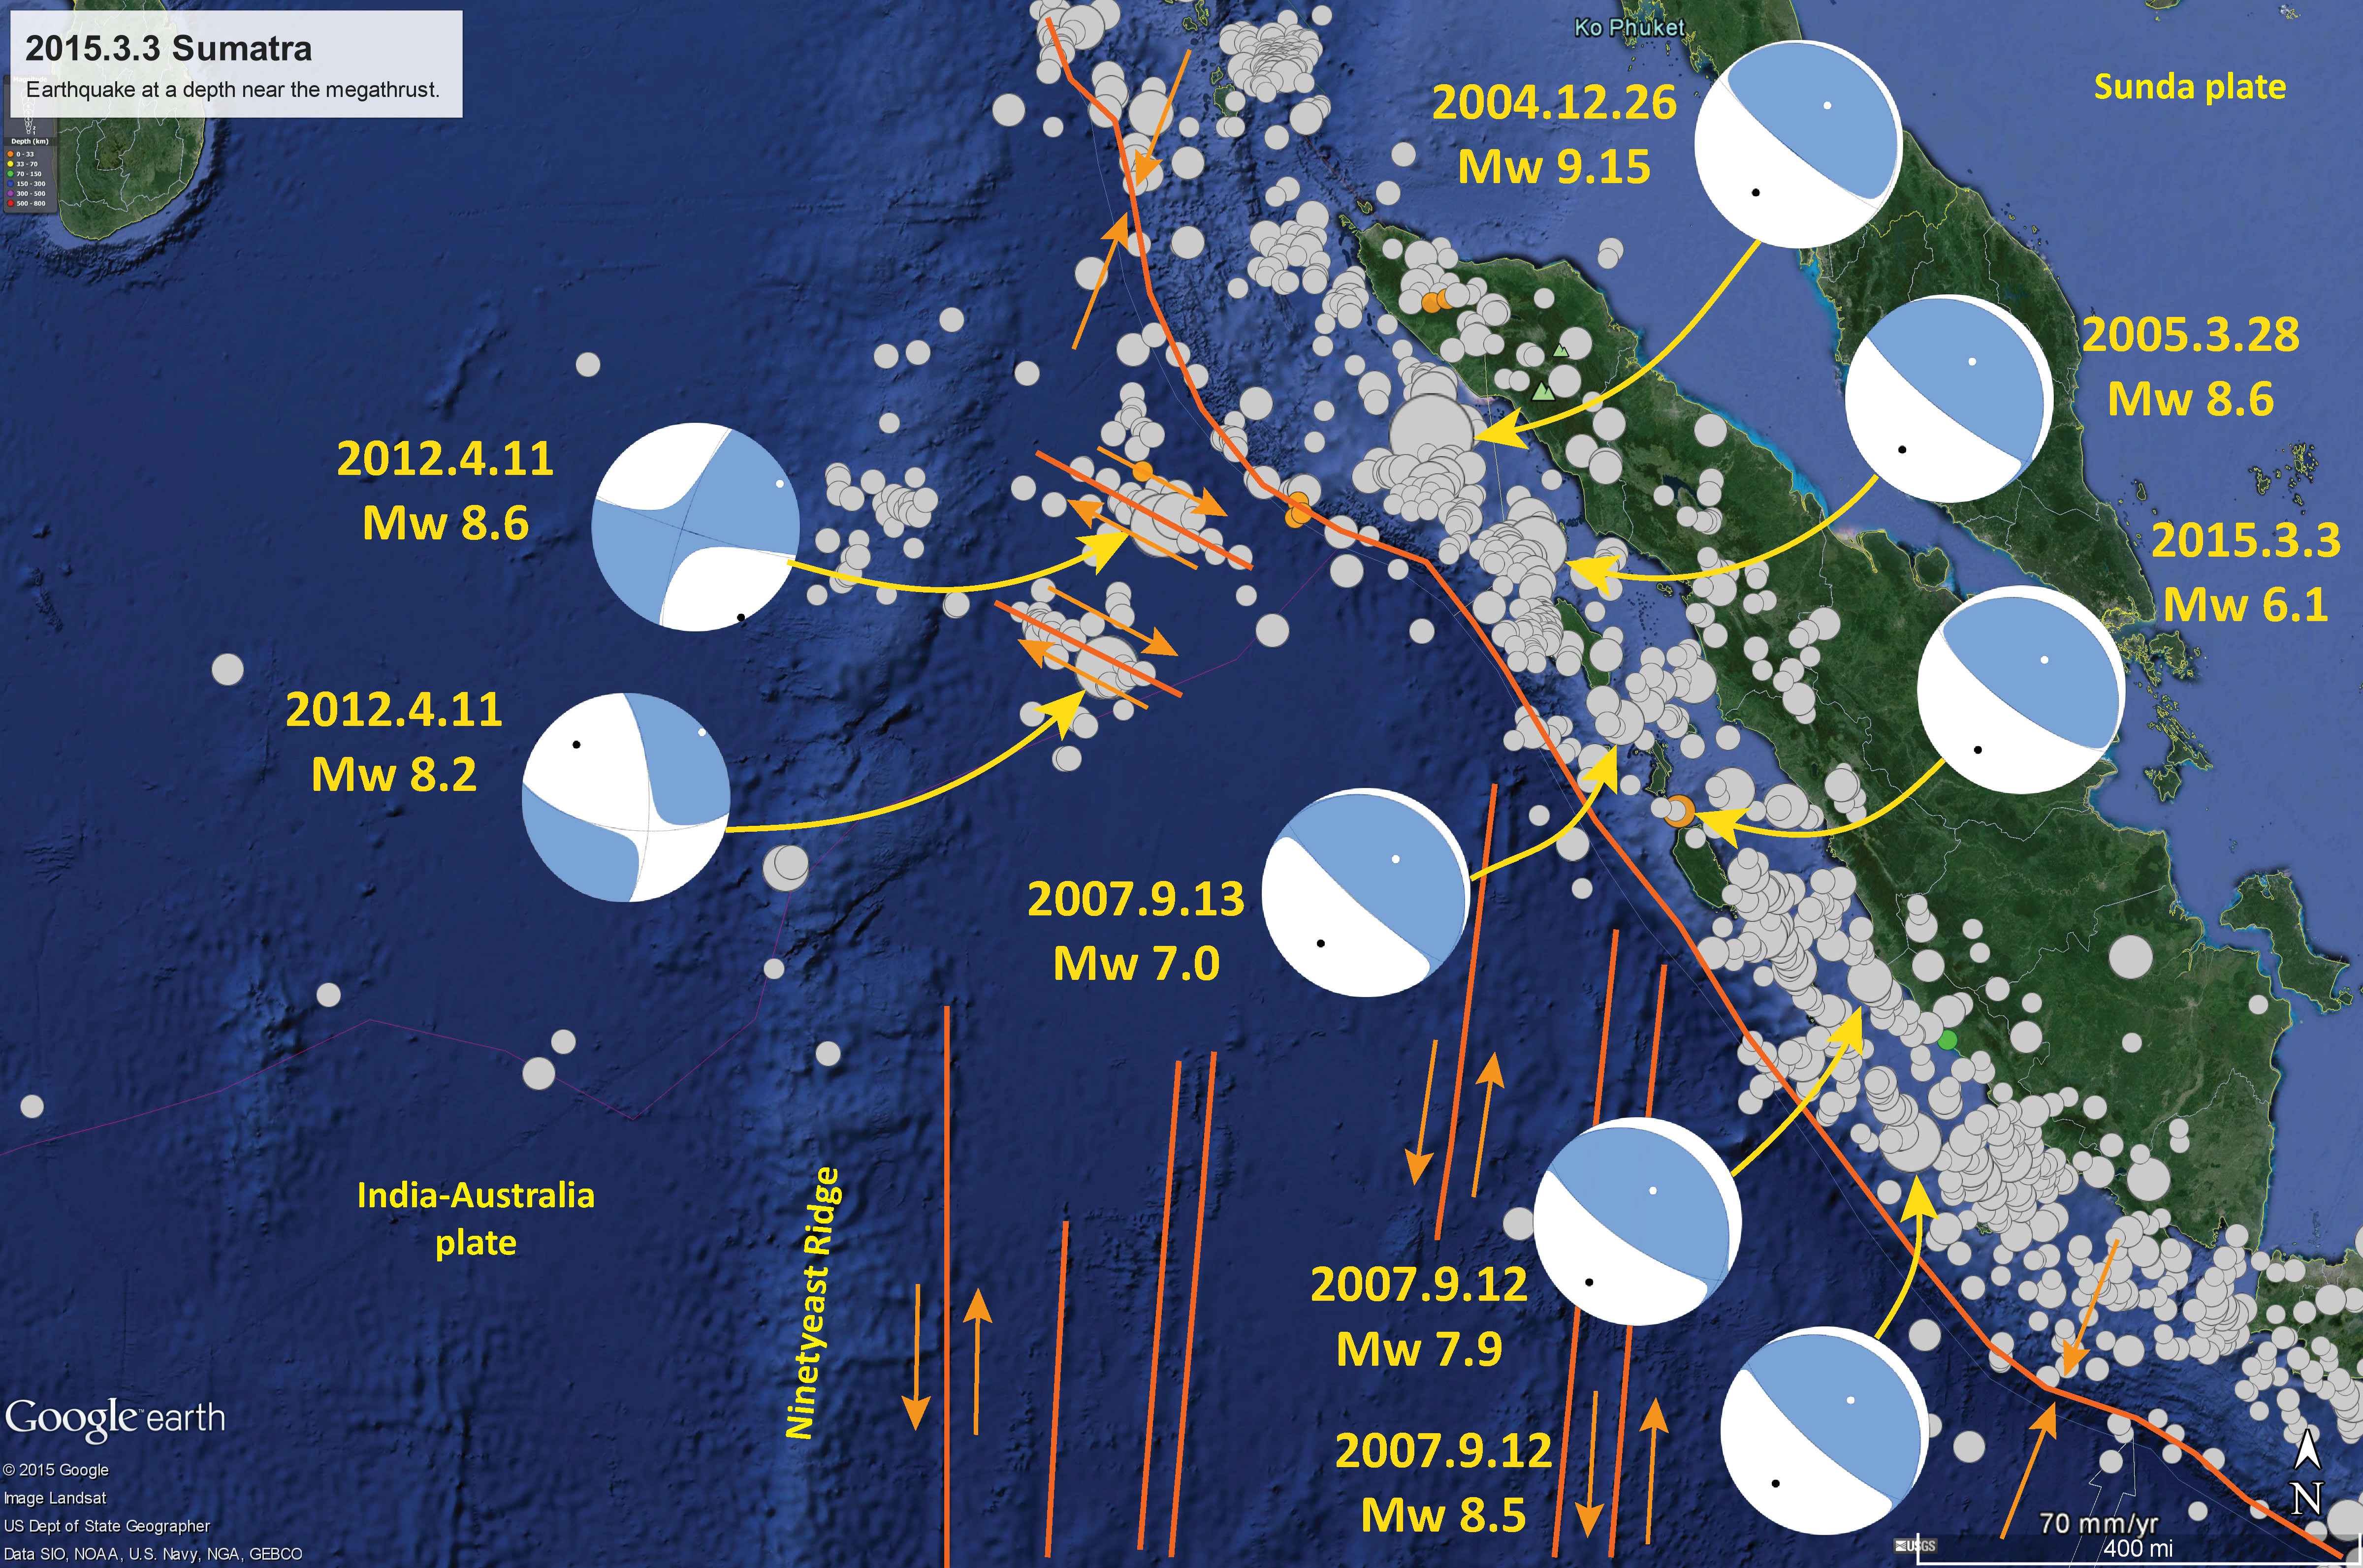
Here is a map showing moment tensors for the largest earthquakes since the 26 December 2004 Mw = 9.15 Megathrust Great Sumatra-Andaman subduction zone (SASZ) earthquake. Below is a map showing the earthquake slip contours. The beginning of this series started with the Mw 9.15 and Mw = 8.7 Nias earthquakes. There were some other earthquakes along the Mentawaii patch to the south (Mw = 8.5, 7.9, and 7.0). These were also subduction zone earthquakes, but failed to release the strain that had accumulated since the last large magnitude earthquakes to have slipped in this region in 1797 and 1833 (more on this in my next post). In 2012 we had two strike slip earthquakes in the outer rise, where the India-Australia plate flexes in response to the subduction. At first I interpreted these to be earthquakes on northeast striking faults since those the orientation of the predominant faulting in the region. The I-A plate has many of these N-S striking fracture zones, most notably the Investigator fracture zone (the most easterly faults shown in this map as a pair of strike slip faults that head directly for the epicenter of yesterday’s earthquake). However, considering the aftershocks and a large number of different analyses, these two earthquakes (the two largest strike slip earthquakes EVER recorded!) were deemed to have ruptured northwest striking faults. We called these off fault earthquakes, since the main structural grain is those N-S striking fracture zones. Also of note is the focal depth of these two large earthquakes (Mw 8.2 & 8.6). These earthquakes ruptured well into the mantle. Before the 2004 SASZ earthquake and the 2011 Tohoku-Oki earthquake (which also probably ruptured into the mantle), we would not have expected earthquakes in the mantle.
As a primer for those who want it, here is an info graphic that explains what the graphical representation of a focal mechanism is. Moment Tensors are determined differently, but their graphical representation is similar (so the info graphic can still help understand them). The text that goes along with this infographic is from the USGS here.
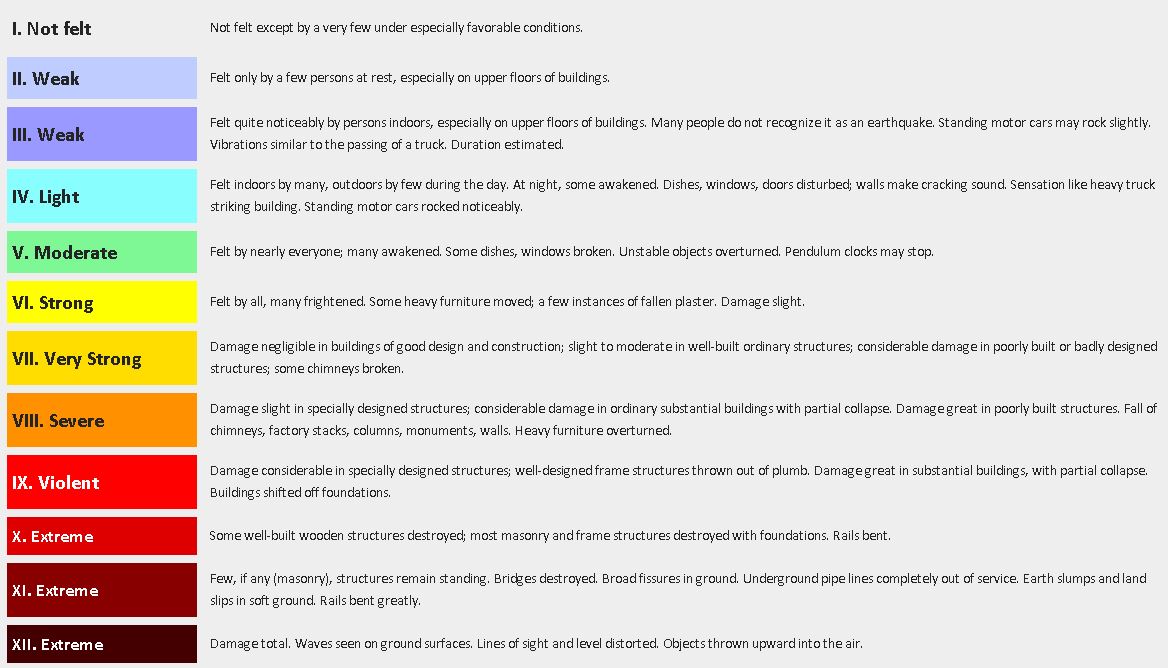
This map shows the Modified Mercalli [Shaking] Intensity contours modeled for this Mw 6.1 earthquake. These are just modeled values and not based on felt reports. The MMI scale is based on a qualitative measure of shaking intensity. This method of determining shaking intensity is very useful for regions of the world that do not have seismometers to record ground motions.

Here is one example of the MMI scale from the wiki site.
This shows how the model used in the above MMI map attenuates the ground motion with distance from the earthquake. Basically, seismic energy radiates outward from the earthquake focus and, therefore, diminishes with distance. The reported data are the small green dots which are averaged into the orange dots. There are only three reports for this earthquake, so the model is poorly constrained. Note, once again, that this location attenuates seismic energy much like the region modeled in California (which is largely accreted terrain, much like this region of Sumatra).

This is the pager file that shows an estimate of exposure to the hazards posed by this Mw 6.1 earthquake. This is based on the modeling in the above map (also shown in this map) and there are histograms depicting the estimated losses to people’s lives and their belongings (roads, buildings, etc.).

This map shows the slab contours for the subduction zone (Hayes et al., 2012). These contours are based largely upon historical seismicity. Since there is considerable depth variation for these earthquakes, the fault interface is not too well constrained in this way. If we had dozens of drill holes to constrain the fault location, that would be better (though orders of magnitude more expensive). The two shallowest depth contours are 20 and 40 km. So, the Mw 6.1 earthquake, with a hypocentral depth of ~28 km, fits nicely with this slab model.

References:
- Hayes, G. P., D. J. Wald, and R. L. Johnson (2012), Slab1.0: A three-dimensional model of global subduction zone geometries, J. Geophys. Res., 117, B01302, doi:10.1029/2011JB008524.