Here is an update to my post earlier on the 2004 Sumatra-Andaman subduction zone earthquake of 2004/12/26 (about a decade ago).
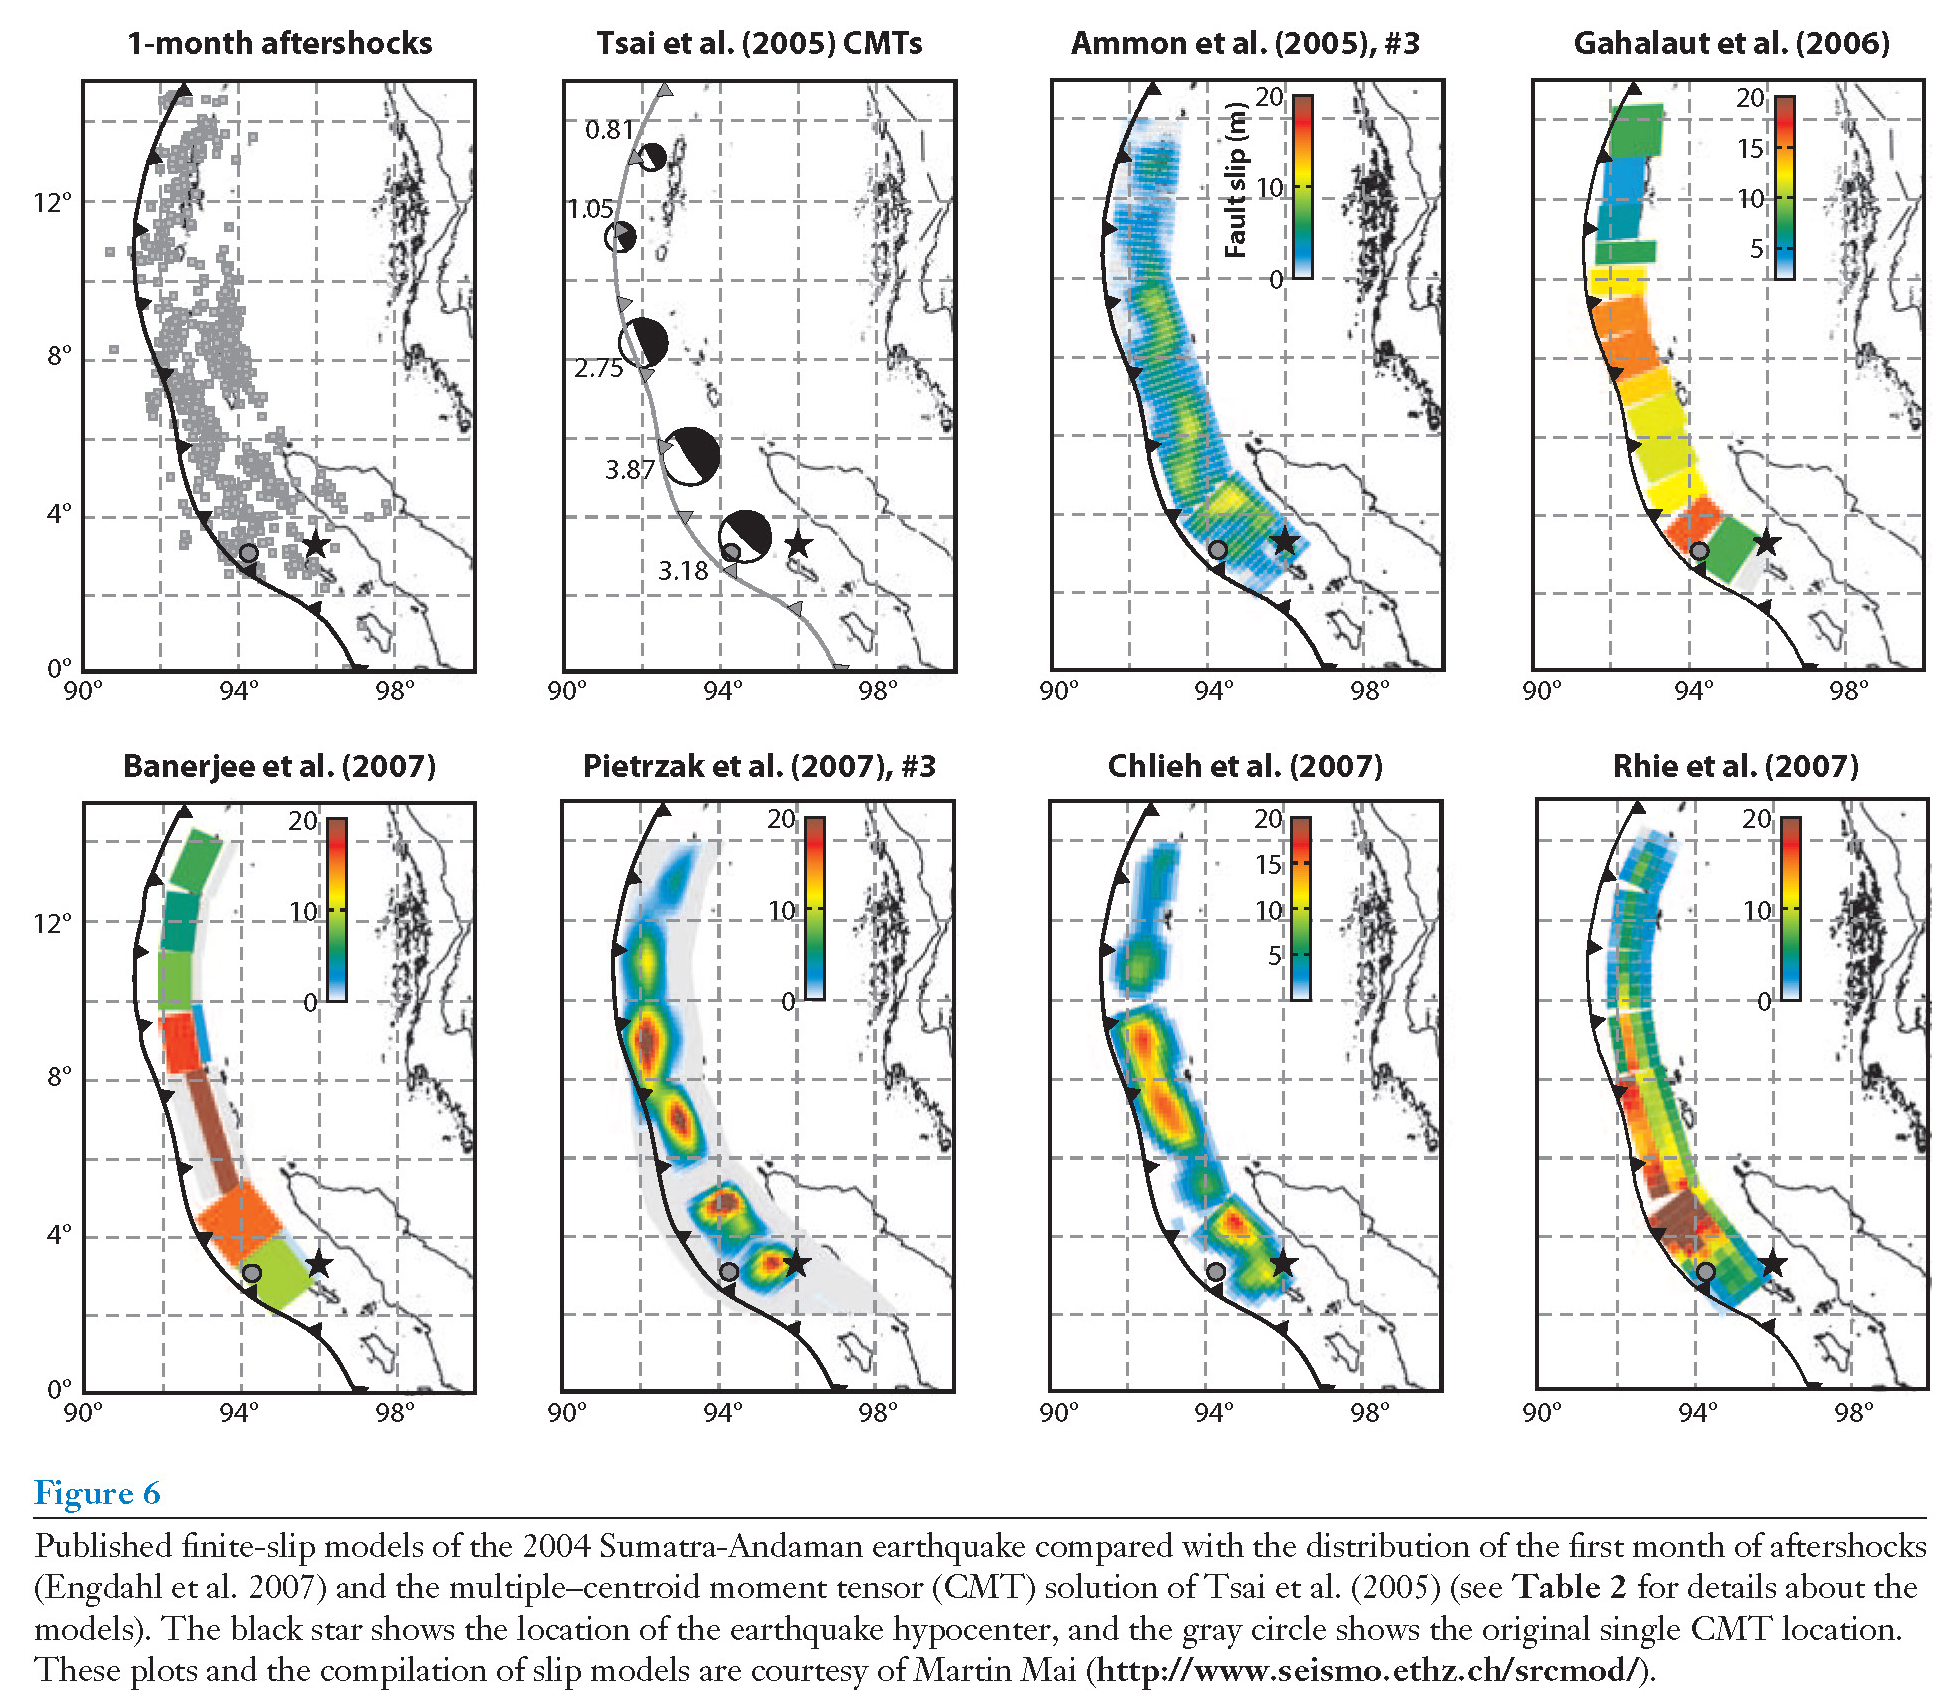
This series of plots show the large variation in non unique slip models for this earthquake. The authors divide the fault into hypothetical fault segments and impart an amount of slip on each segment (typically a rectangle shaped region). Then they use their models (elastic half space, basically, a 3-D model of the earth that is assumed to have some material properties that are elastic, plastic, and viscous). The motion of the earth is propagated from the fault upwards to the ground surface. The result of this ‘half space’ modeling is a map that shows vertical (or horizontal) deformation. The authors then compare their model results with direct observations of vertical deformation from measurements like those collected at GPS sites. These slip model results can also be compared with other observations, like tsunami wave heights, to better resolve the resolution of slip on the fault (either the amount of slip, the variation of slip (like with different sized rectangle fault segments, the material properties of the earth, and/or a combination of all of these). This figure is from Shearer and Burgman (2010).
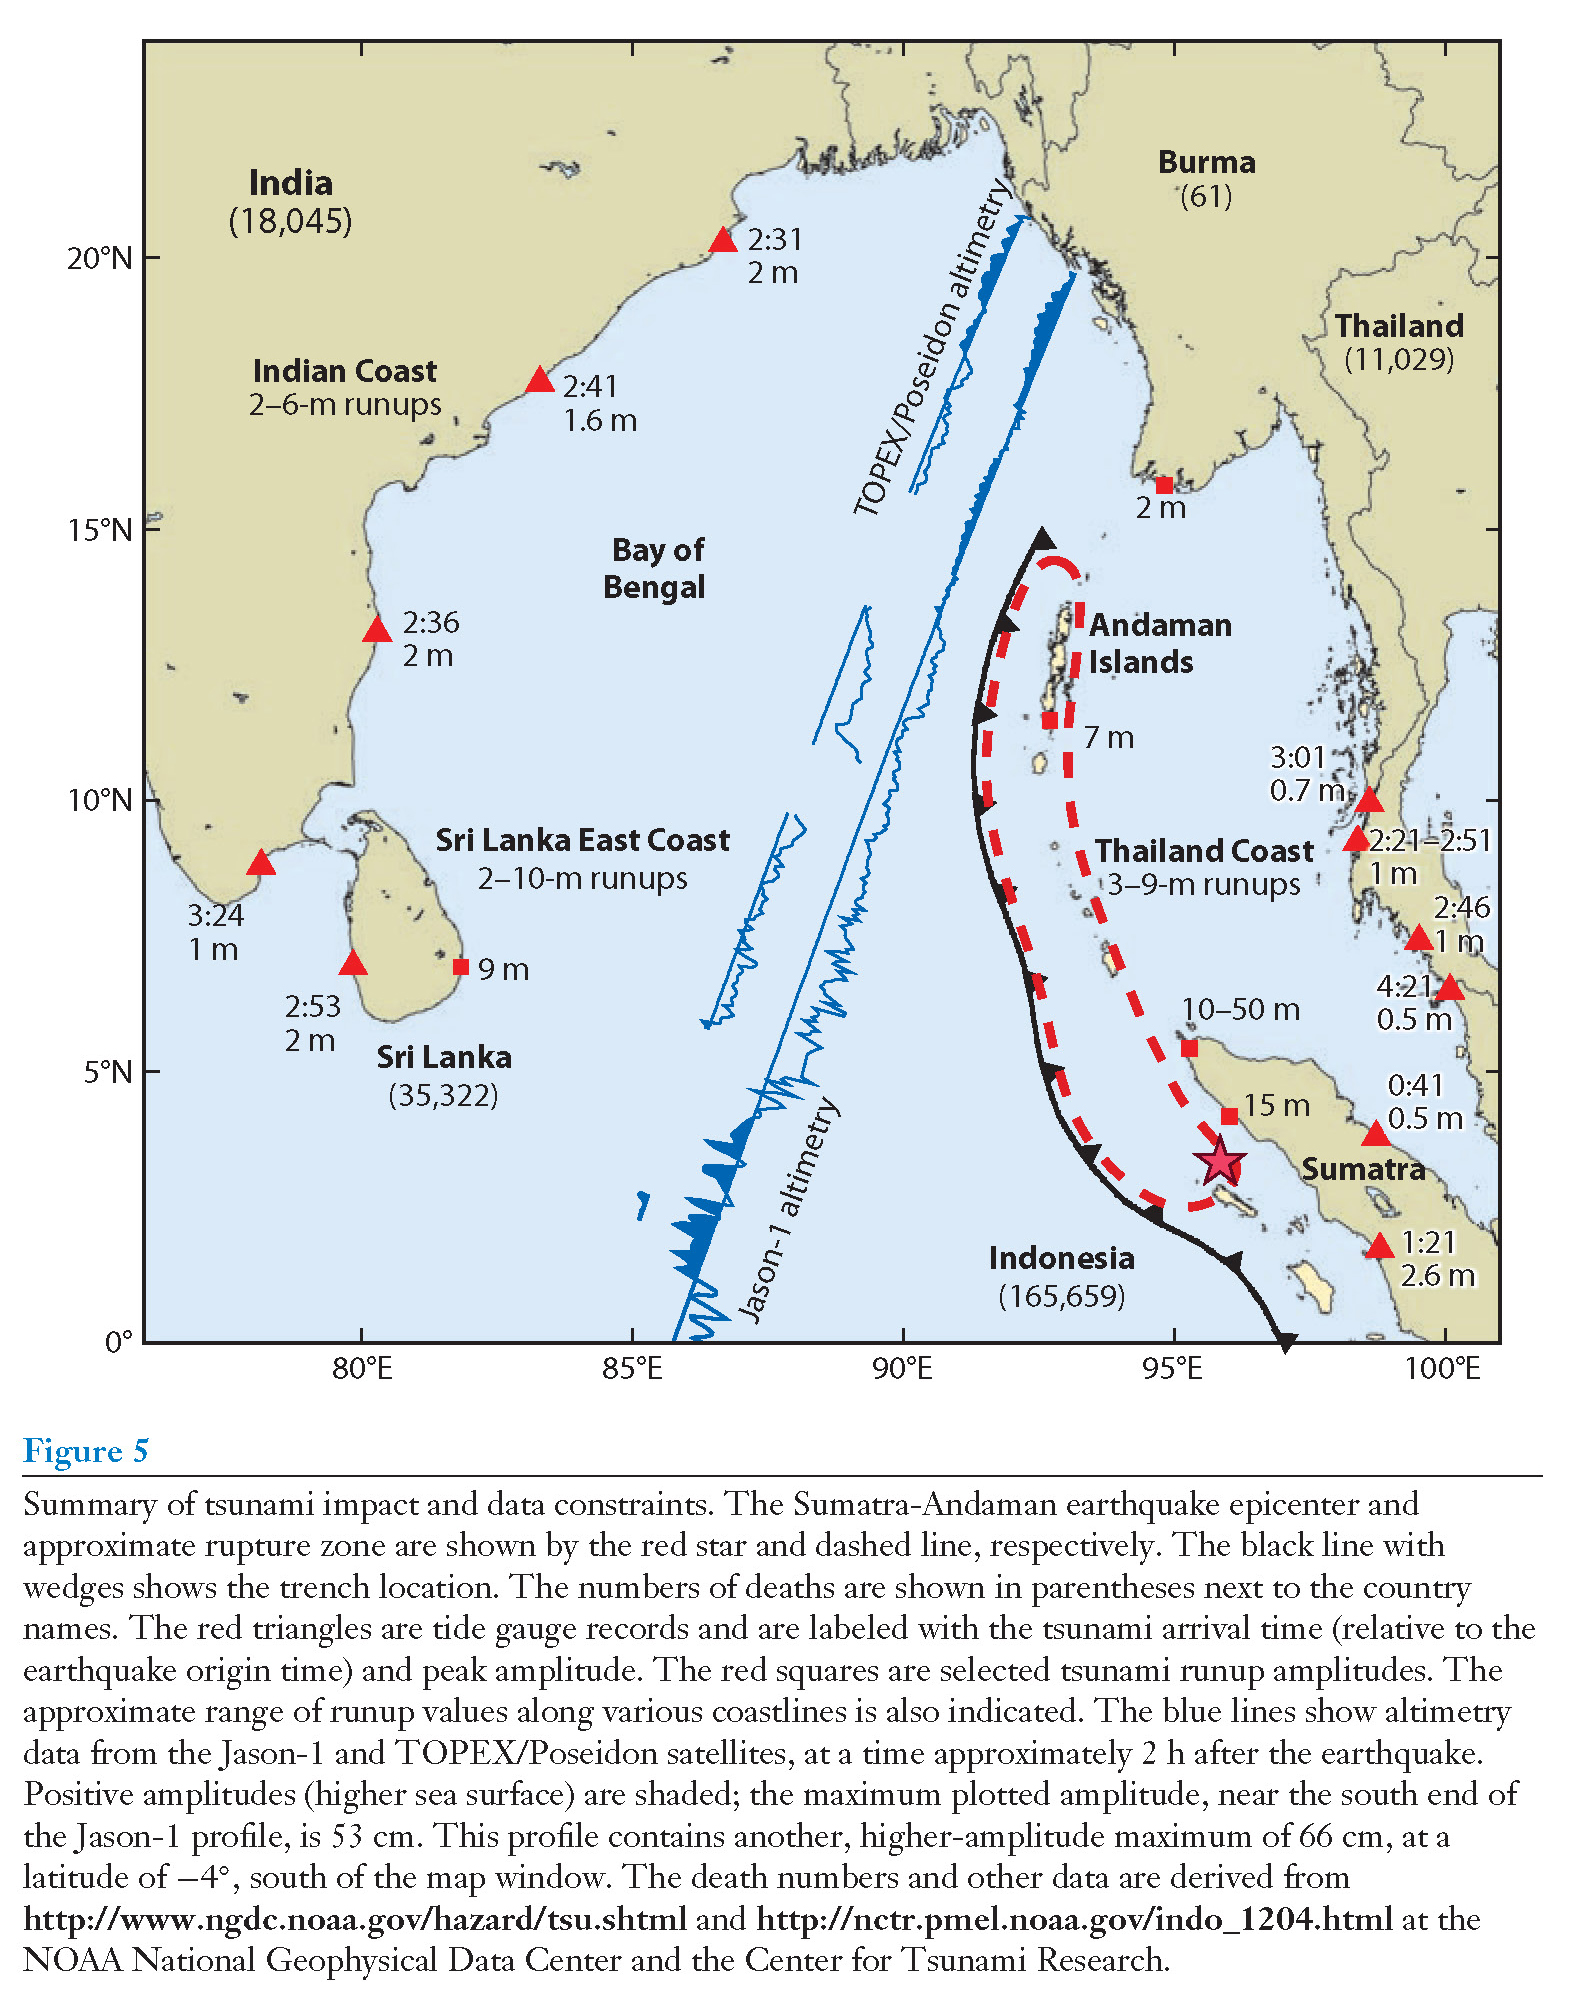
Here is a figure that shows the wave height observations from satellites that happened to be passing over the Indian Ocean as the tsunami crossed towards India and Sri Lanka (Shearer and Burgman 2010).
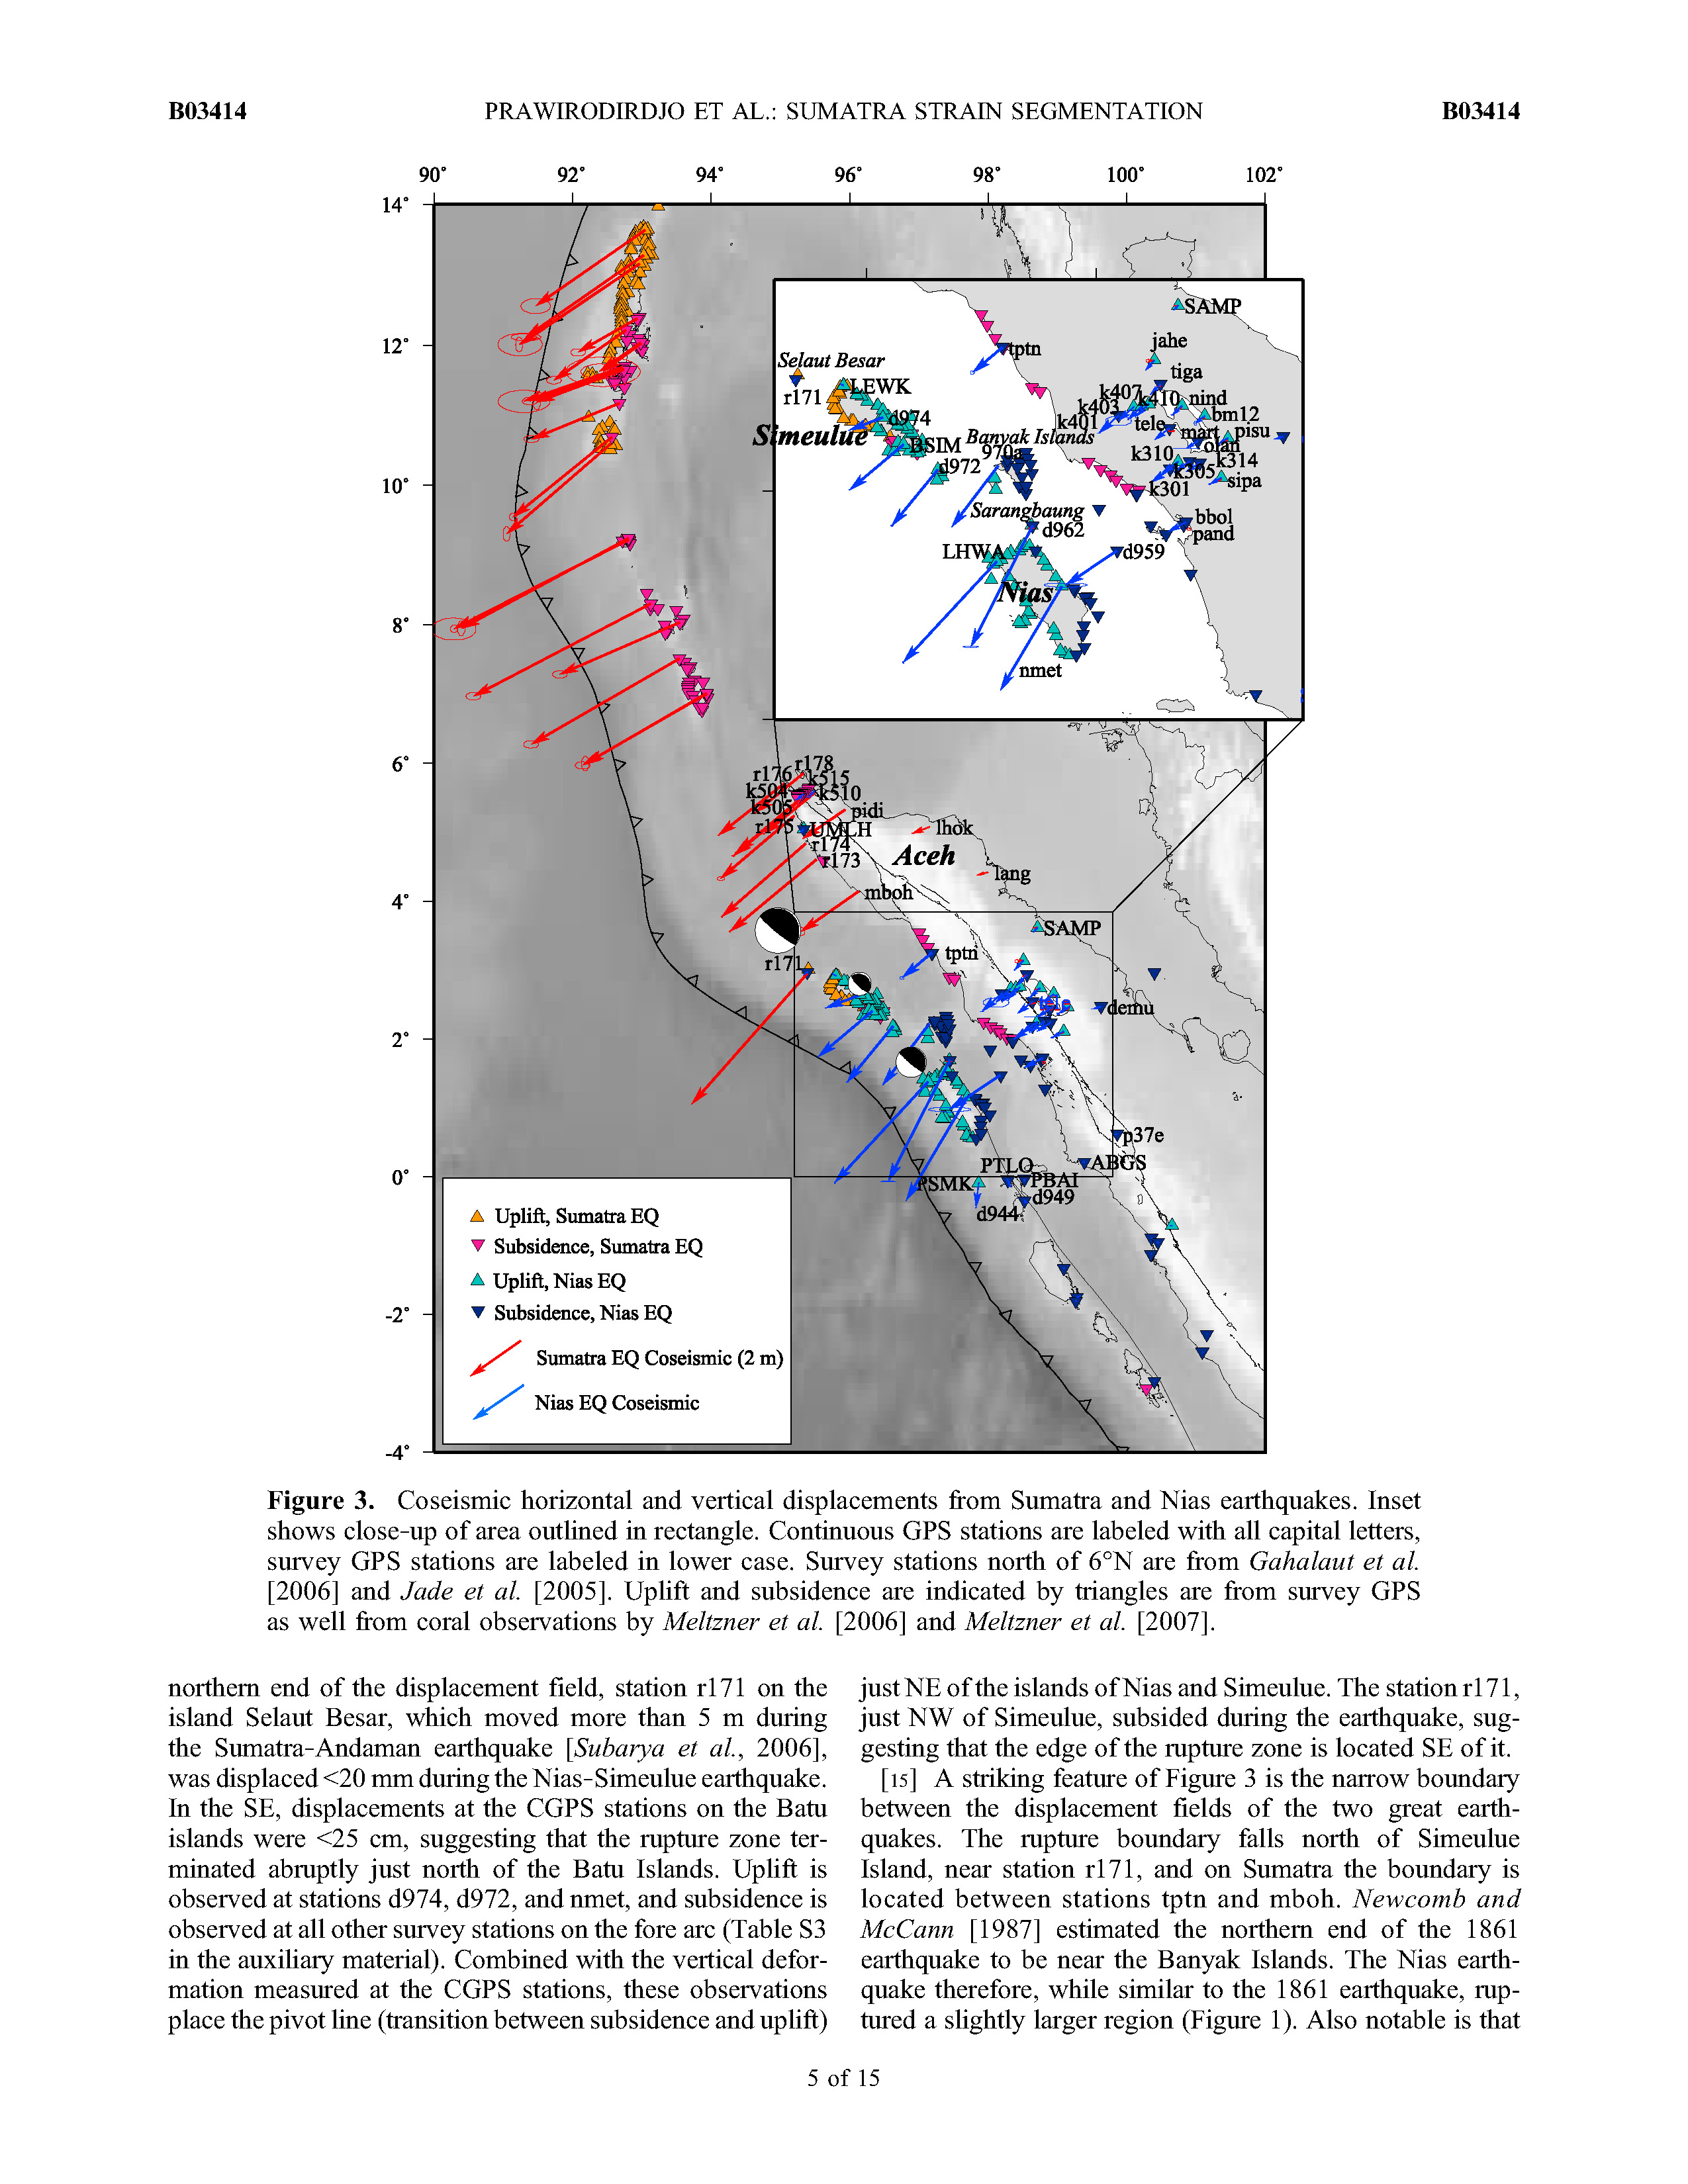
These two figures show coseismic vertical and horizontal motions from the 2004 and 2005 earthquakes (Prawirodirdjo et al., 2010). The first figure shows the sense of motion vertically and the sense and amount of motion horizontally as measured at GPS sites.
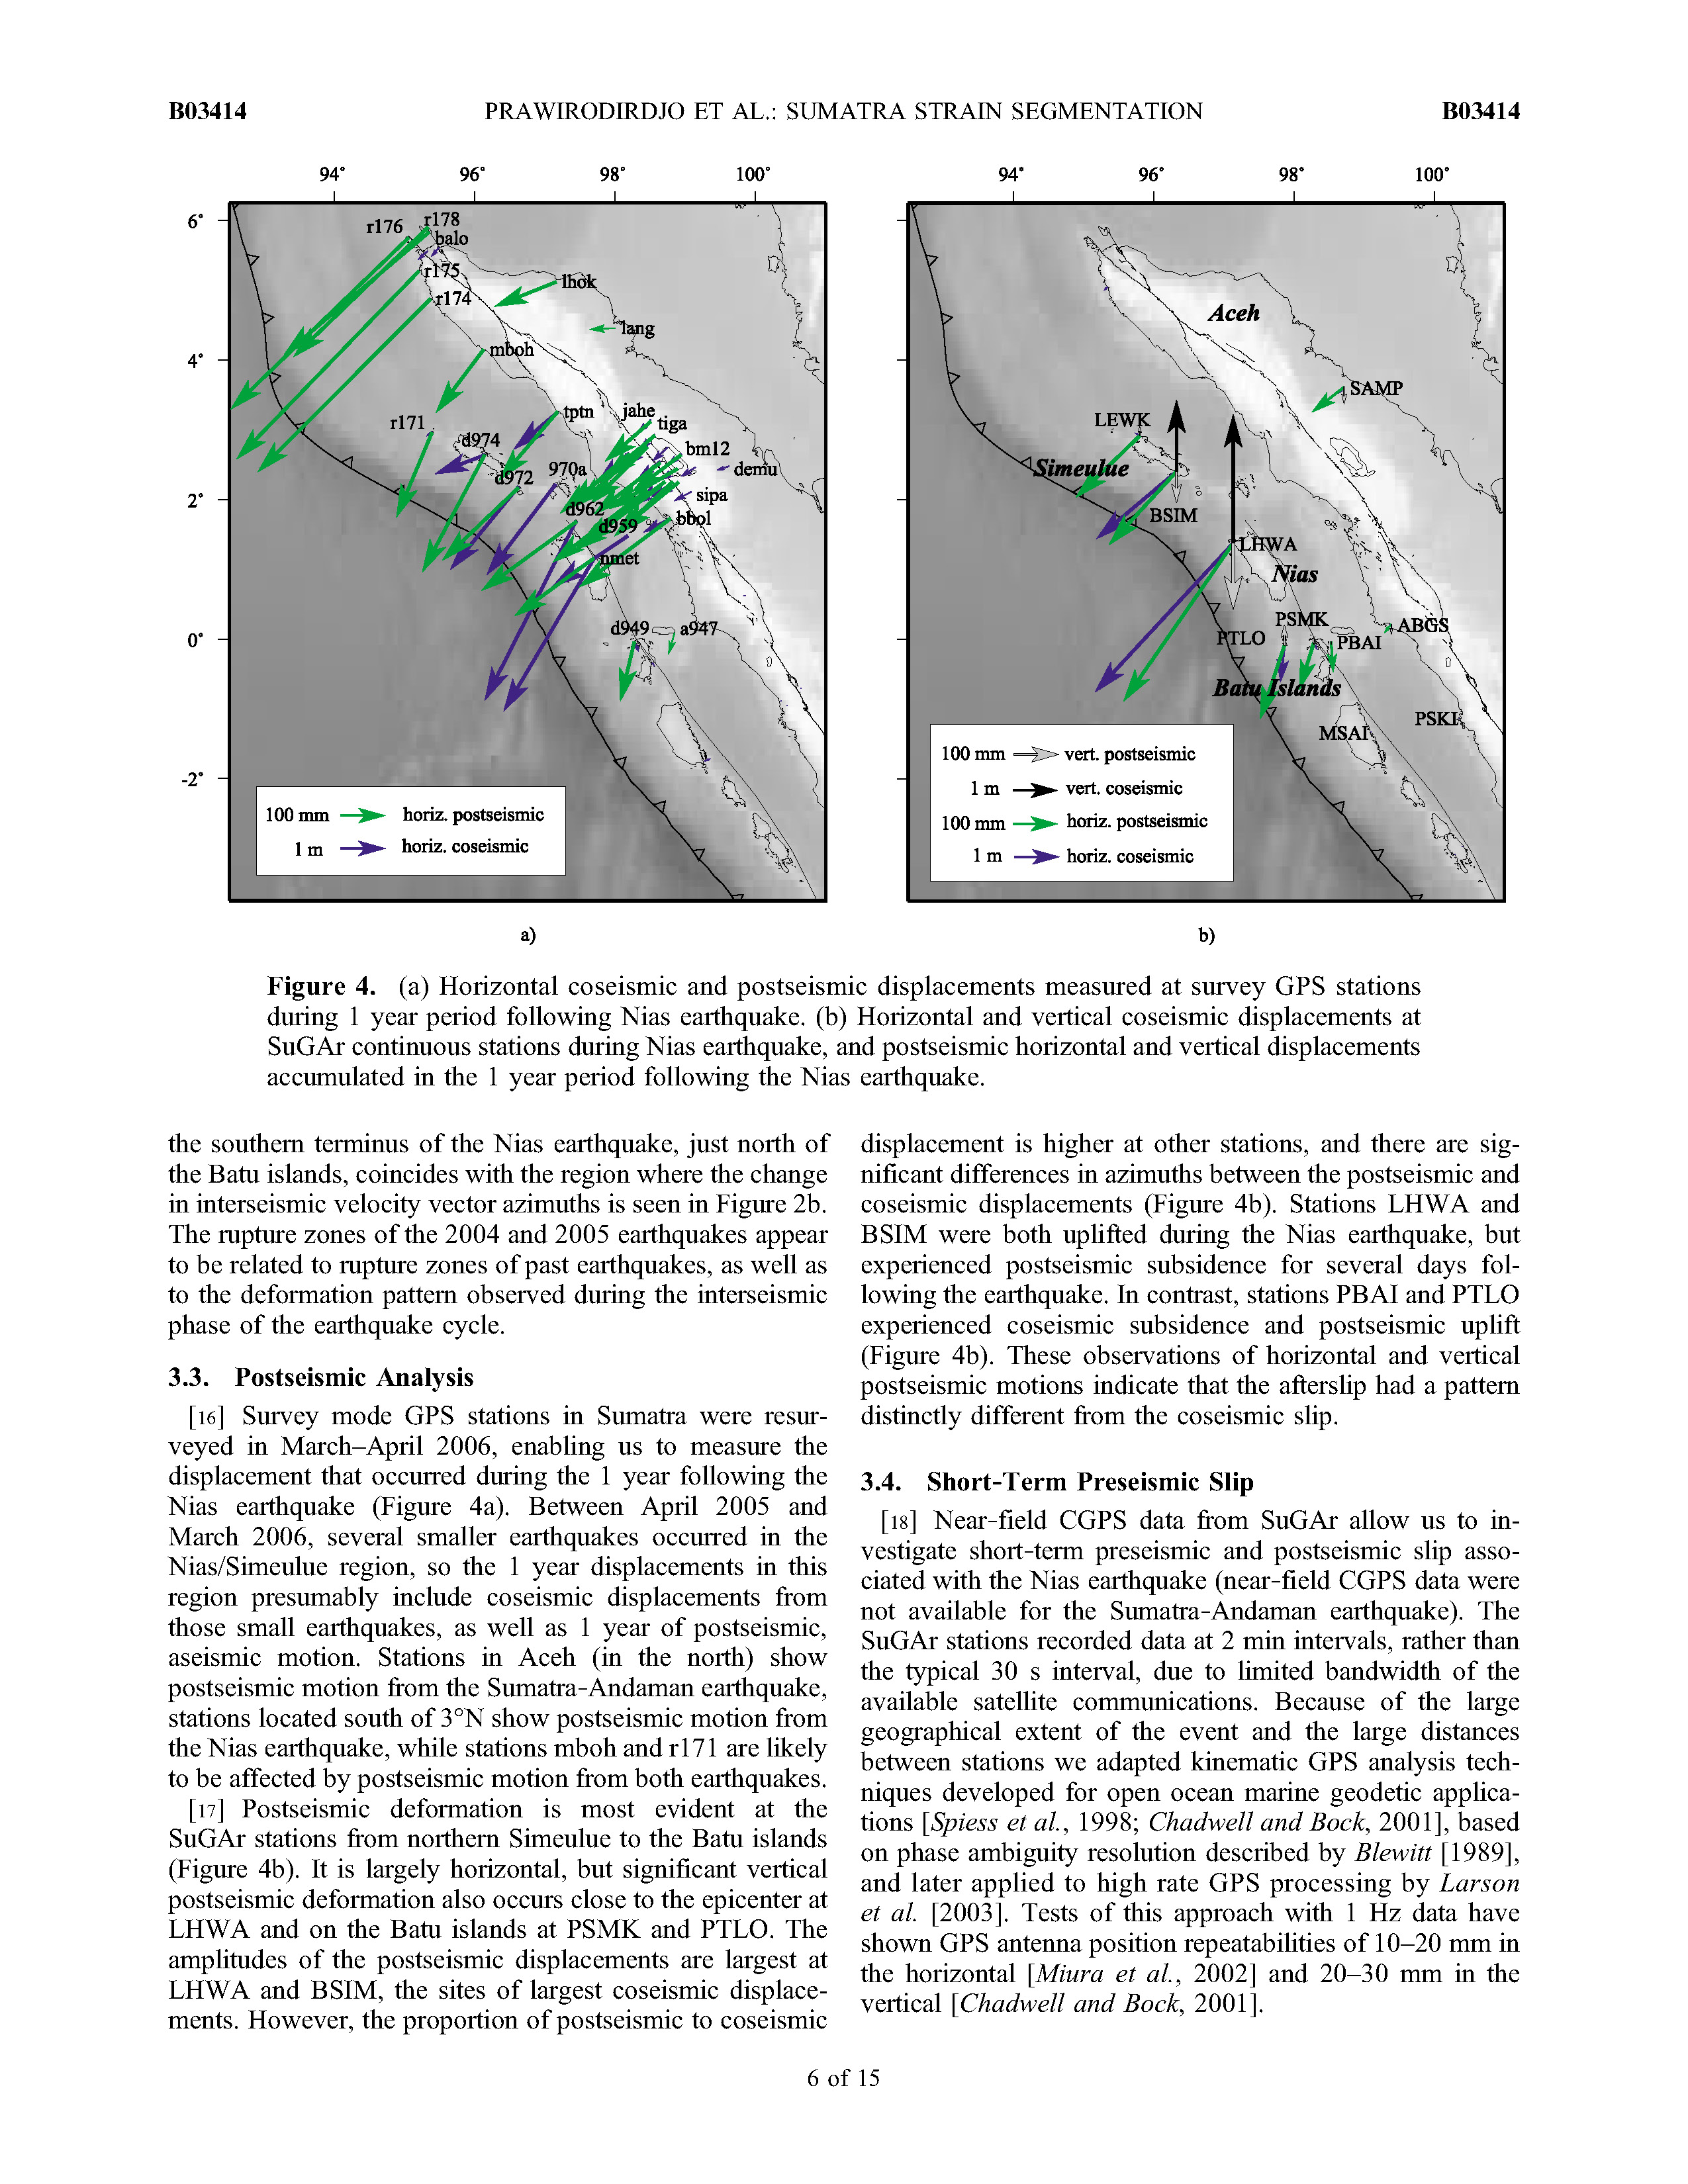
This second figure from Prawirodirdjo et al. (2010) shows the amount of horizontal coseismic and postseismic deformation for the 2004 earthquake and the amount of coseismic vertical and horizontal deformation during the 2005 earthquake. These are the types of data that people use to validate their slip models. The slip models in the above figure show that there is large variation in their solutions, demonstrating that these results are largely equivocal.
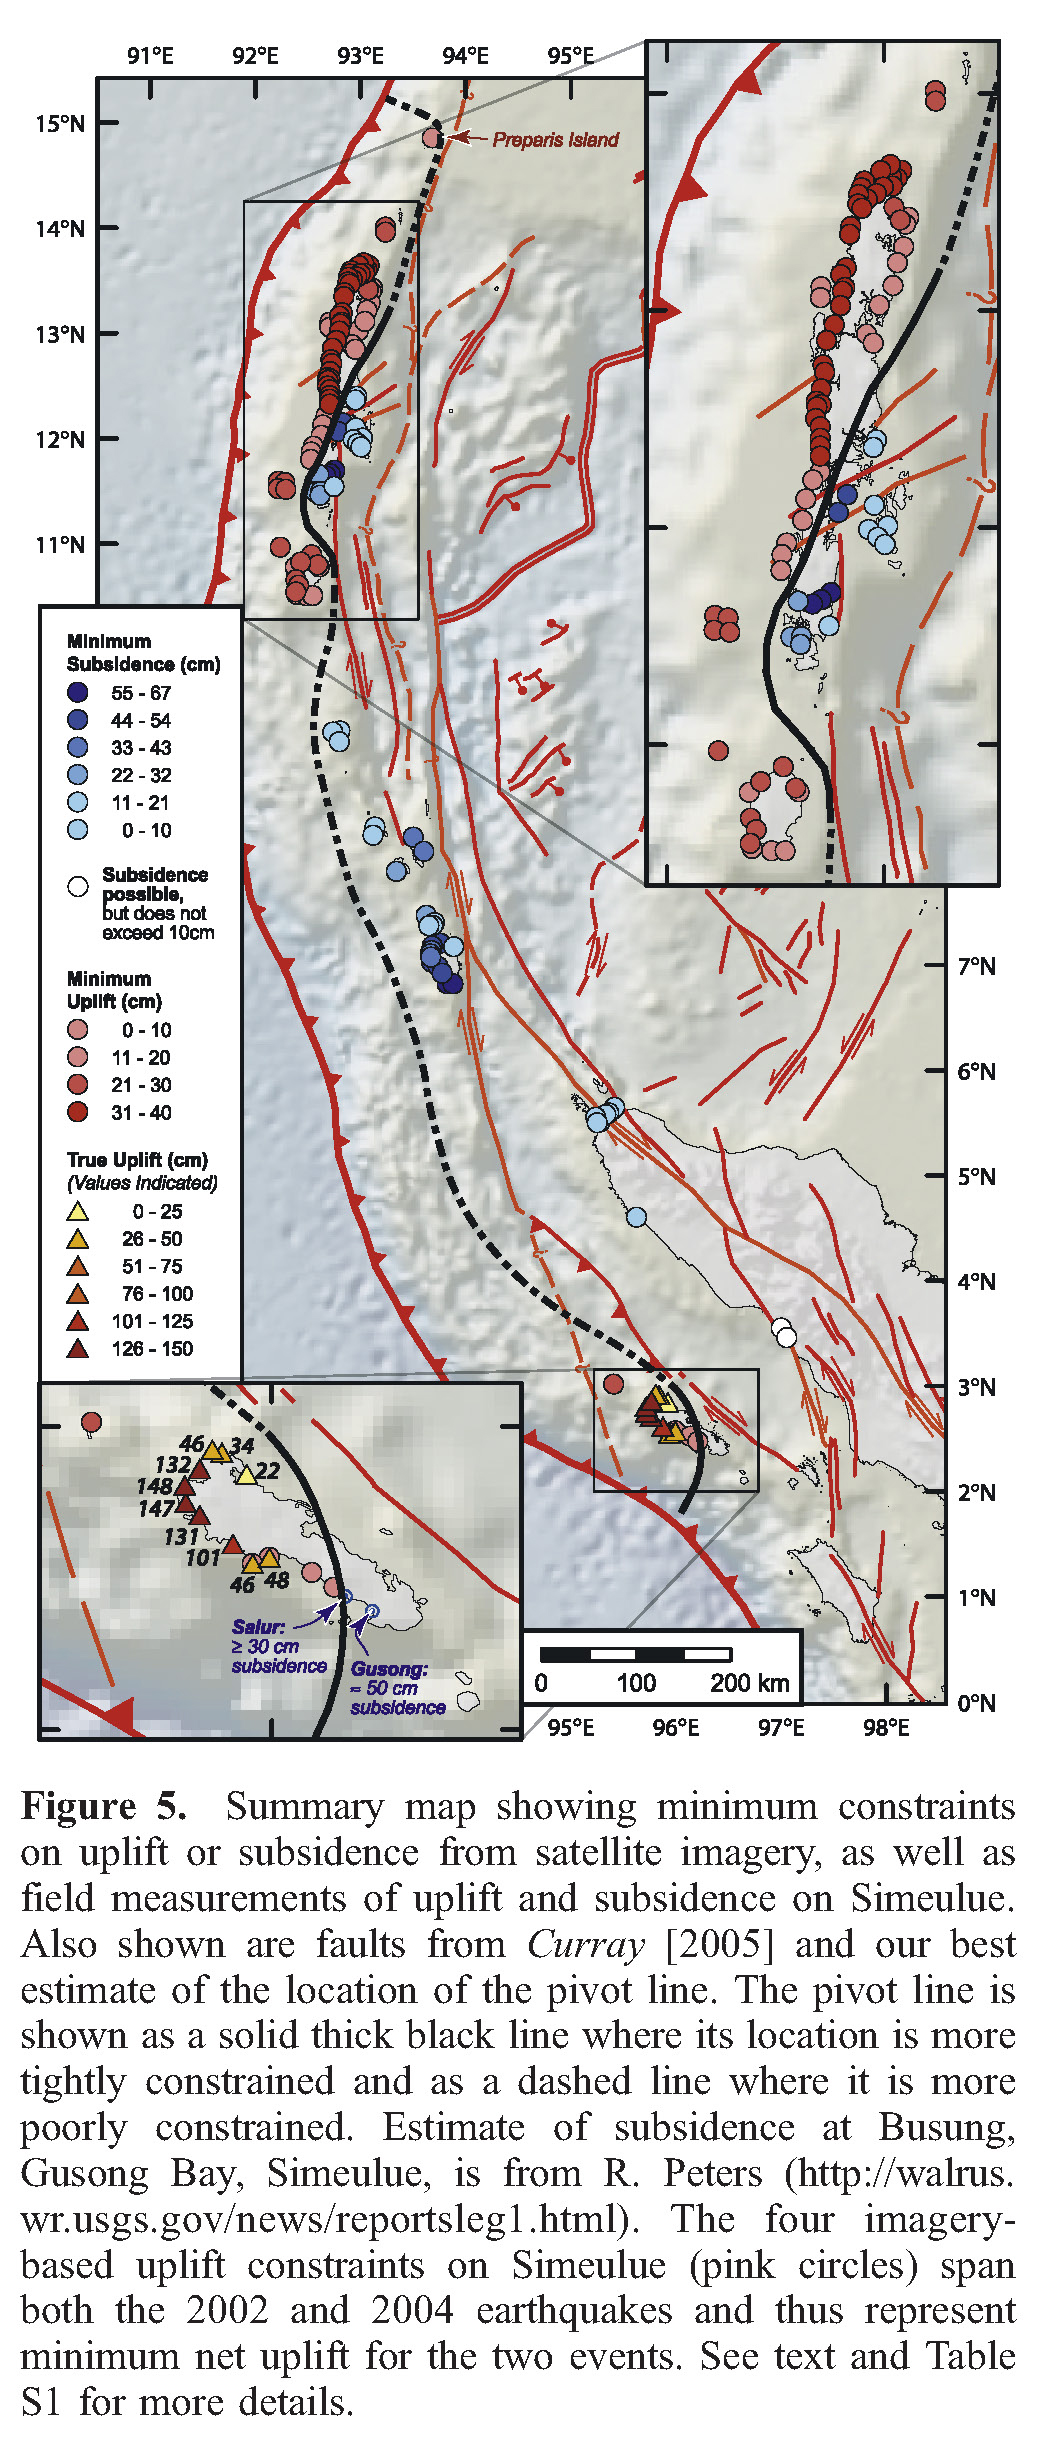
This figure from Meltzner et al. (2010) shows measurements of vertical deformation collected from coral microatolls (which are sensitive to the tides, basically, they cannot survive above a certain level of tidal elevation. Read his and related papers to learn more about this method.). These are observations that are independent of GPS data.
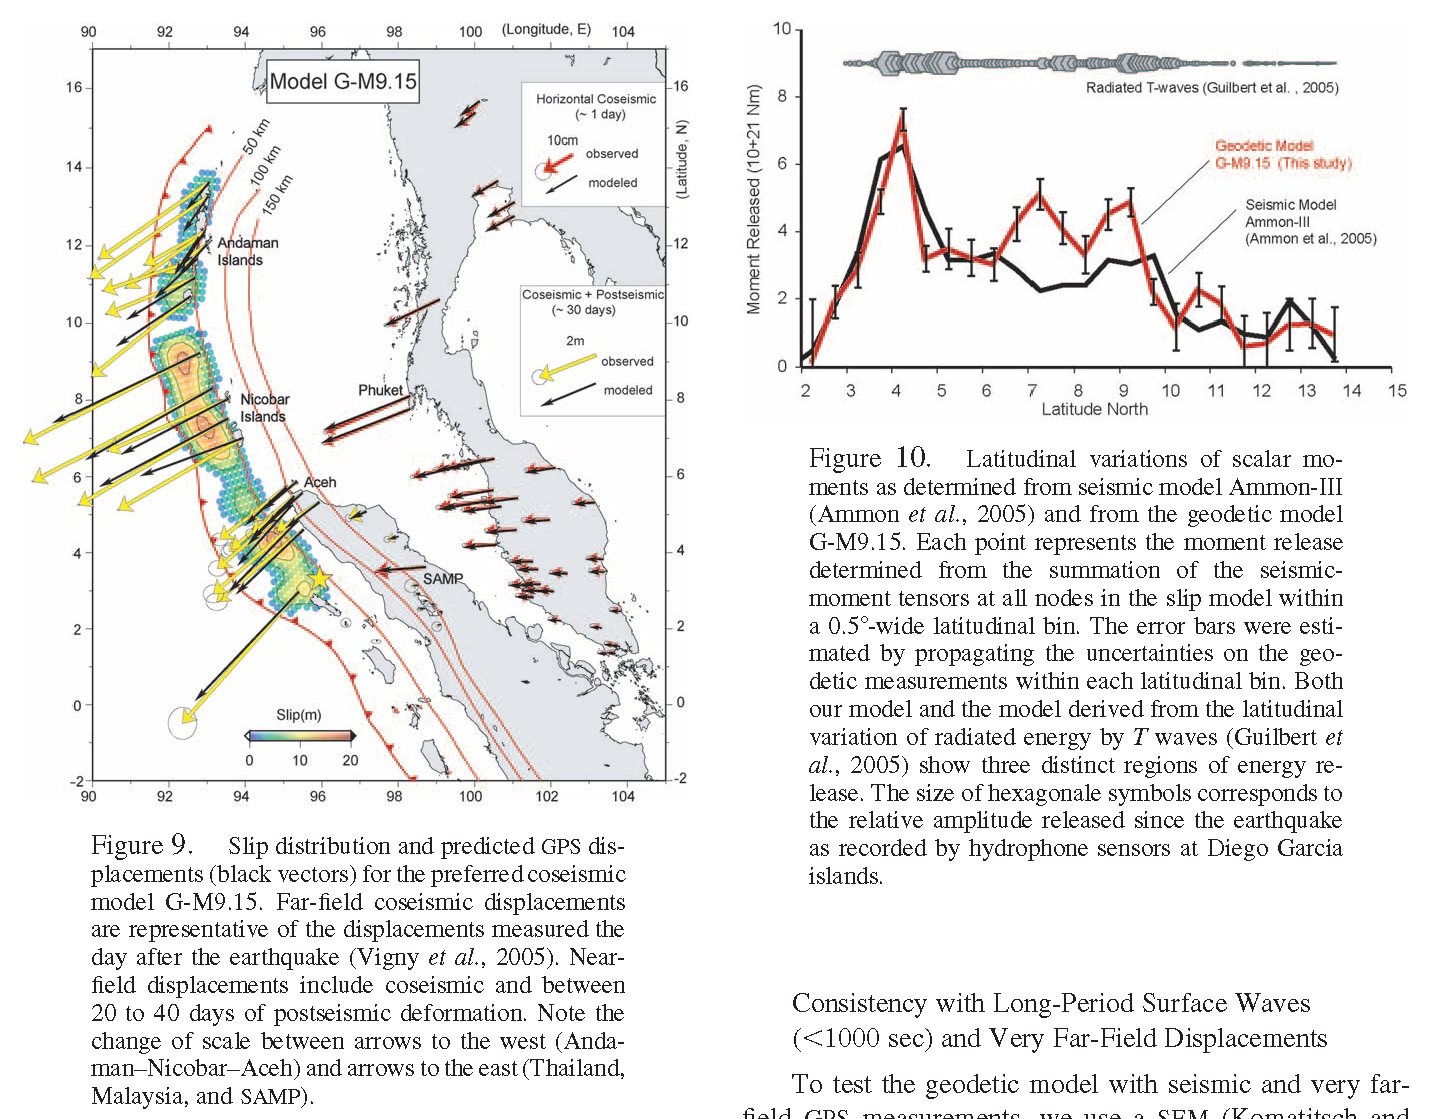
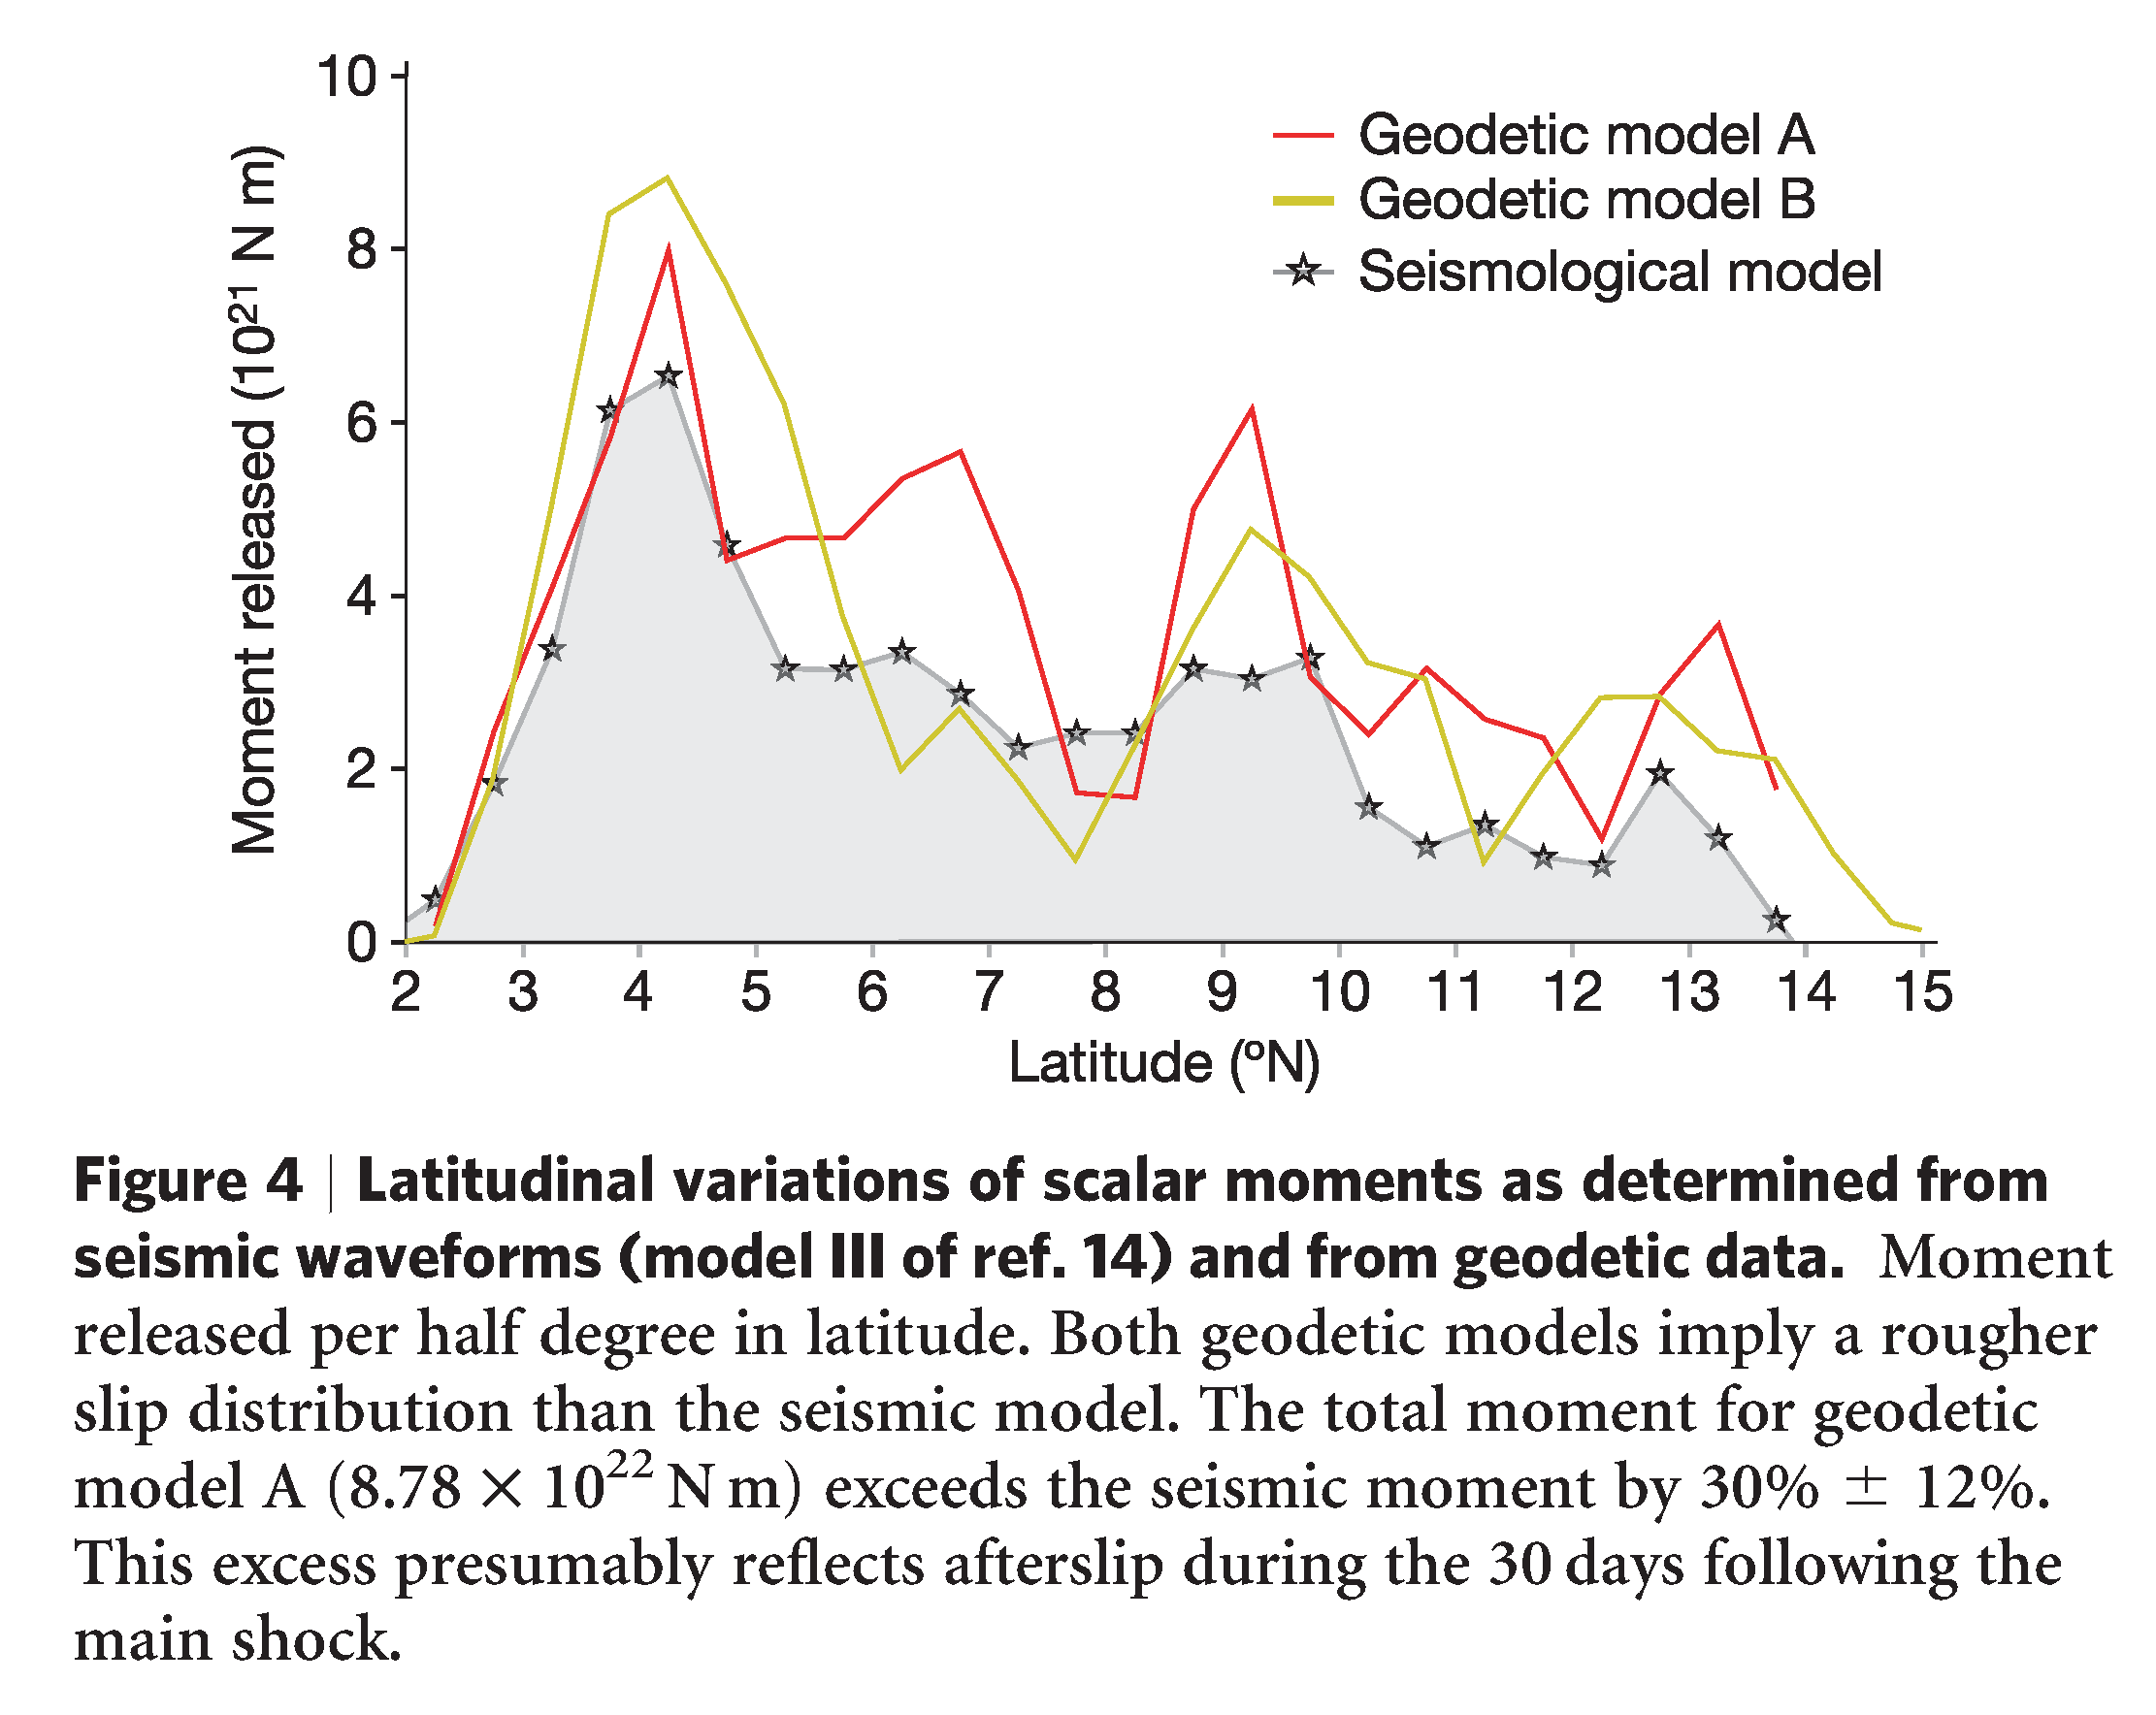
The next series of figures show how people have estimated the amount of energy released during the 2004 earthquake. These plots are often called “source time” functions. They may be plotted as energy versus time or latitude. The larger the amount of slip on the fault, the more energy is released. This first plot is from Chlieh et al. (2007).
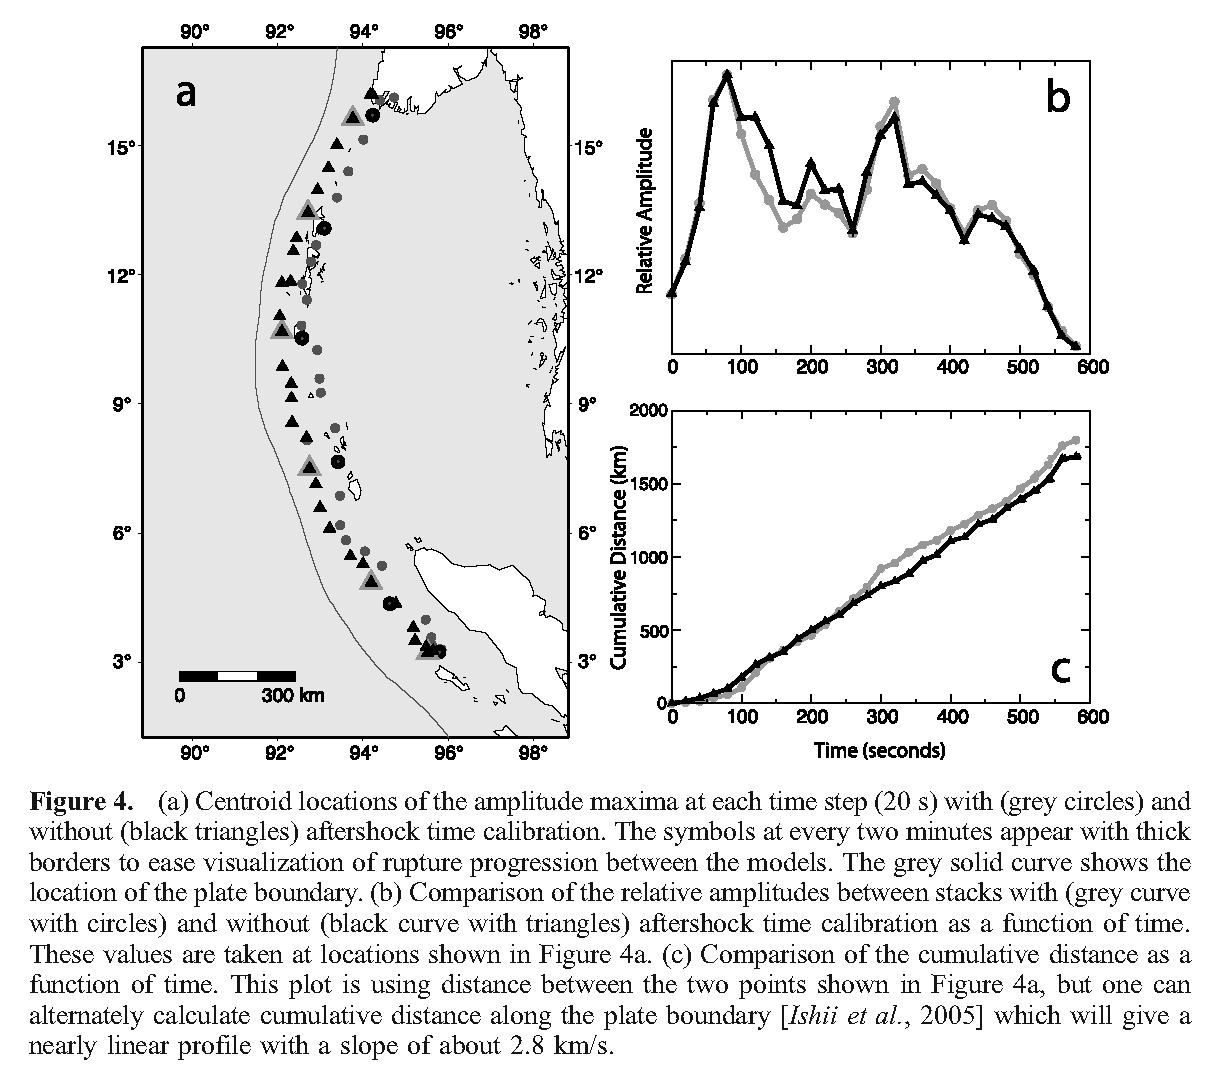
Here is the source time function from Ishi et al. (2005). Note the similarity between this plot and the above one from Chlieh et al. (2007). These results are more comparable that the slip models we saw earlier.
This is from Subarya et al. (2006), an earlier plot, but still similar to Chlieh et al. (2007) and Ishii et al. (2007).
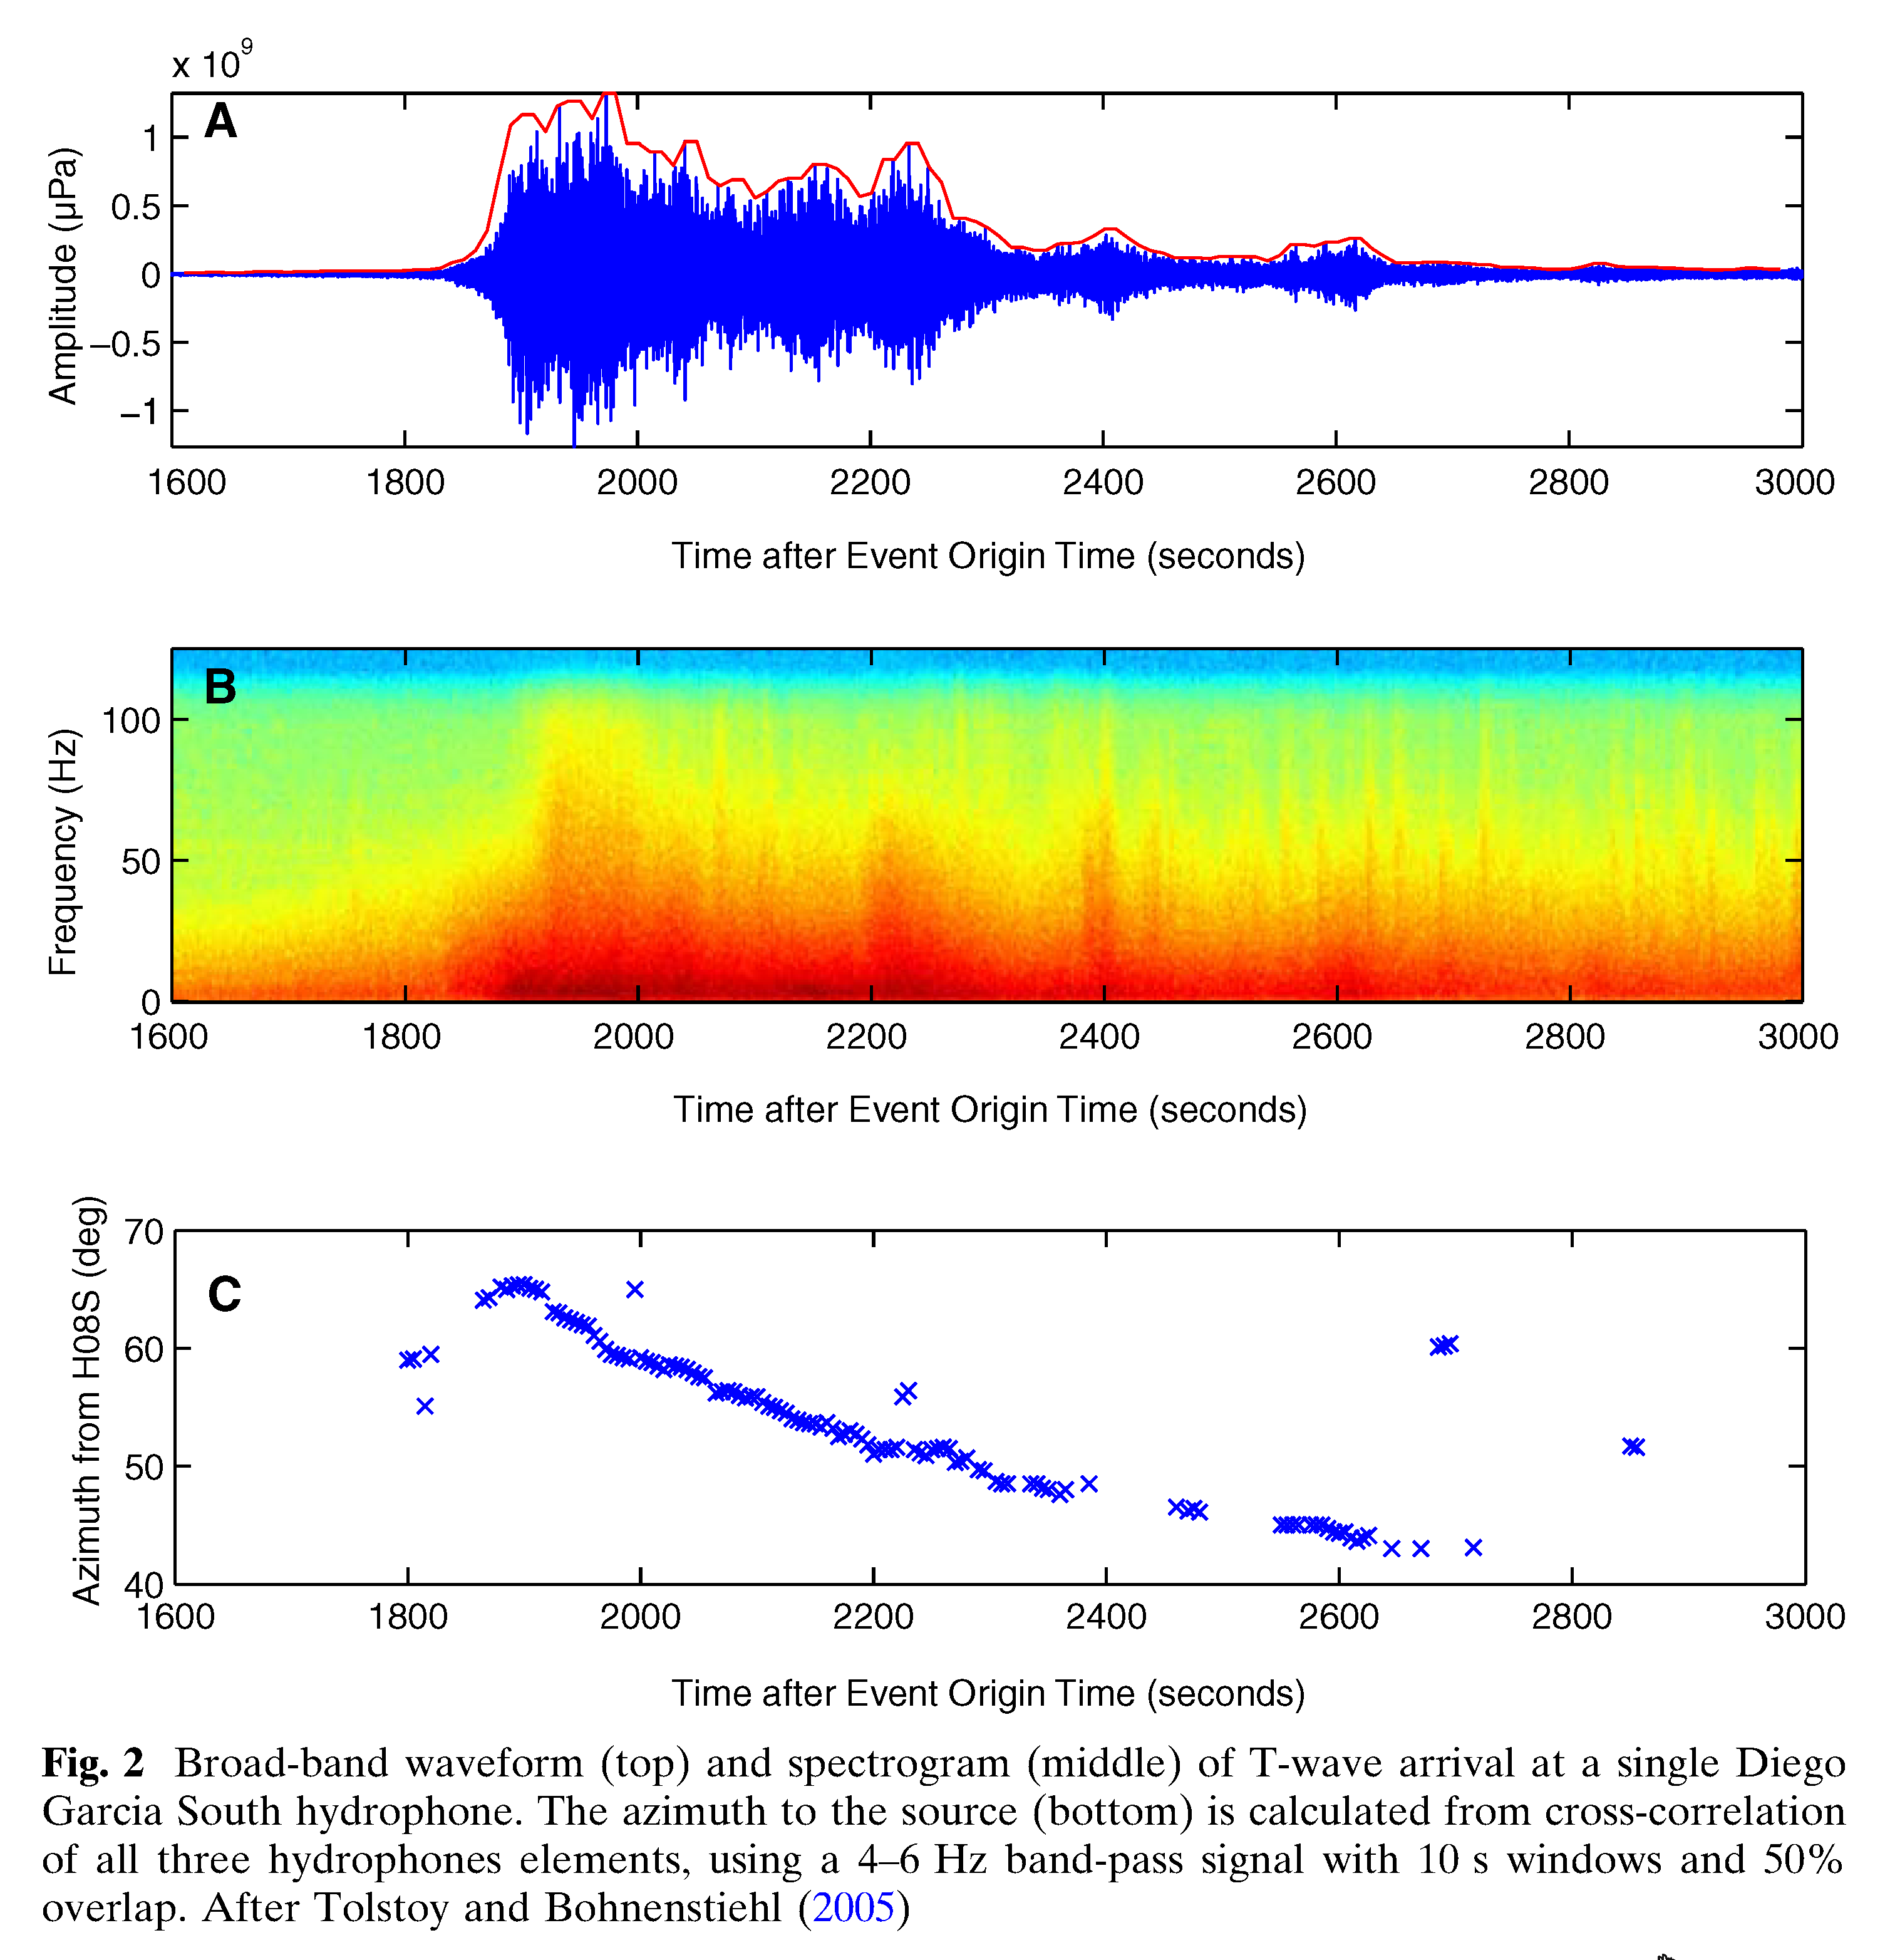
This is another estimate published also in 2006 (Tolstoy and Bohnenstiehl, 2006), again showing similarities with the other plots (though this is the most different). There are a number of other examples as well (e.g. Okal).
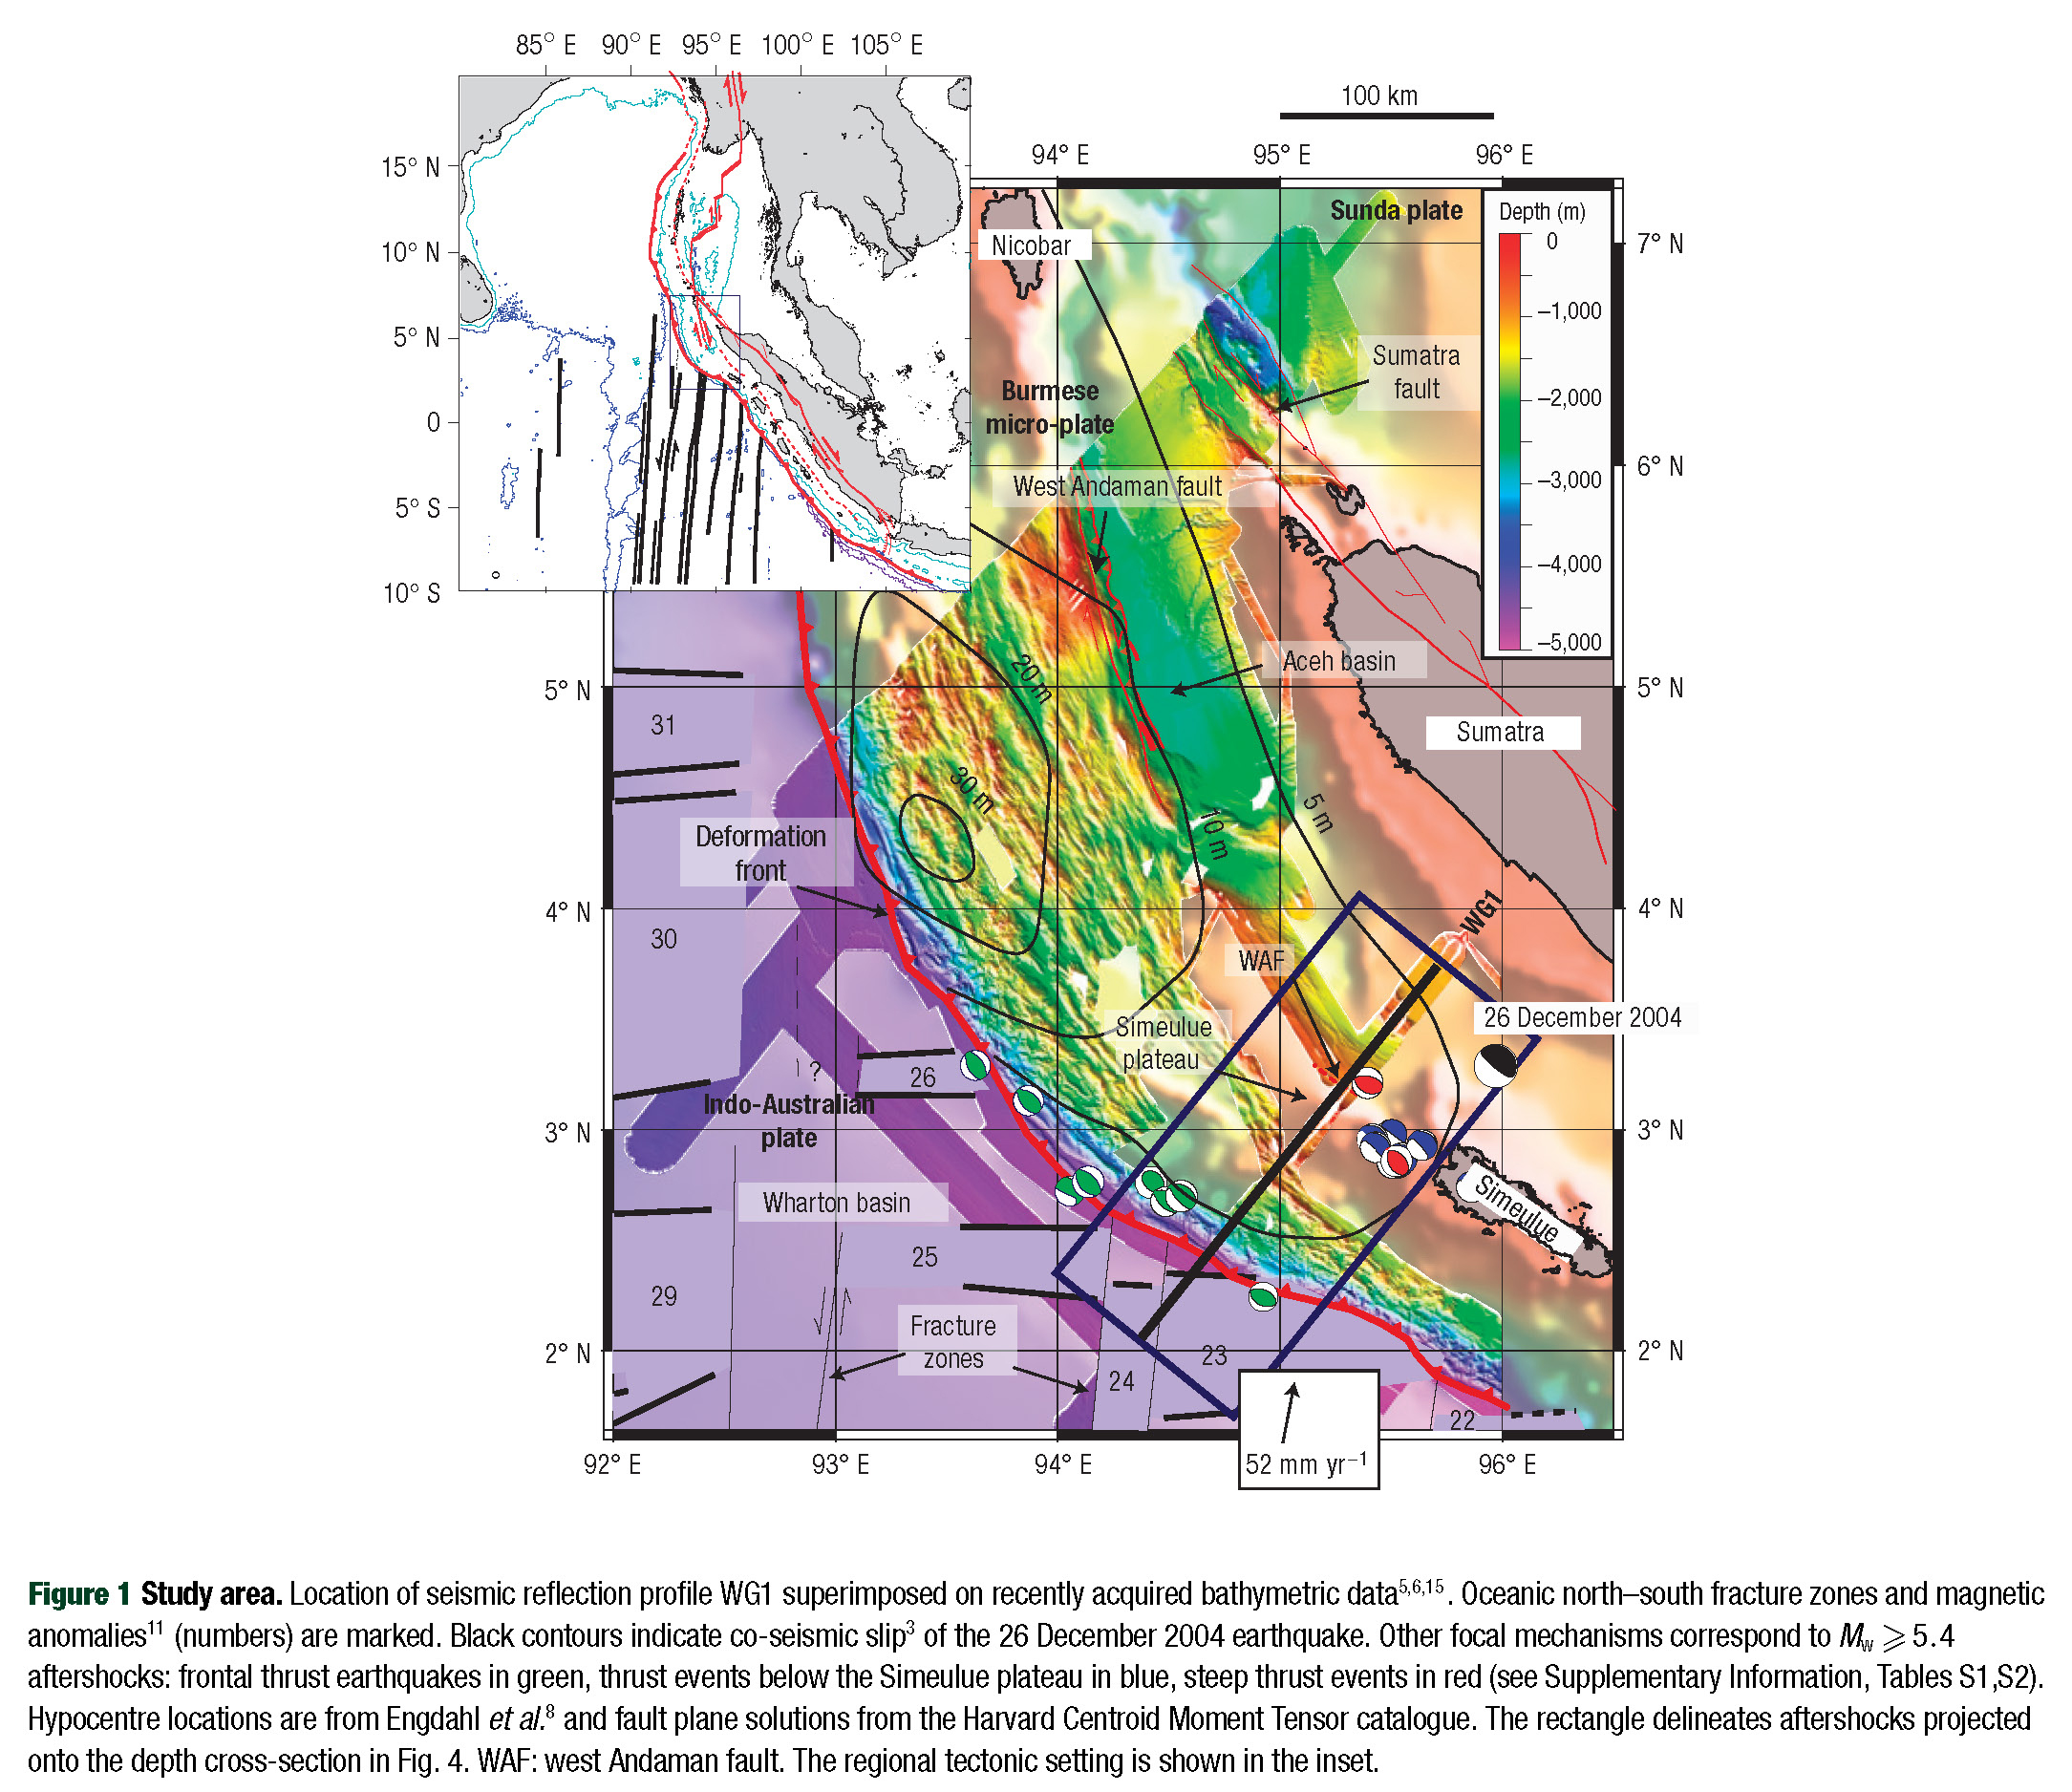
These next two figures from Singh et al. (2008) show a map and cross section at the location of the earthquake. The 2004 SASZ earthquake ruptured very deep in a location previously thought to not harbor strain to be accumulated and released during an earthquake.
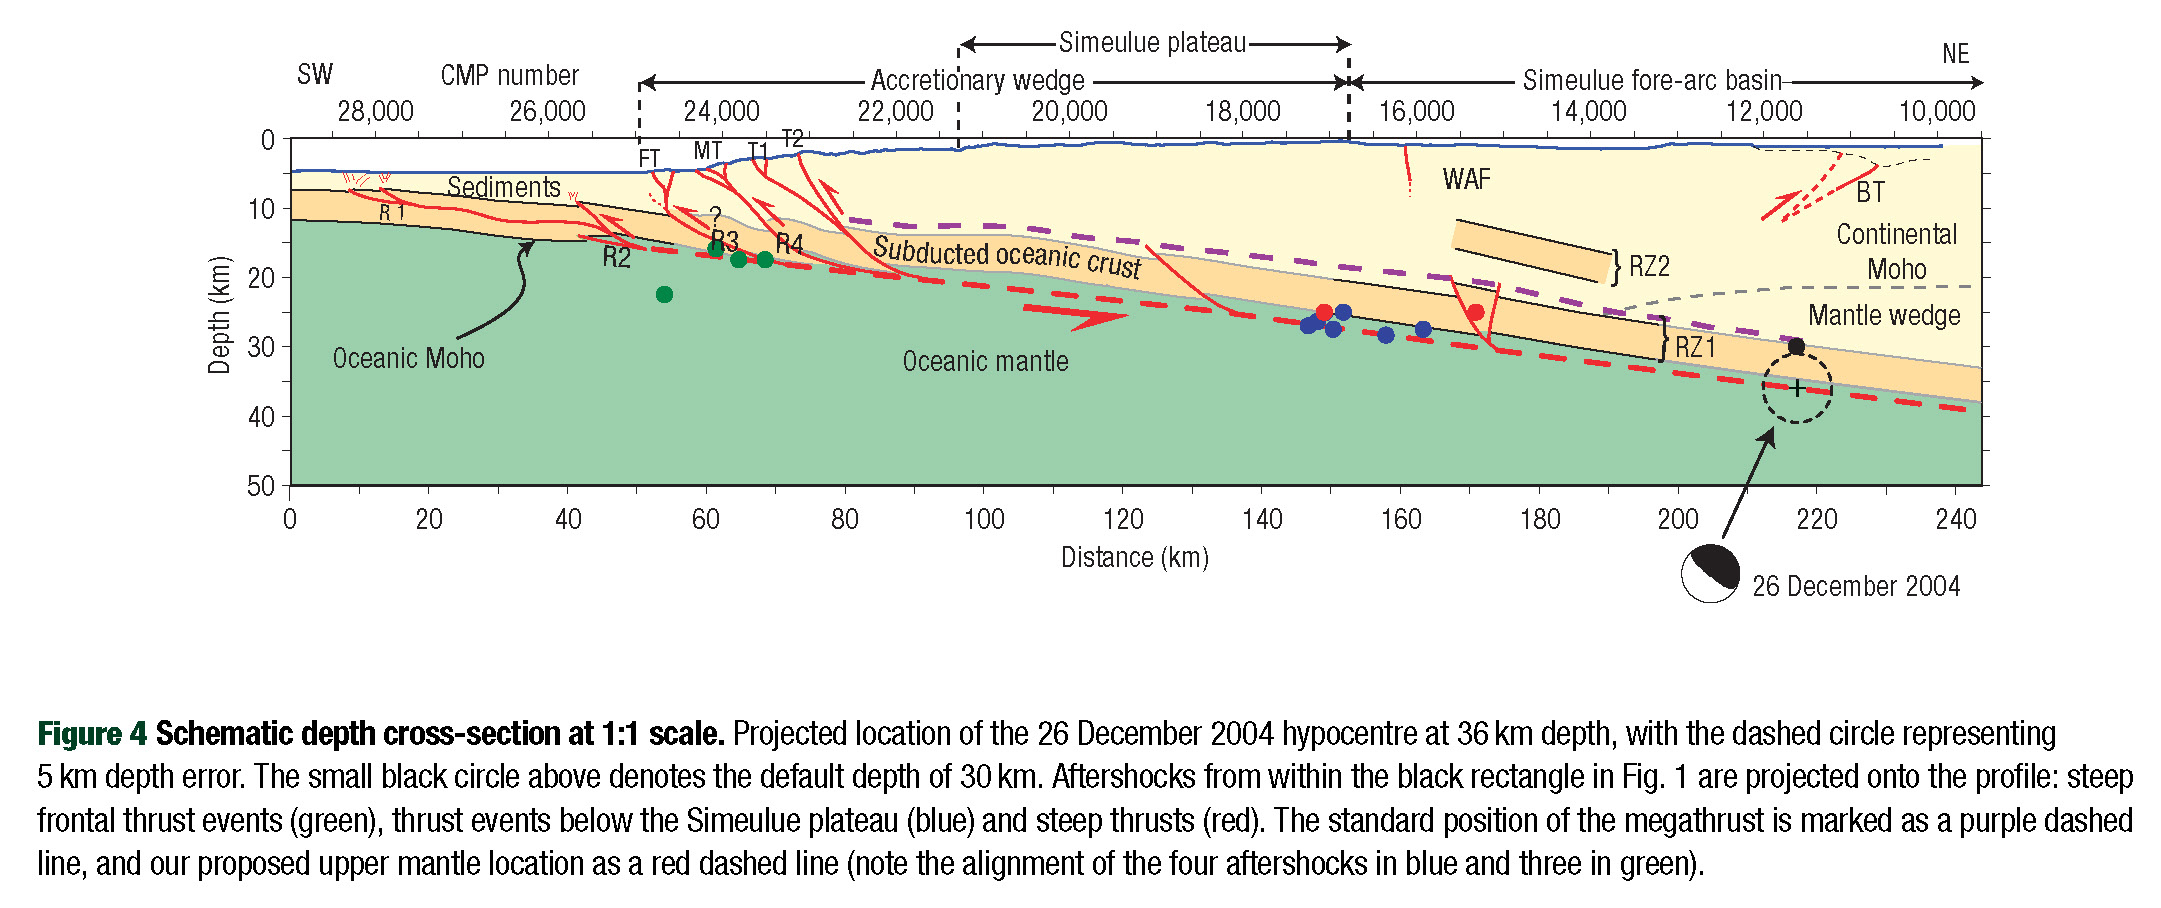
Here is the cross section showing where the earthquake hypocenter is compared to where we think the mantle exists. We have not been here, so nobody actually knows… These interpretations are based on industry deep seismic data.
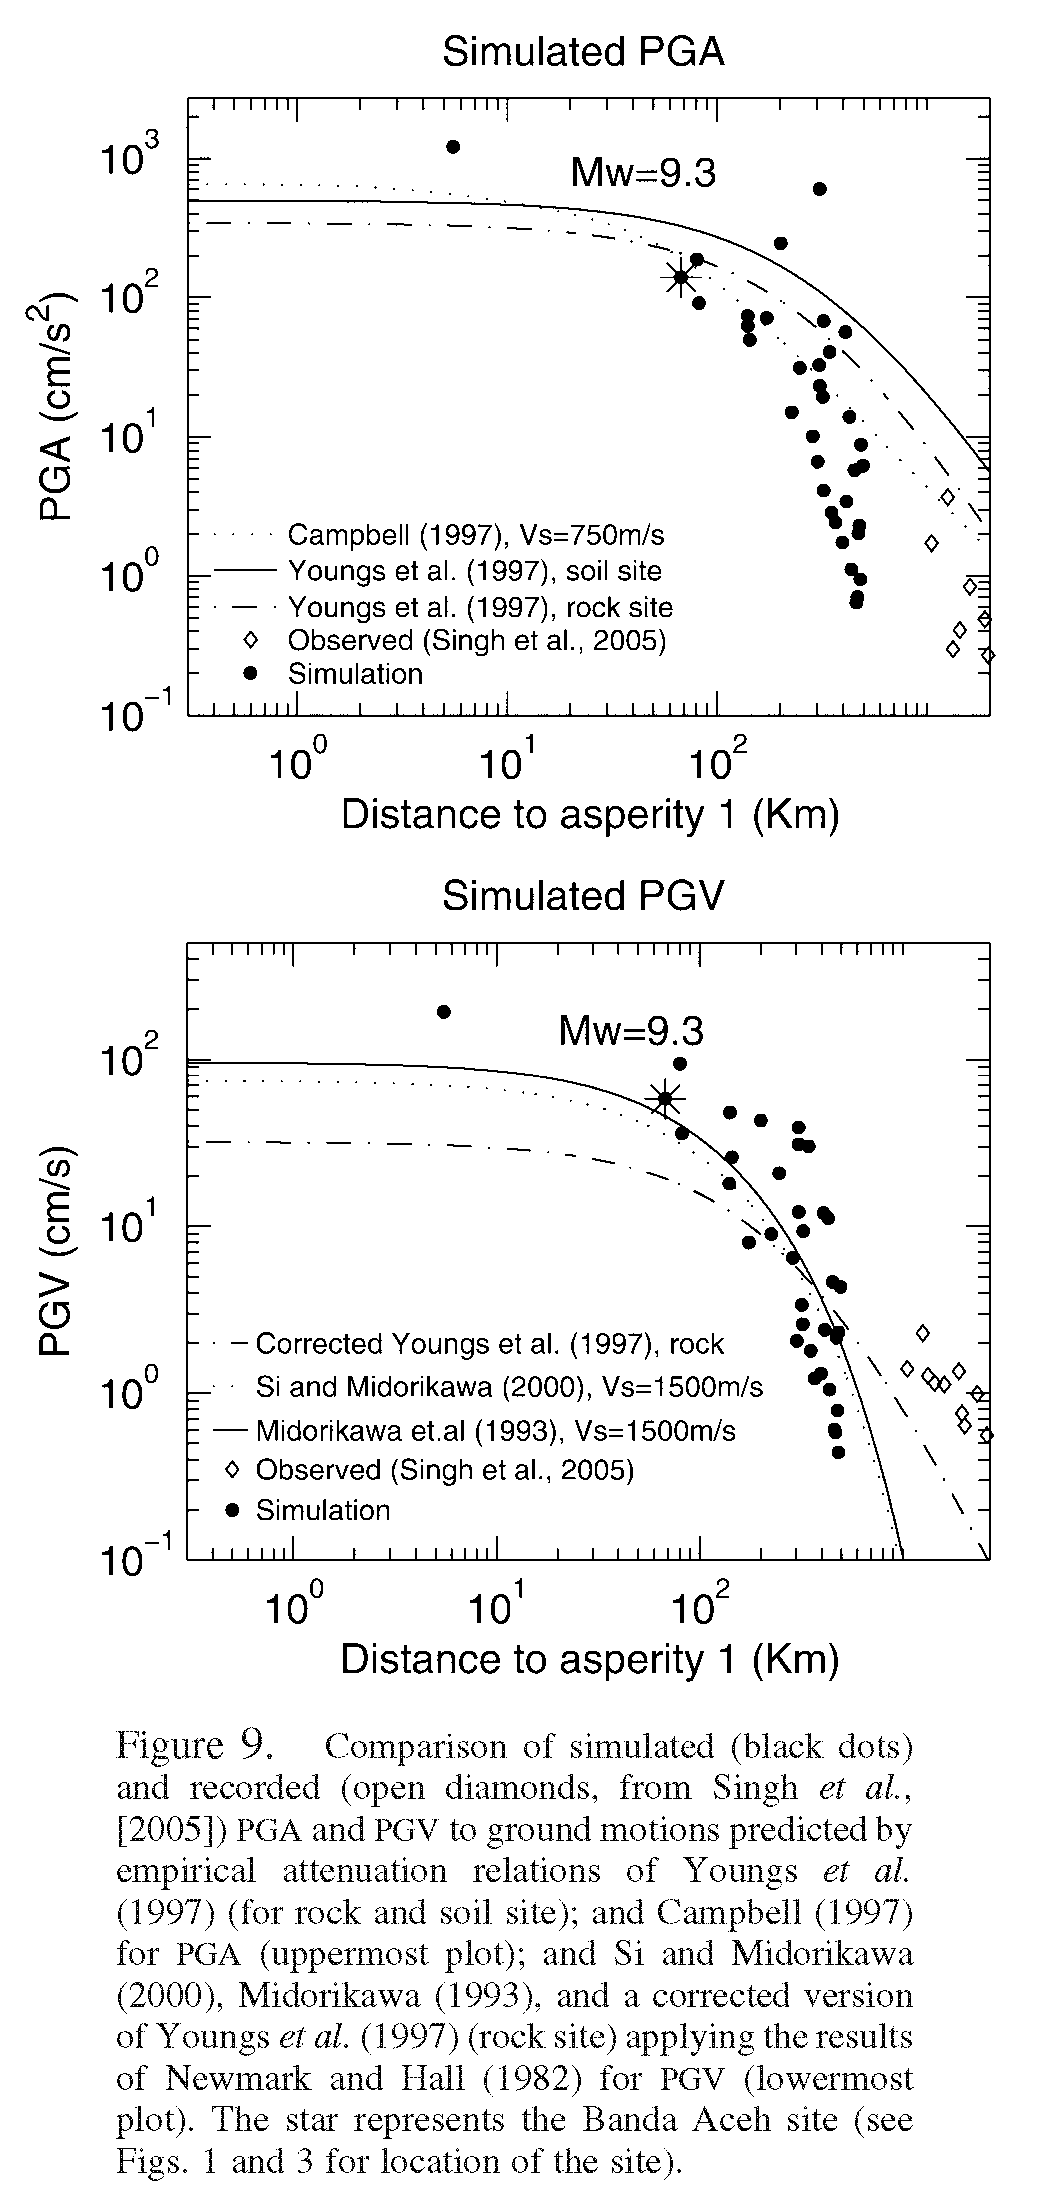
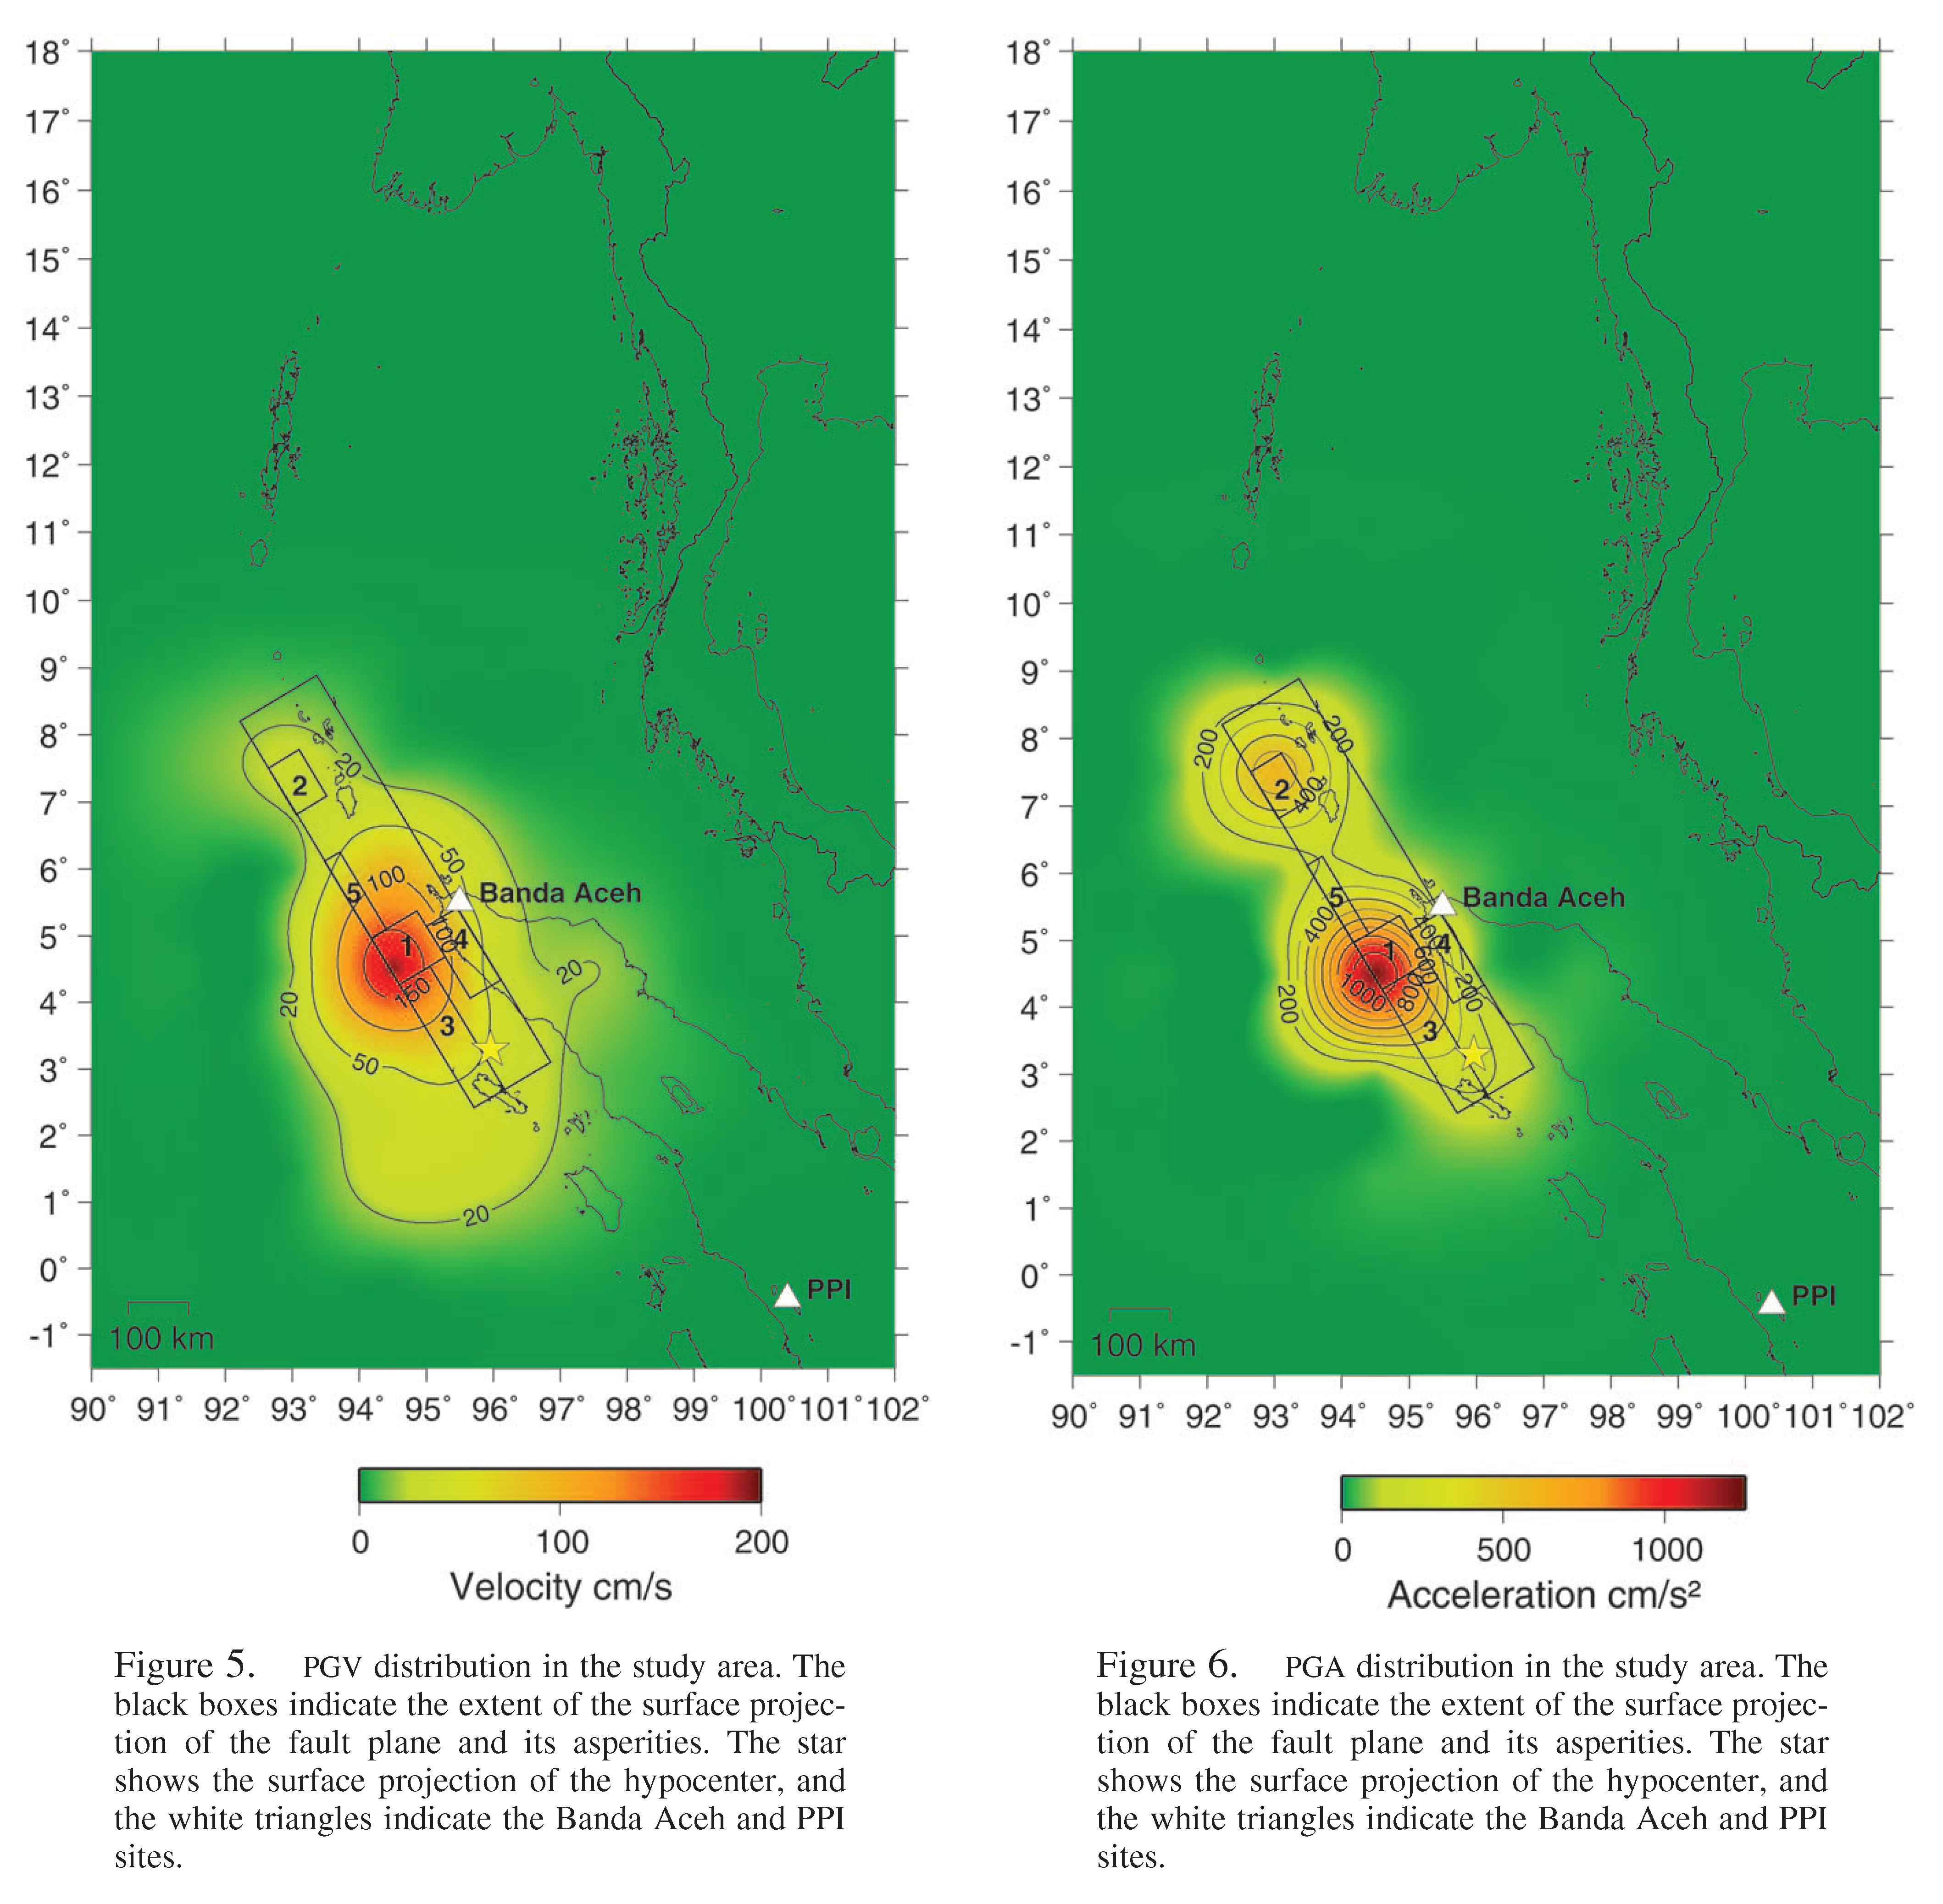
Finally today we look at the ground shaking during the 2004 SASZ earthquake (Sorensen et al., 2007). These first plots show how the ground shaking intensity attenuates (diminishes) with distance from the earthquake. This makes sense, that the further one is away from an earthquake, the less shaking one would feel. These plots show direct observations and the model results that are also plotted in the map below.
Here is the map showing the modeled ground shaking intensity for the 2004 SASZ earthquake. These models were adjusted to fit the observations in the above plot.
References:
- Chlieh, M., Avouac, J.-P., Hjorleifsdottir, V., Song, T.-R.A., Ji, C., Sieh, K., Sladen, A., Hebert, H., Prawirodirdjo, L., Bock, Y., Galetzka, J., 2007. Coseismic Slip and Afterslip of the Great (Mw 9.15) Sumatra-Andaman Earthquake of 2004. Bulletin of the Seismological Society of America 97, S152-S173.
- Ishii, M., Shearer, P.M., Houston, H., Vidale, J.E., 2005. Extent, duration and speed of the 2004 Sumatra-Andaman earthquake imaged by the Hi-Net array. Nature 435, 933.
- Meltzner, A.J., Sieh, K., Chiang, H., Shen, C., Suwargadi, B.W., Natawidjaja, D.H., Philobosian, B., Briggs, R.W., Galetzka, J., 2010. Coral evidence for earthquake recurrence and an A.D. 1390–1455 cluster at the south end of the 2004 Aceh–Andaman rupture. Journal of Geophysical Research 115, 1-46.
- Prawirodirdjo, P., McCaffrey,R., Chadwell, D., Bock, Y, and Subarya, C., 2010. Geodetic observations of an earthquake cycle at the Sumatra subduction zone: Role of interseismic strain segmentation, JOURNAL OF GEOPHYSICAL RESEARCH, v. 115, B03414, doi:10.1029/2008JB006139
- Shearer, P., and Burgmann, R., 2010. Lessons Learned from the 2004 Sumatra-Andaman Megathrust Rupture, Annu. Rev. Earth Planet. Sci. v. 38, pp. 103–31
- Singh, S.C., Carton, H.L., Tapponnier, P, Hananto, N.D., Chauhan, A.P.S., Hartoyo, D., Bayly, M., Moeljopranoto, S., Bunting, T., Christie, P., Lubis, H., and Martin, J., 2008. Seismic evidence for broken oceanic crust in the 2004 Sumatra earthquake epicentral region, Nature Geoscience, v. 1, pp. 5.
- Sorensen, M.B., Atakan, K., Pulido, N., 2007. Simulated Strong Ground Motions for the Great M 9.3 Sumatra–Andaman Earthquake of 26 December 2004. BSSA 97, S139-S151.
- Tolstoy, M., Bohnenstiehl, D.R., 2006. Hydroacoustic contributions to understanding the December 26th 2004 great Sumatra–Andaman Earthquake. Survey of Geophysics 27, 633-646.
Neato! Sharing.