This earthquake swarm is pretty interesting. We clearly have lots to learn about the tectonics of this region. One of the biggest mysteries yet to be solved is what fault the mainshock occurred on. The M 7.1, reported about early this morning, is still placed at ~50 km depth. The problem is that the subduction zone fault at this location is mapped at about 30 km. For some reason not evident to me, the USGS states that this earthquake is on the subduction zone fault in this region. The USGS fails to explain why these earthquakes are completely inconsistent with their fault model. All but a couple of the aftershocks also plot well beneath the subduction zone fault. Some of the aftershocks appear to align along a northeast striking line, possibly a strike-slip fault in the downgoing slab. However, the largest aftershock (a M 6.5) also has a reverse mechanisms (so it is not strike slip). These aftershocks probably just appear to line up for a reason unrelated to a strike slip fault.
Because this earthquake swarm is well below the subduction zone fault, my interpretation of this swarm is that it is occurring within the downgoing slab. Another alternative is that the slab modeled by Hayes is incorrect, by about 20 km. Unfortunately, the aftershocks do not support this second alternative, since they are closer to the trench and remain at depths much greater than the slab modeled by Hayes. There is one M 4.9 that has an epicentral location plotted right at the trench at a hypocentral depth of 47 km. This is not on the subduction zone fault since the subduction zone fault must be between 0 and a few kms at this location.
Here is a map showing the mainshock and larger aftershocks (< M 2.5). The subduction zone fault is represented by the red-orange-yellow contour lines. This fault surface is modeled by using hypocentral depths for earthquakes. There could be a second large fault that is deeper than the one modeled by Hayes.

This is the figure for the slab mapped by Hayes.

This map shows the mainshock and aftershocks > M 2.5 magnitude.

Here is a moment tensor for the M 6.5 aftershock, showing a reverse or thrust earthquake solution.

This map shows the shaking intensity (Modified Mercalli Intensity) with color representing intensity. This shaking intensity is for the M 6.5 aftershock, which was most certainly felt by someone or something on the island.

Here is a solution! The earthquake was not on the subduction zone fault but a splay fault. Below are a series of maps that show a cross section showing the hypocentral depths along a profile just to the northwest of today’s EQ swarm.
Here is a map from the USGS Open File Report on the tectonics of this region. The cross section is for the rectangular region marked D-D’. Note that this region is to the northwest of Bougainville Island. Today’s M 7.1 is just west of the label “1975.”

Here is the D-D’ profile. Remind yourself that the subduction zone fault may change along strike.

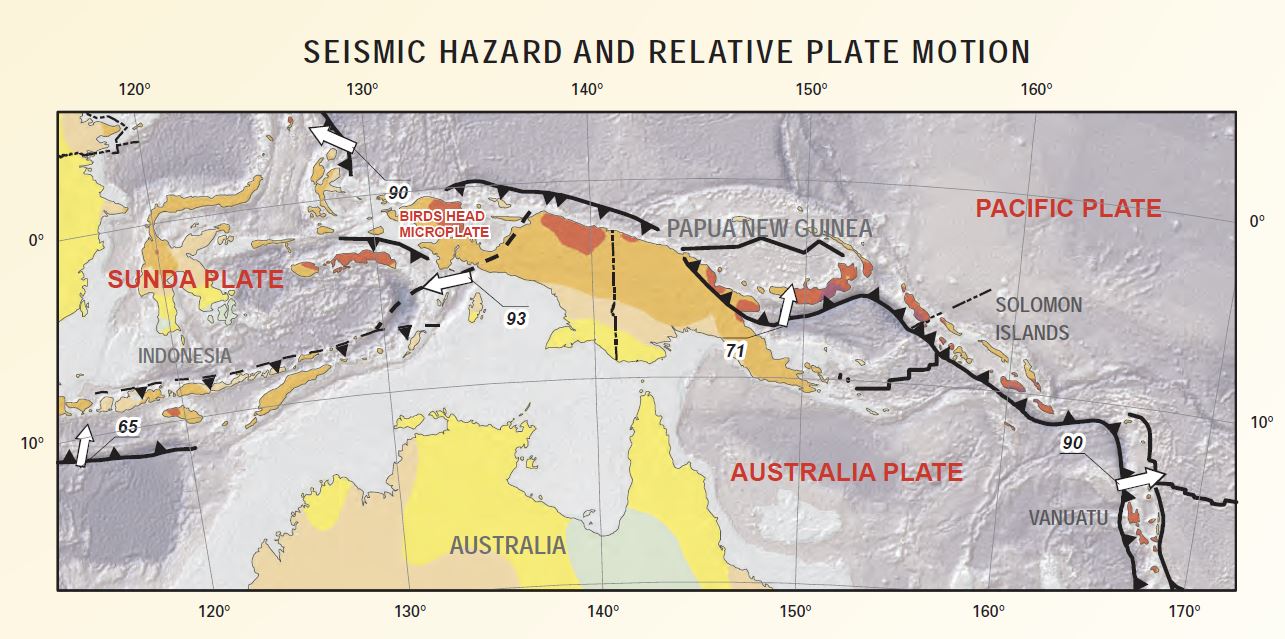
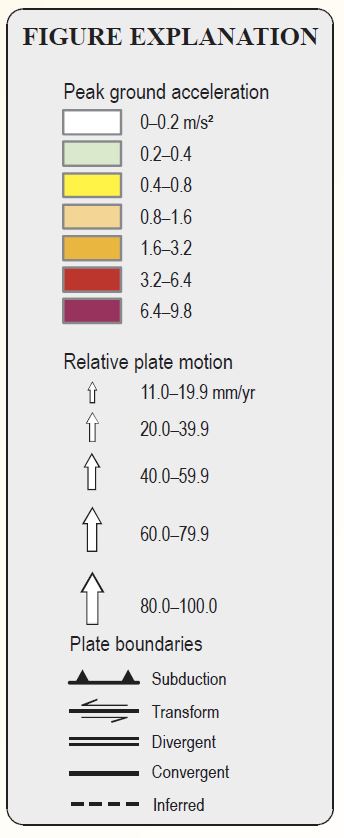
Here is the seismic hazard for this region, also from the USGS open file report.