As I mentioned in my earlier post, there were some foreshocks and have been aftershocks, related to this M 8.2 earthquake on the subduction zone fault offshore of northern Chile. This story may not yet be over… The aftershocks are located on a section of the fault to the south of the mainshock and all the foreshocks. We would not be surprised if other regions of the fault were to be triggered. However, this likelihood decays with every day. The increased stress to the adjacent fault segments is short lived and not very large, compared to the stress budget of faults. In other words, faults manage themselves in the range of millions of Pascals, but the increased stress from adjacent earthquakes is measured in thousands of Pascals. Increased stress may trigger earthquakes, but those faults need to be “ready to go” in order to be triggered.
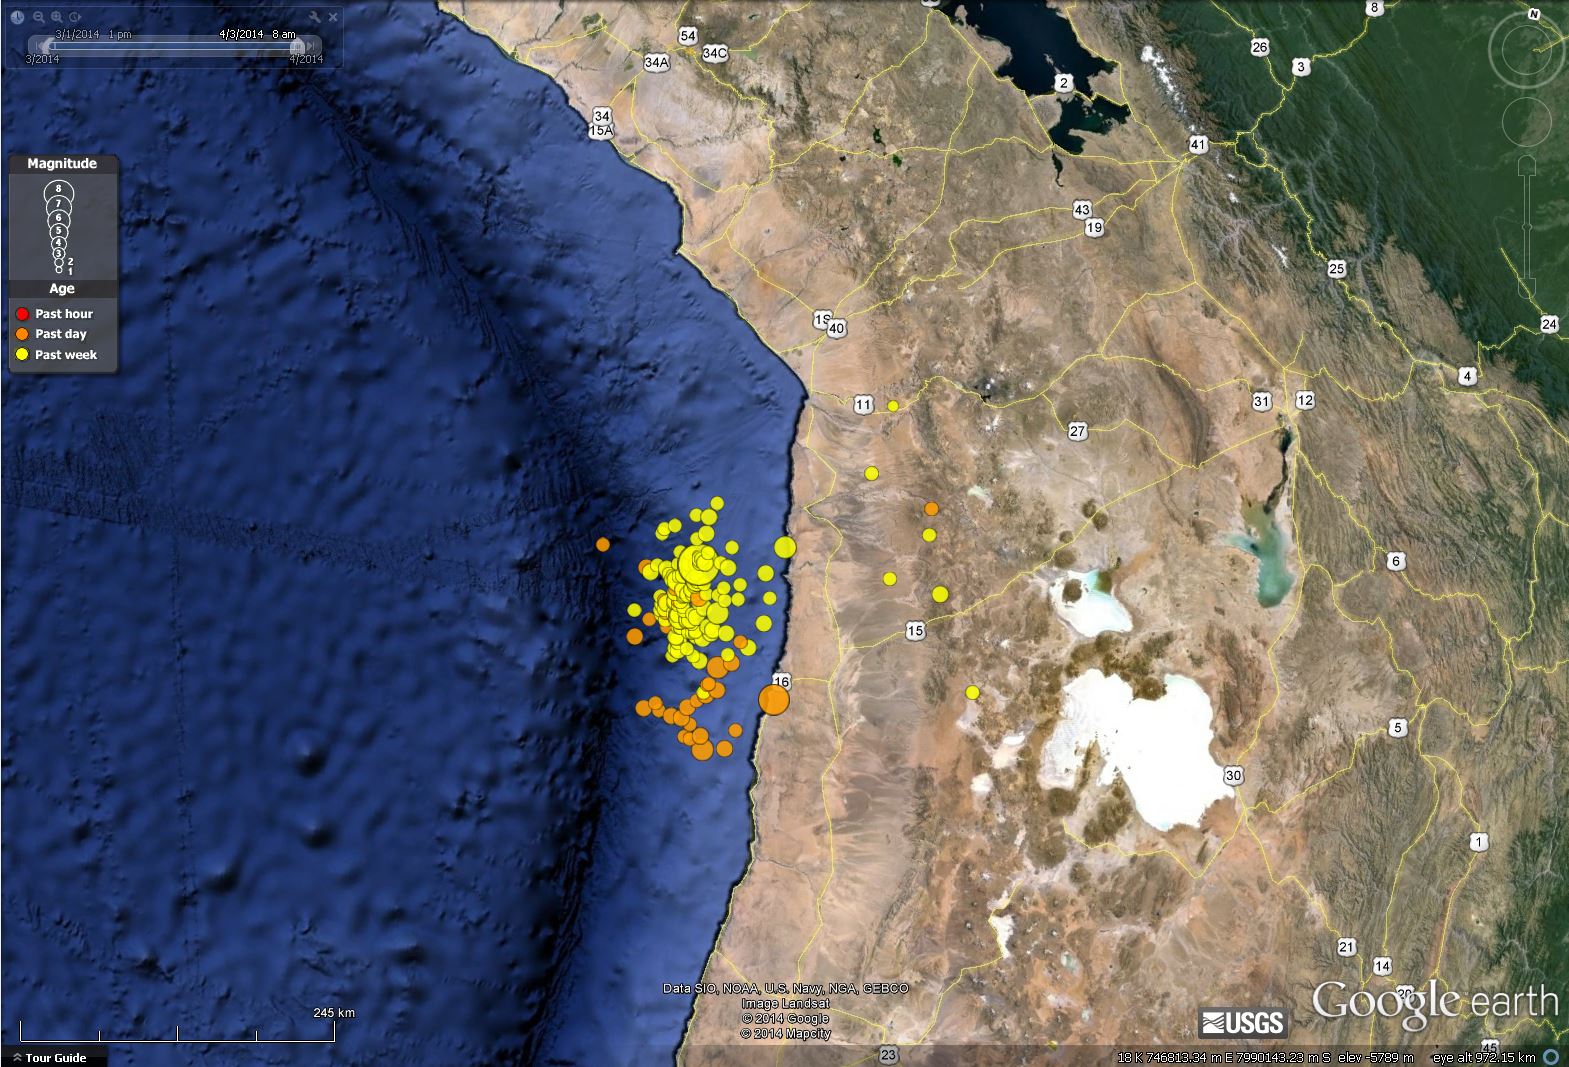
Here I used the USGS hypocenters to create some animations of these earthquakes through time. The first one shows the earthquake epicenters in colors representing the age (orange = past day, yellow = past week, so the most recent aftershocks are all in orange. The largest aftershock, an earthquake of magnitude M 7.6, is plotted nearest the highway 16 label. Click on the map and the video will either open in a new tab, or be ready to download it. These are avi video files ~15 mb in size.
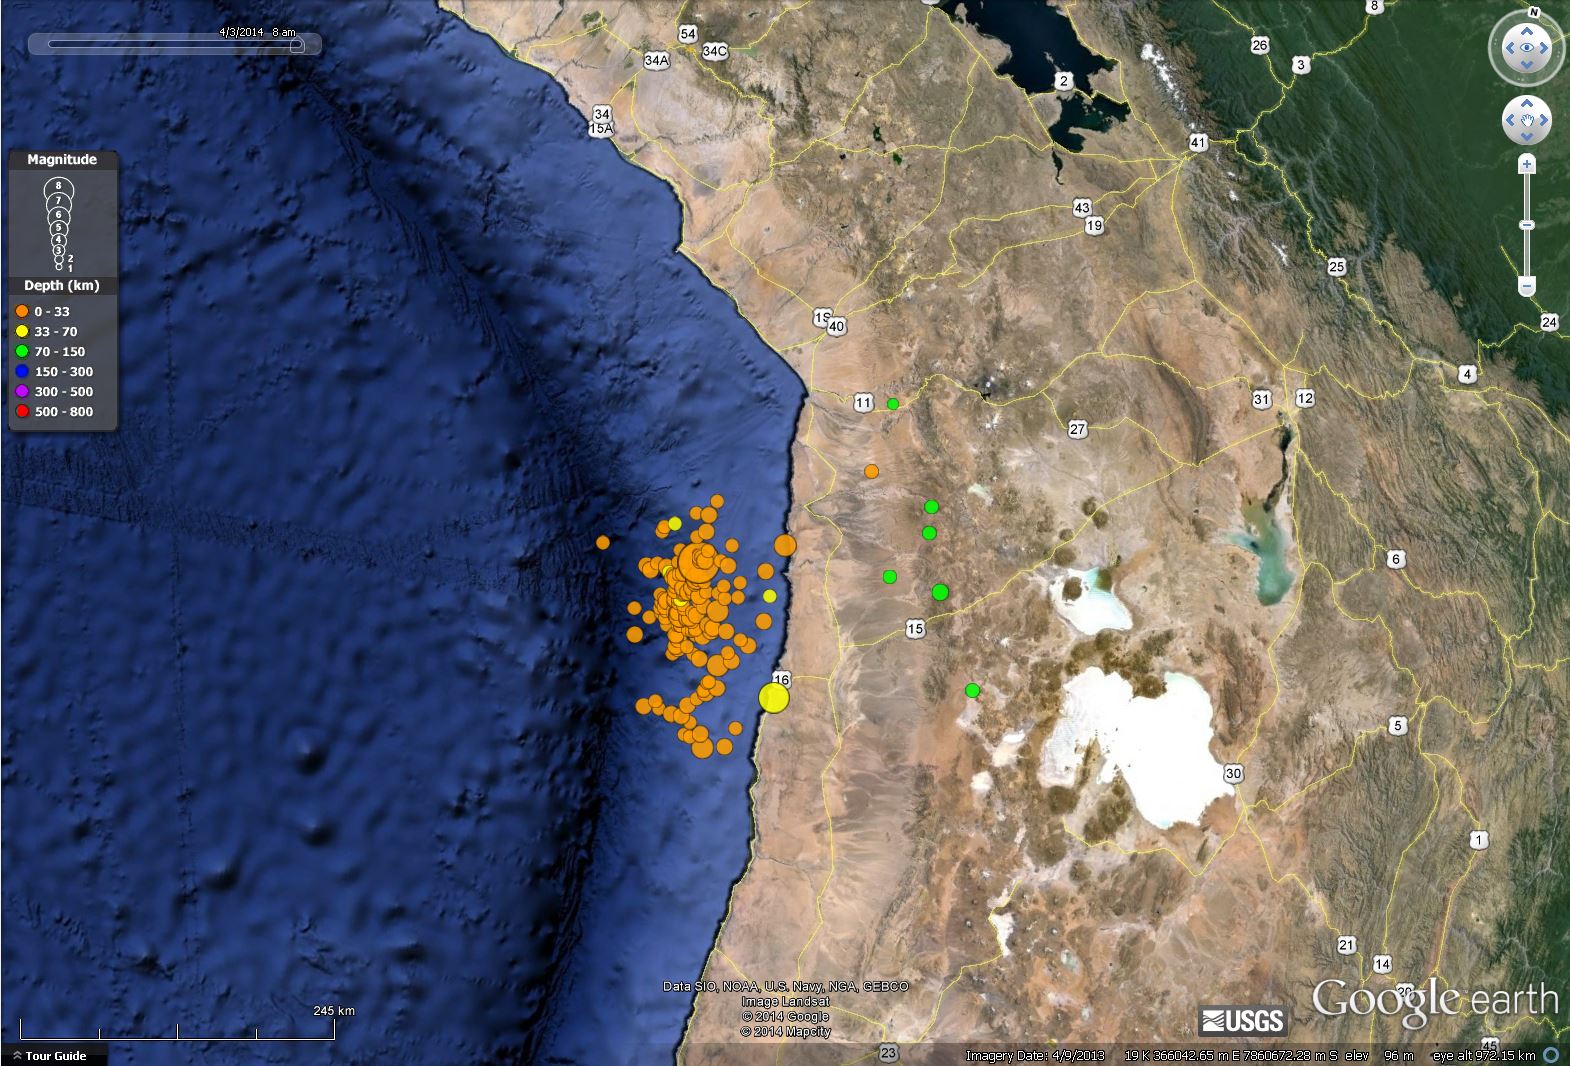
Here is the animation with color designating depth. As I mentioned in my page on the M 8.2 mainshock, these earthquakes are mostly aligned with the depths of the subduction zone fault as modeled by Dr. Gavin Hayes with the USGS (based on hypocentral depths of seismicity).
3 thoughts on “northern Chile M 8.2 earthquake series animations”