Early this morning we had a small rumbler offshore of northern California, generally in the same location as the 2010.01.10 earthquake. I remember the 2010 earthquake very well as the ground shaking lasted over 20 seconds in Manila. Here is the USGS website for the M 4.3 earthquake. I missed today’s earthquake, but probably would have been awaken by it.
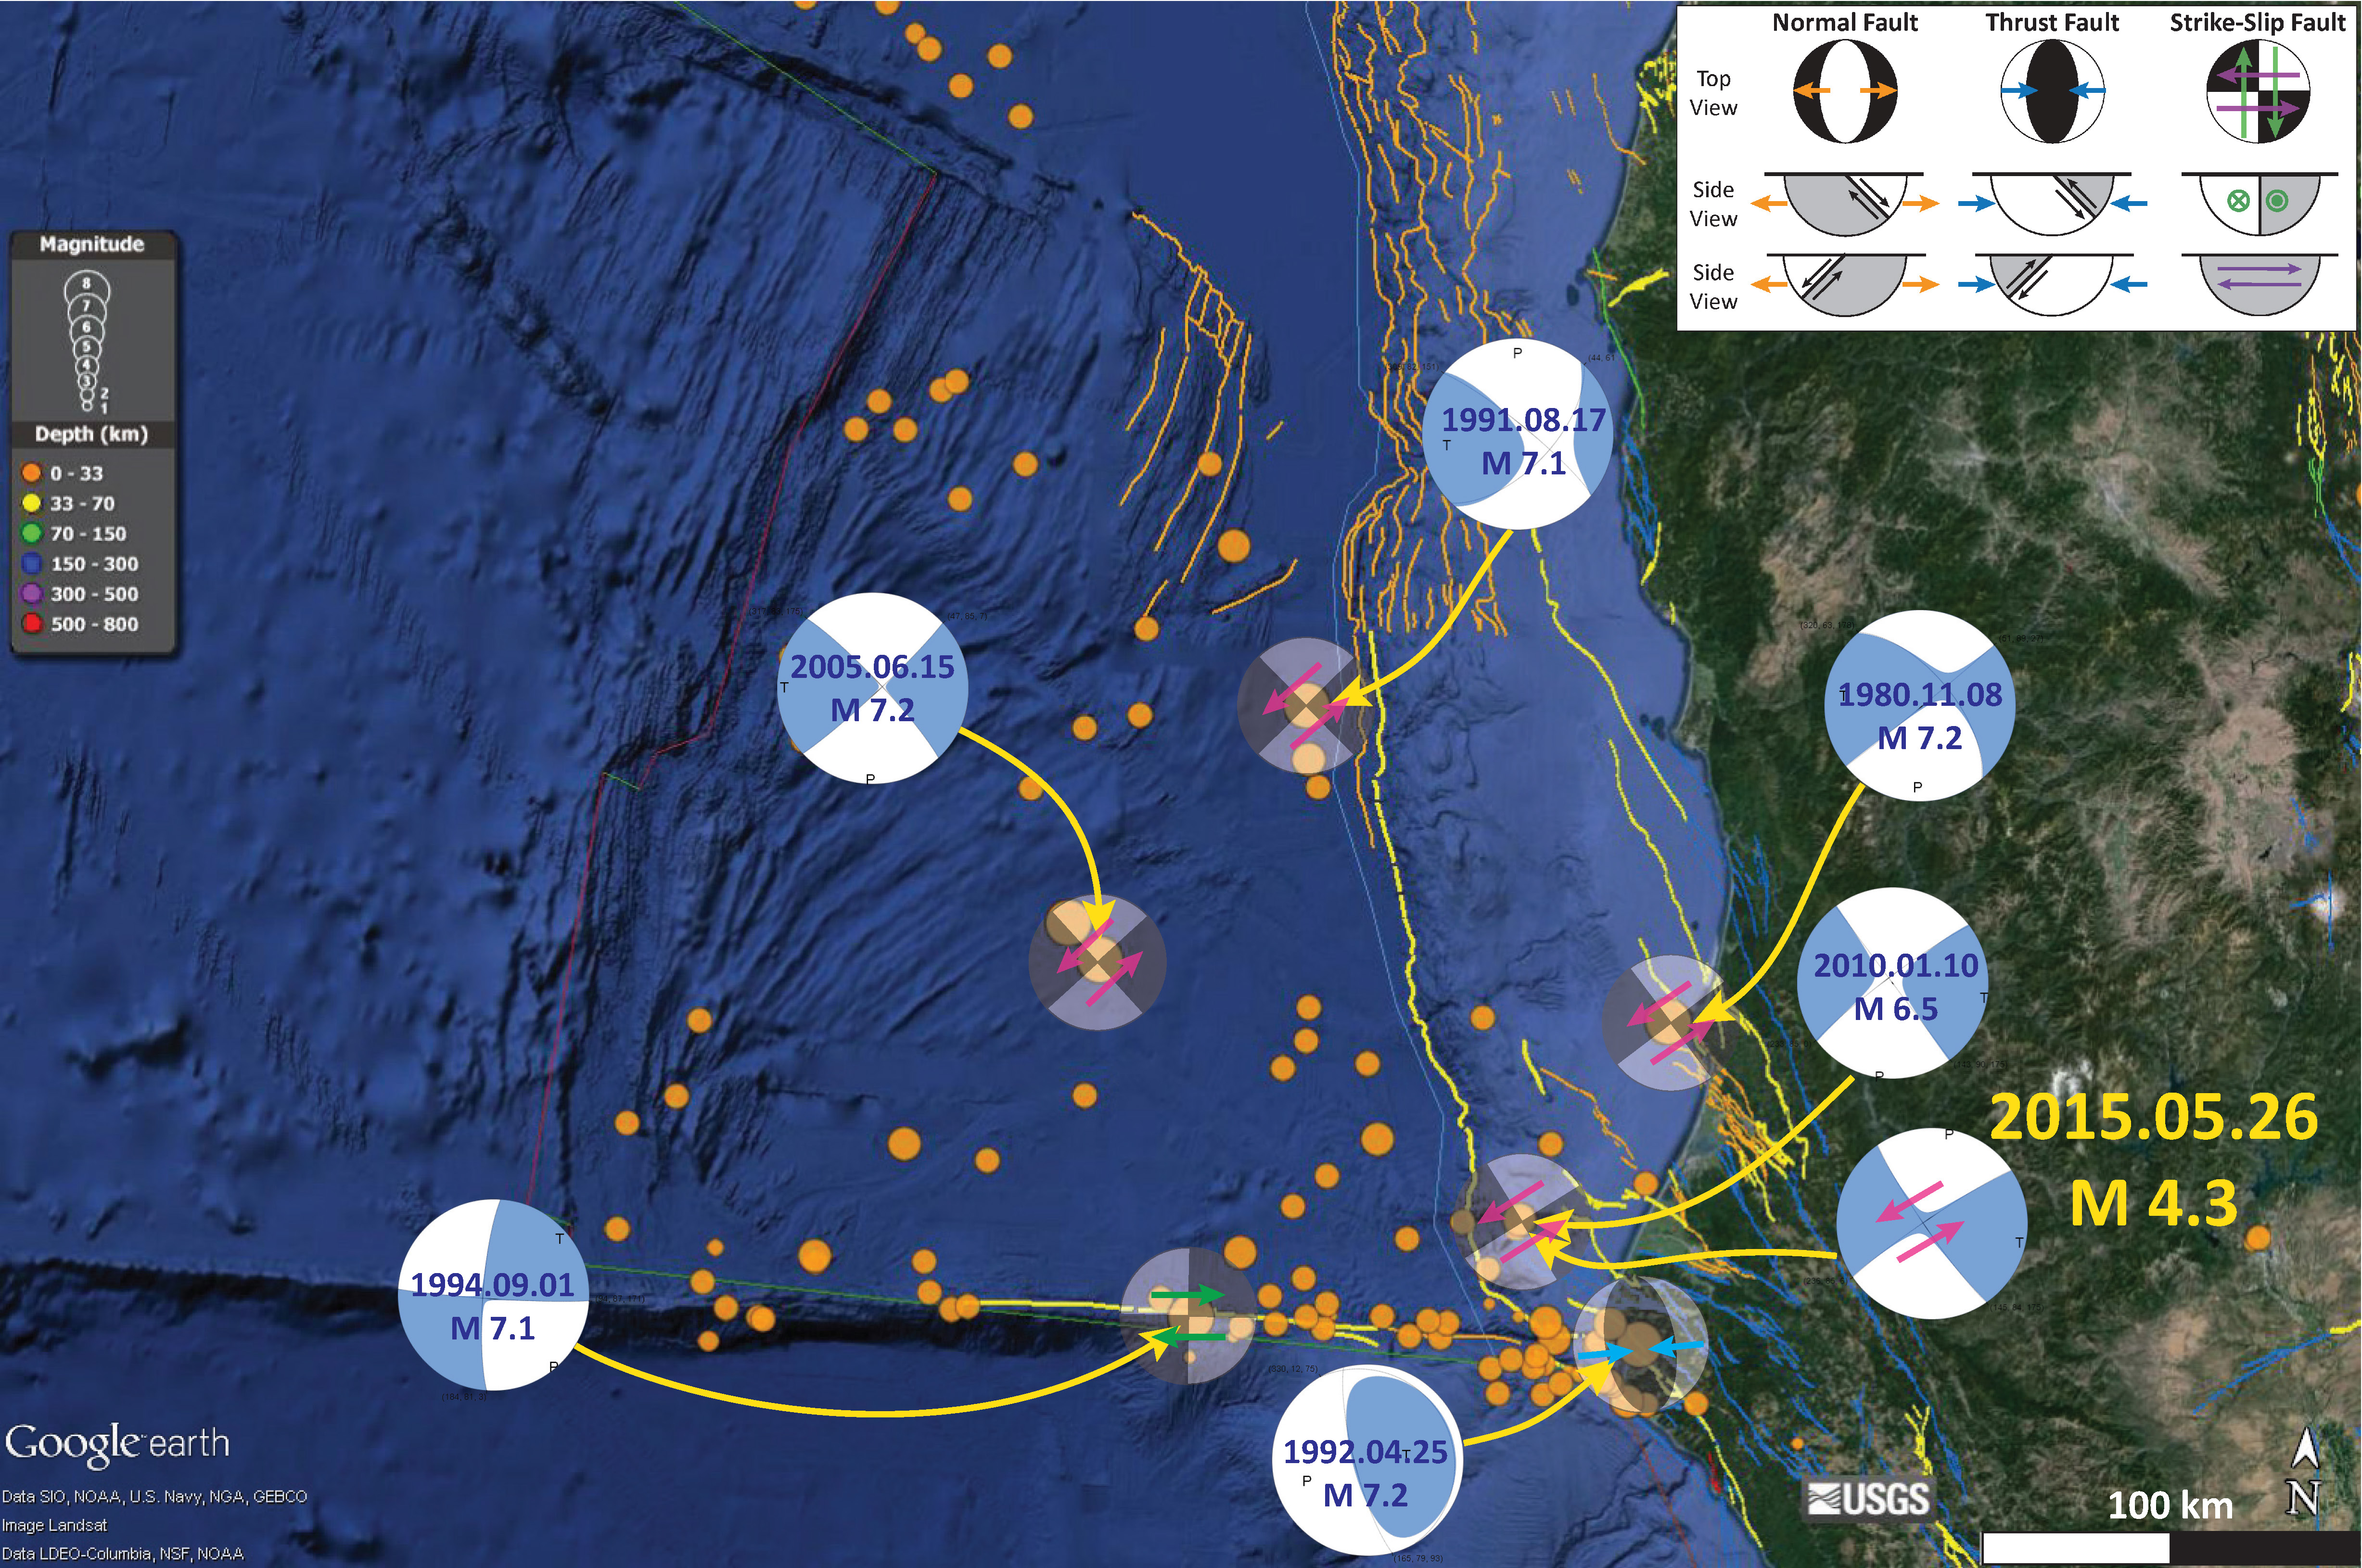
Here is a map that I put together that has some moment tensors for some of the significant earthquakes since 1980. Note how the earthquakes that are in the Gorda plate (read more below) are all left-lateral (sinistral) earthquakes. I also interpret today’s M 4.3 as a left-lateral strike slip earthquake. I discuss more about the deforming Gorda plate below.
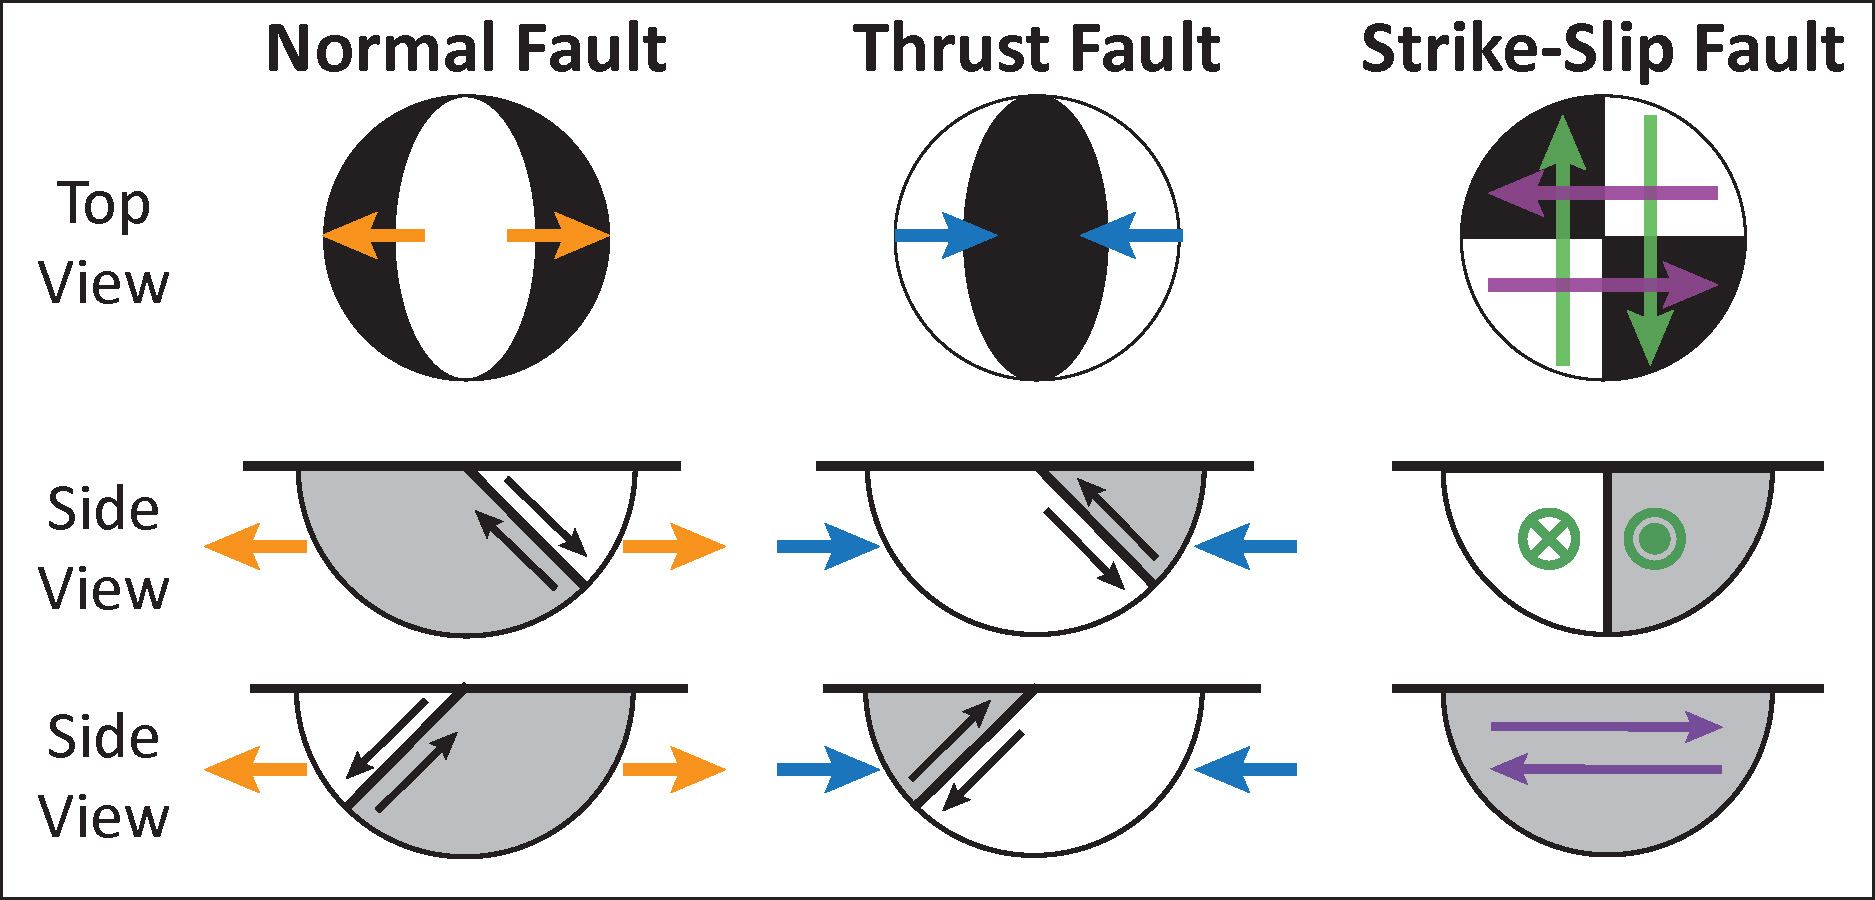
This is a close up view of my Moment Tensor / Focal Mechanism (MT/FM) explanation illustration. Moment Tensors and Focal Mechanisms are two ways of depicting the orientation of fault motion based upon seismologic observations. They are calculated differently, but the graphical depiction of their solutions is the same (the beach balls). The illustration below shows how each MT/FM is depicted from map view (as if looking down on Earth from outer space), as well as from side-view (in cross section). These are lower hemisphere projections of spherical data. Note how there are two potential fault planes for each MT/FM. We must use other knowledge about the region in order to be able to best interpret which is the correct fault plane. For the strike-slip example, the fault plane solution is either a left-lateral (purple arrows) or a right-lateral (green arrows) earthquake. Likewise, the normal (extensional, orange arrows) and thrust (compressional, blue arrows) earthquakes are either dipping to the right or to the left.
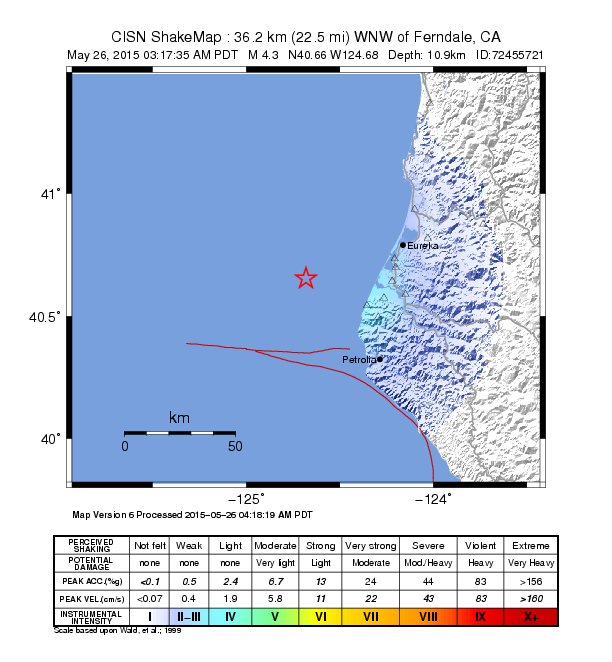
Here are a couple maps that show the ground shaking intensity estimates for this earthquake.
The first one (intensity map) is based upon computer modeling of ground motions based upon a point source and general attenuation relations (as seismic waves propagate from an earthquake rupture, their energy dissipates as it expands across the region, and their energy is absorbed within Earth materials). Due to this attenuation, the energy content in seismic waves diminishes with distance from the earthquake. Both of these maps use the Modified Mercalli Intensity scale (a relative scale of ground shaking intensity based upon observations made by people).
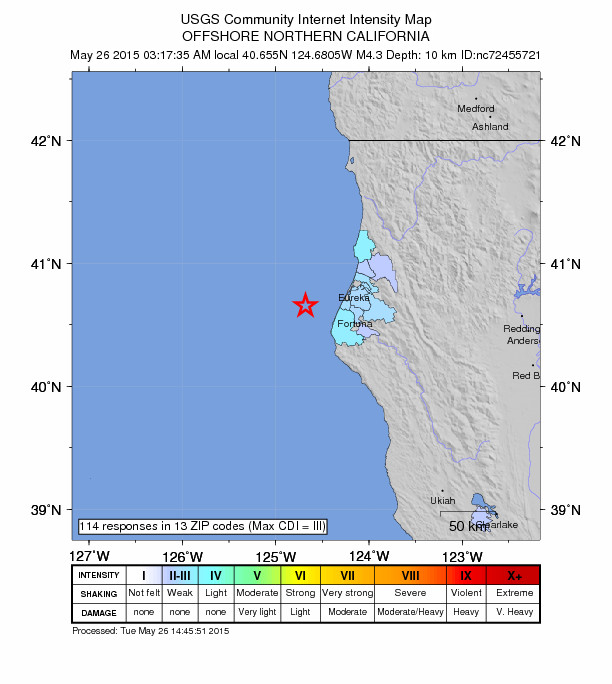
Here is a map (DYFI map) that is based solely upon the reports provided by people who actually felt the earthquake. These observations can be reported to the USGS via their “Did You Feel It?” web page.
Here is a plot showing the attenuation relations used for the intensity map. There is one attenuation relation model shown (orange line), along with real data shown as green dots. Note how the orange line, which plots intensity on the vertical axis) diminishes with distance (horizontal axis).
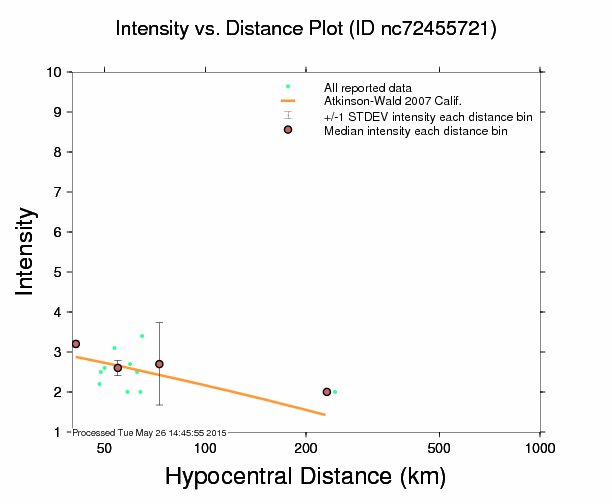
-
Here are the USGS websites for the earthquakes with moment tensors on the above map.
- 1980.11.08 M 7.2
- 1991.08.17 M 7.1
- 1992.04.25 M 7.2
- 1994.09.01 M 7.1
- 2005.06.15 M 7.2
- 2010.01.10 M 6.5
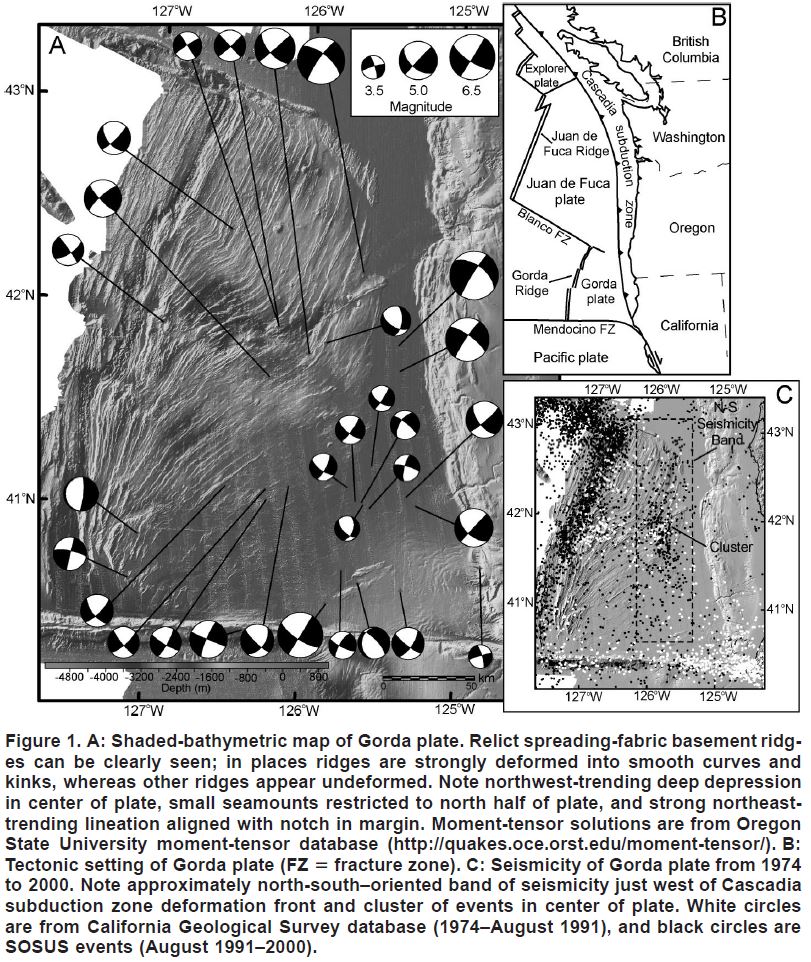
The Gorda plate is deforming due to north-south compression between the Pacific and Juan de Fuca plates. There have been many papers written about this. The most recent and comprehensive review is from Jason Chaytor (Chaytor et al., 2004). Here is a map of the Cascadia subduction zone, as modified from Nelson et al. (2006) and Chaytor et al. (2004). I have updated the figure to be good for projections in a dark room (green) and to have the correct sense of motion on the two transform plate boundaries at either end of the CSZ (Queen Charlotte and San Andreas faults).

Here is the Chaytor et al. (2004) map that shows their interpretation of the structural relations in the Gorda plate.

This is also from Chaytor et al. (2004) and shows moment tensor solutions for earthquakes in the Gorda plate. Note how they could predominantly be interpreted as northeast striking strike-slip faults.
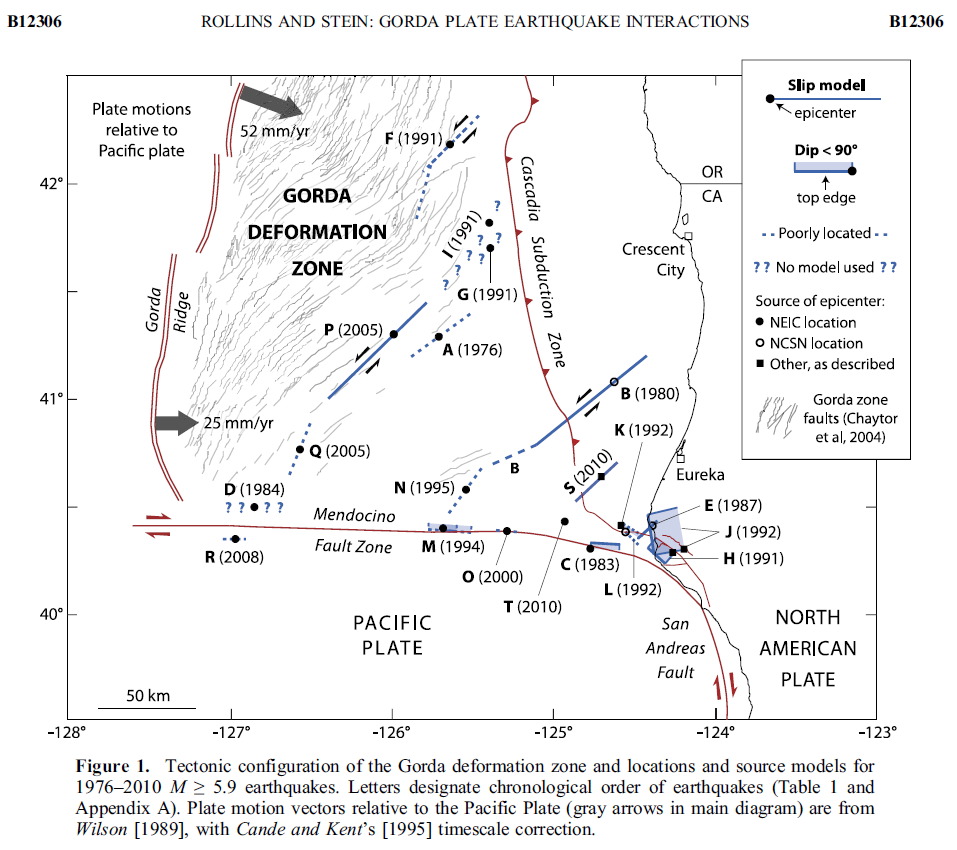
Here is a map from Rollins and Stein, showing their interpretations of different historic earthquakes in the region. This was published in response to the Januray 2010 Gorda plate earthquake. The faults are from Chaytor et al. (2004).
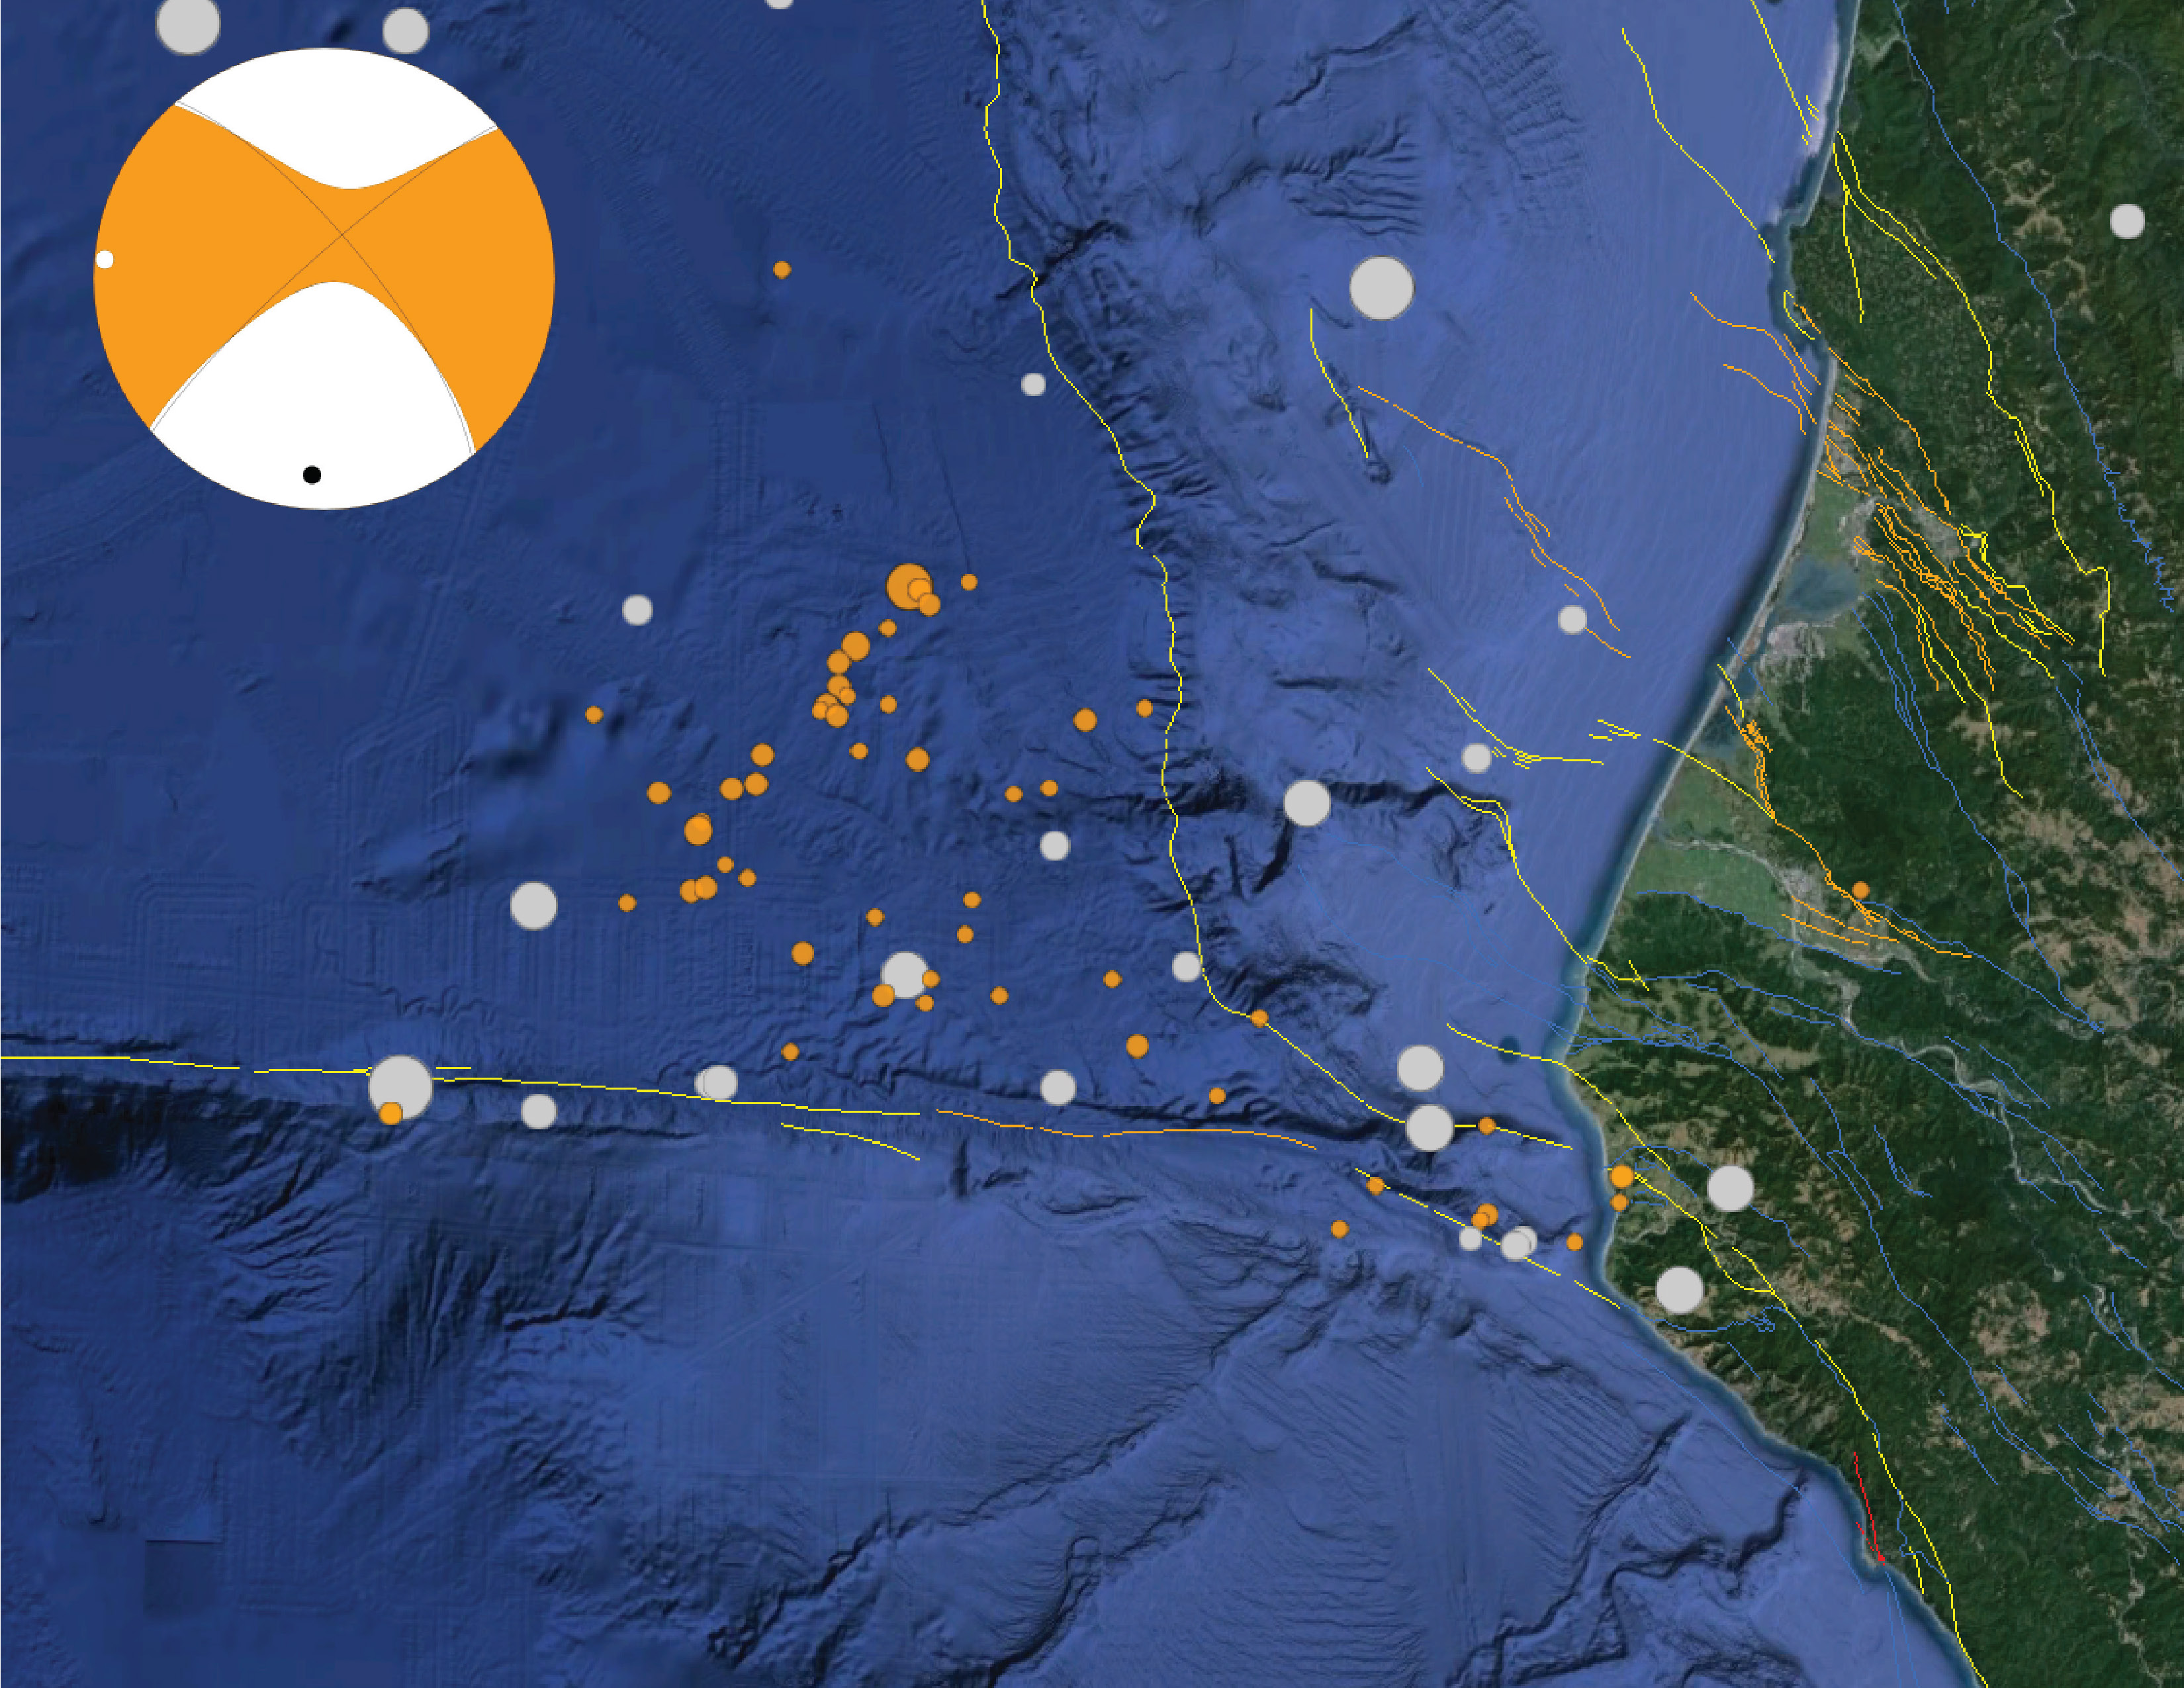
This map shows an earthquake swarm from 2014, which appears to align along another northeast striking strike-slip earthquake fault in the Gorda plate. This swarm is related to a Mw 6.8 earthquake. Check out my pages about the mainshock and the aftershocks. I made some animations of these earthquakes here.
Here is a primer for those who want to learn more about focal mechanisms. This is from the USGS, where you can read more about them. Moment tensors are calculated differently, but their graphical representation is very similar to that of focal mechanisms.
-
Here are some posts of mine for recent earthquakes in the Gorda plate.
- 2013.12.17 M 4.1
- 2014.03.10 M 6.8
- 2014.03.11 M 6.8 aftershocks
- 2014.03.13 M 5.2 (near the Gorda Ridge)
- 2015.01.28 M 5.7 (Mendocino fault)
References:
- Chaytor, J.D., Goldfinger, C., Dziak, R.P., and Fox, C.G., 2004. Active deformation of the Gorda plate: Constraining deformation models with new geophysical data: Geology v. 32, p. 353-356.
- Nelson, A.R., Kelsey, H.M., and Witter, R.C., 2006. Great earthquakes of variable magnitude at the Cascadia subduction zone: Quaternary Research, doi:10.1016/j.yqres.2006.02.009, p. 354-365.
- Rollins, J.C. and Stein, R.S., 2010. Coulomb stress interactions among M ≥ 5.9 earthquakes in the Gorda deformation zone and on the Mendocino Fault Zone, Cascadia subduction zone, and northern San Andreas Fault: Journal of Geophysical Research, v. 115, B12306, doi:10.1029/2009JB007117, 2010.
For some reason, the DYFI popup box submission button won’t work. Frustrating to get all the way through the questions, just to be denied.
http://earthquake.usgs.gov/earthquakes/eventpage/nc72455721#impact_tellus
does this work?
yes, that is frustrating! thanks for trying!!!!
Turns out it was operator error (the location stuff was scrolled off the top, so I never saw it.) I just successfully tried again.